
#tradingsignal
tradingsignal
12.7M නැරඹීම්
54,461 සාකච්ඡා කරමින්
උණුසුම්
නවතම

·
--
🔥 NAORISUSDT SHORT SETUP
Bias: SHORT | Combined Score: 37.17
Entry: 0.03494
SL: 0.035335 | TP1: 0.034347 | TP2: 0.033952
24h price +14.85% | Volume spikes 5m +217.72% | Price 15m -2.32%
A bearish pressure setup with strong volume confirmation. Price rejecting higher levels.
Will price break TP1 or bounce back? 📉
#CryptoSetup
$NAORIS #TradingSignal #CryptoAnalysis
🔥 NAORISUSDT SHORT SETUP
Bias: SHORT | Combined Score: 37.17
Entry: 0.03494
SL: 0.035335 | TP1: 0.034347 | TP2: 0.033952
24h price +14.85% | Volume spikes 5m +217.72% | Price 15m -2.32%
A bearish pressure setup with strong volume confirmation. Price rejecting higher levels.
Will price break TP1 or bounce back? 📉
#CryptoSetup
$NAORIS #TradingSignal #CryptoAnalysis
Bias: SHORT | Combined Score: 37.17
Entry: 0.03494
SL: 0.035335 | TP1: 0.034347 | TP2: 0.033952
24h price +14.85% | Volume spikes 5m +217.72% | Price 15m -2.32%
A bearish pressure setup with strong volume confirmation. Price rejecting higher levels.
Will price break TP1 or bounce back? 📉
#CryptoSetup
$NAORIS #TradingSignal #CryptoAnalysis

33
·
--
🔥 SKYAIUSDT LONG setup triggered.
Combined Score: 64.65 | Performance: 100
Entry: 0.03926 | SL: 0.038795 | TP1: 0.039958 | TP2: 0.040424
Strong volume spikes and momentum support breakout structure.
⚠️ This is a setup, not a guaranteed result.
Question: Are you watching the volume confirmation? #CryptoAnalysis
$SKYAI #TradingSignal #CryptoAnalysis
🔥 SKYAIUSDT LONG setup triggered.
Combined Score: 64.65 | Performance: 100
Entry: 0.03926 | SL: 0.038795 | TP1: 0.039958 | TP2: 0.040424
Strong volume spikes and momentum support breakout structure.
⚠️ This is a setup, not a guaranteed result.
Question: Are you watching the volume confirmation? #CryptoAnalysis
$SKYAI #TradingSignal #CryptoAnalysis
Combined Score: 64.65 | Performance: 100
Entry: 0.03926 | SL: 0.038795 | TP1: 0.039958 | TP2: 0.040424
Strong volume spikes and momentum support breakout structure.
⚠️ This is a setup, not a guaranteed result.
Question: Are you watching the volume confirmation? #CryptoAnalysis
$SKYAI #TradingSignal #CryptoAnalysis

17

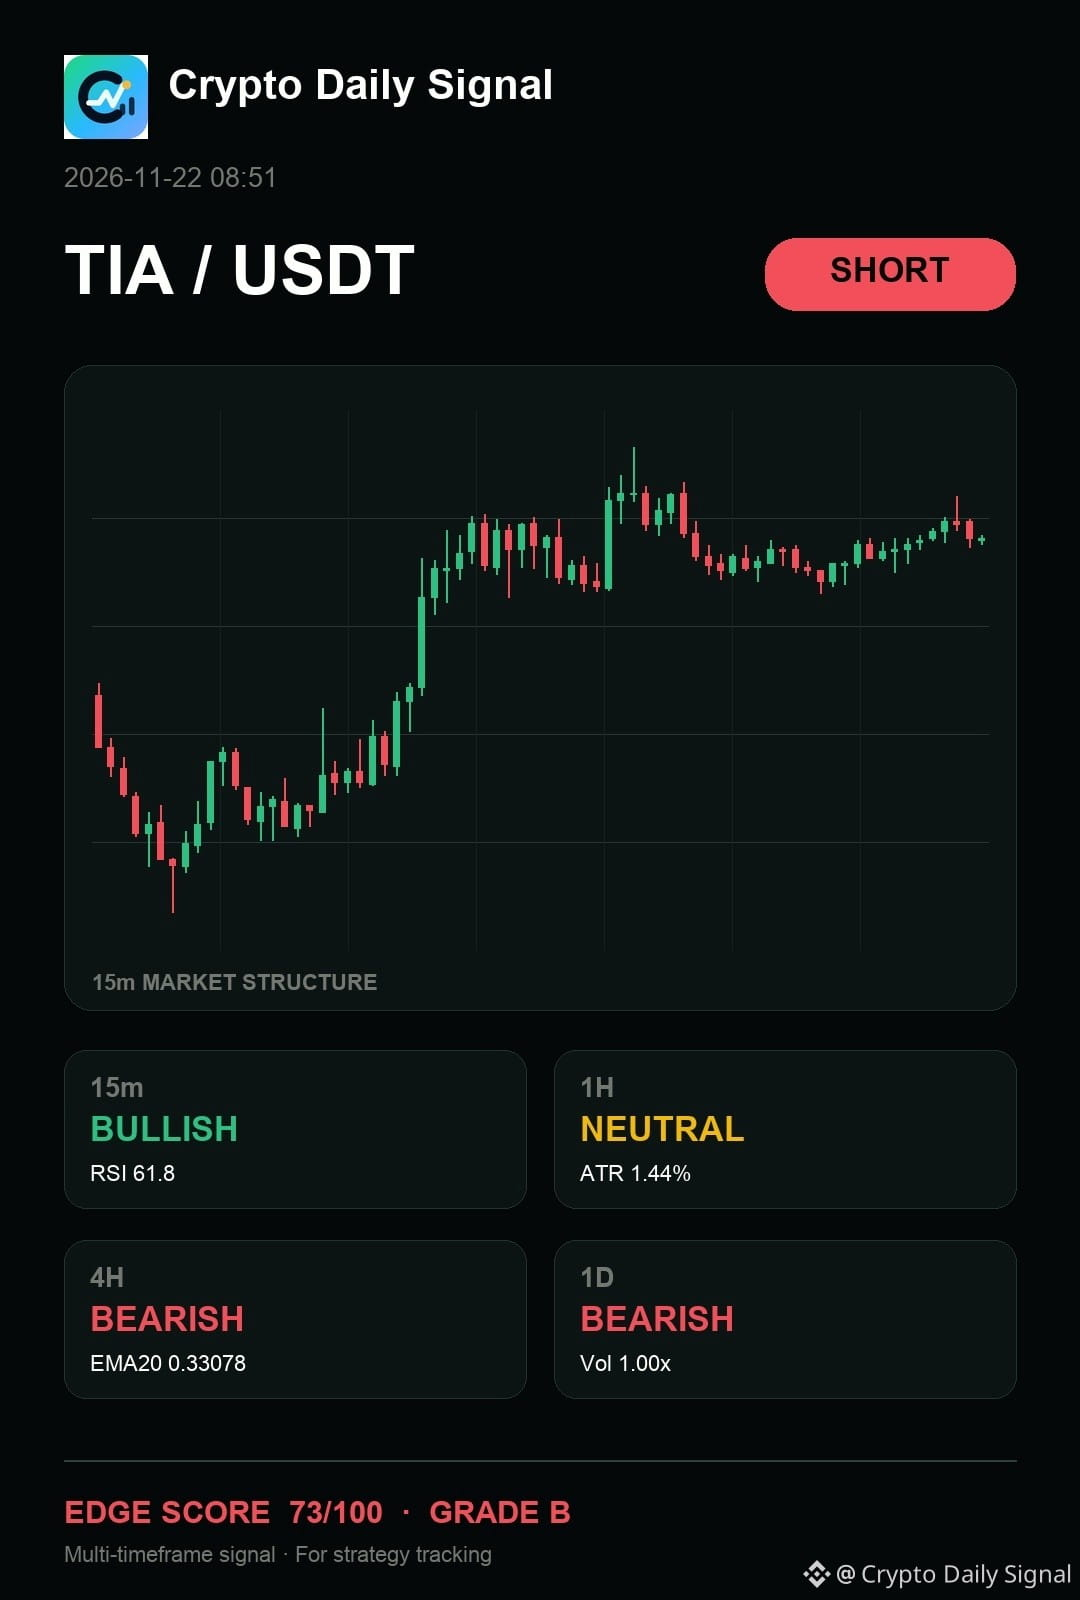
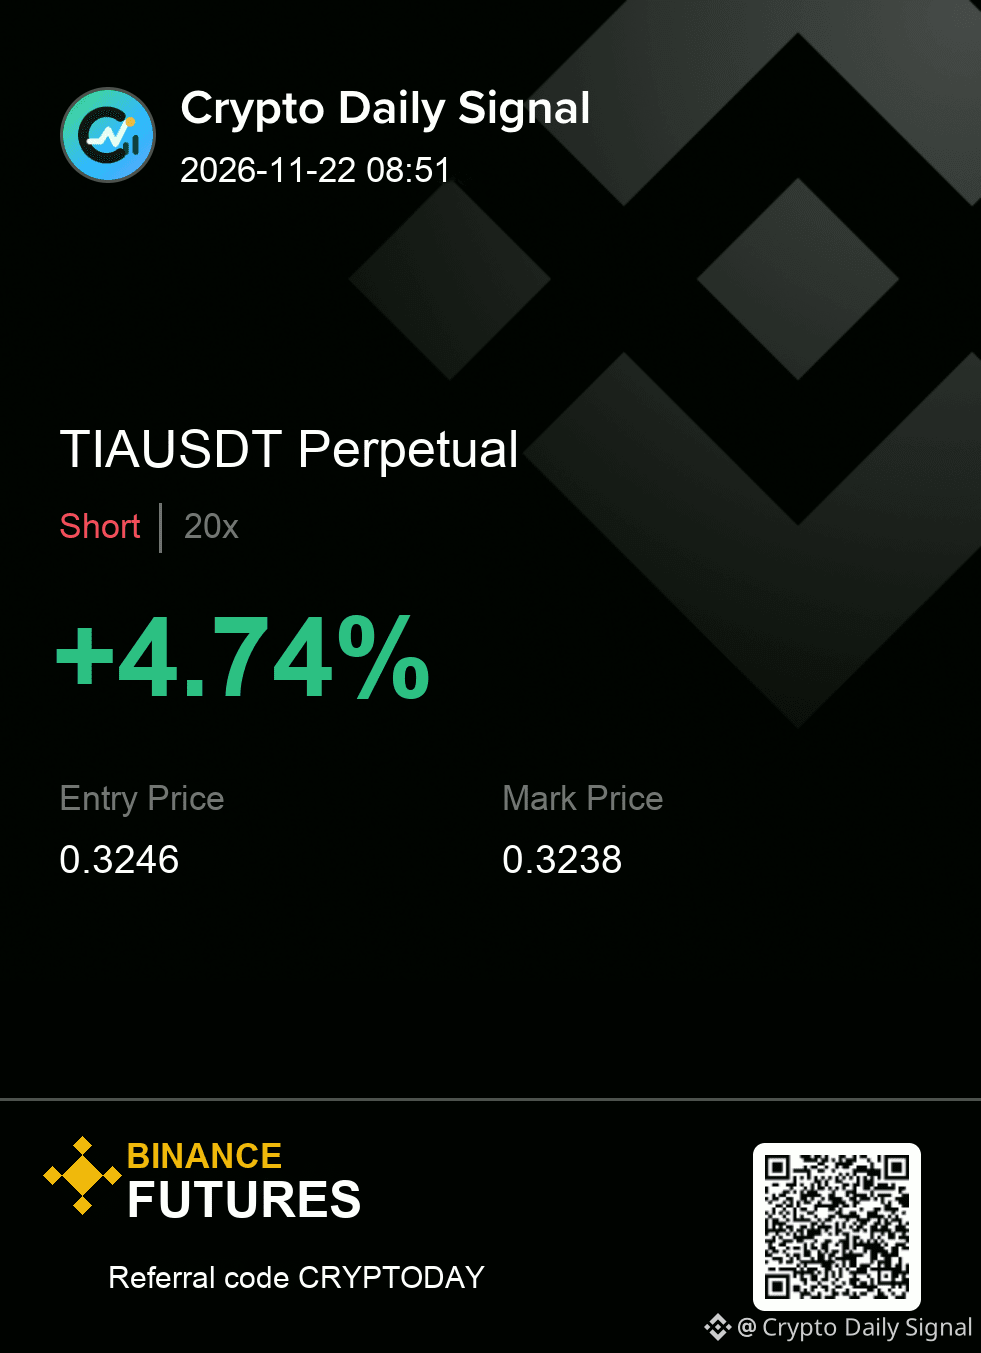
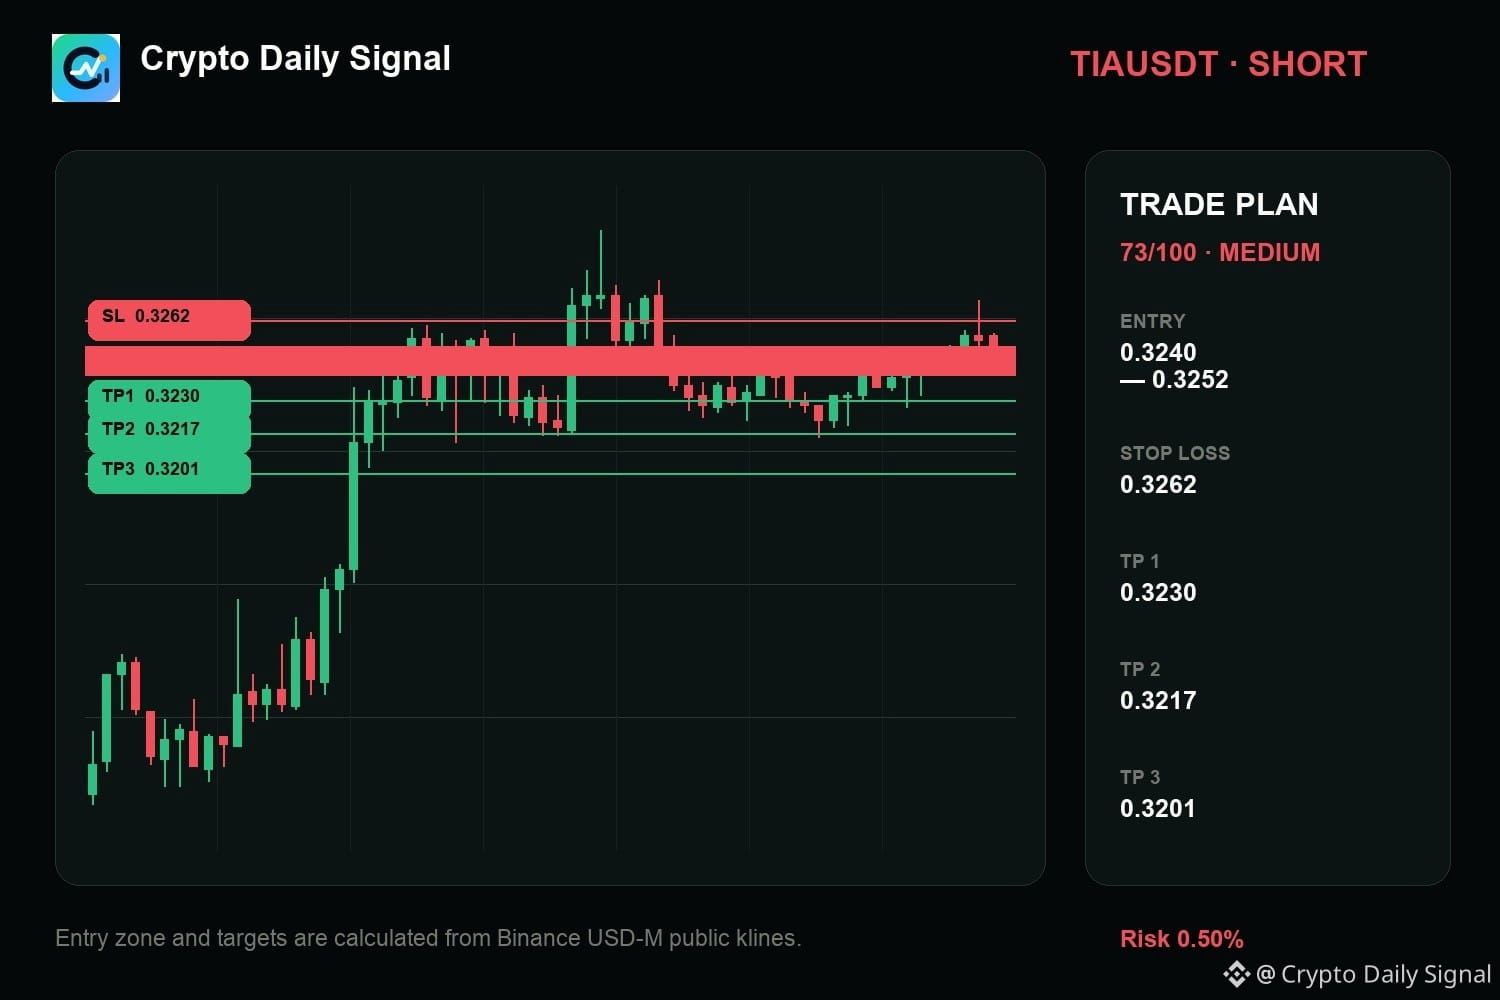
$TIA continues to favor the short case after failing to push past the recent short-term resistance. The fifteen-minute chart is showing clear formations of lower highs, aligning with the bearish tilt visible on the daily and four-hour views. A breakdown below the floor of this range would confirm the downside.
The levels matter more than the prediction. Size it accordingly.
TIAUSDT | SHORT
Entry 0.3240 - 0.3252
Invalidation 0.3262
Targets 0.3230 / 0.3217 / 0.3201
#TradingSignal
{future}(TIAUSDT)
$TIA continues to favor the short case after failing to push past the recent short-term resistance. The fifteen-minute chart is showing clear formations of lower highs, aligning with the bearish tilt visible on the daily and four-hour views. A breakdown below the floor of this range would confirm the downside.
The levels matter more than the prediction. Size it accordingly.
TIAUSDT | SHORT
Entry 0.3240 - 0.3252
Invalidation 0.3262
Targets 0.3230 / 0.3217 / 0.3201
#TradingSignal
The levels matter more than the prediction. Size it accordingly.
TIAUSDT | SHORT
Entry 0.3240 - 0.3252
Invalidation 0.3262
Targets 0.3230 / 0.3217 / 0.3201
#TradingSignal
4
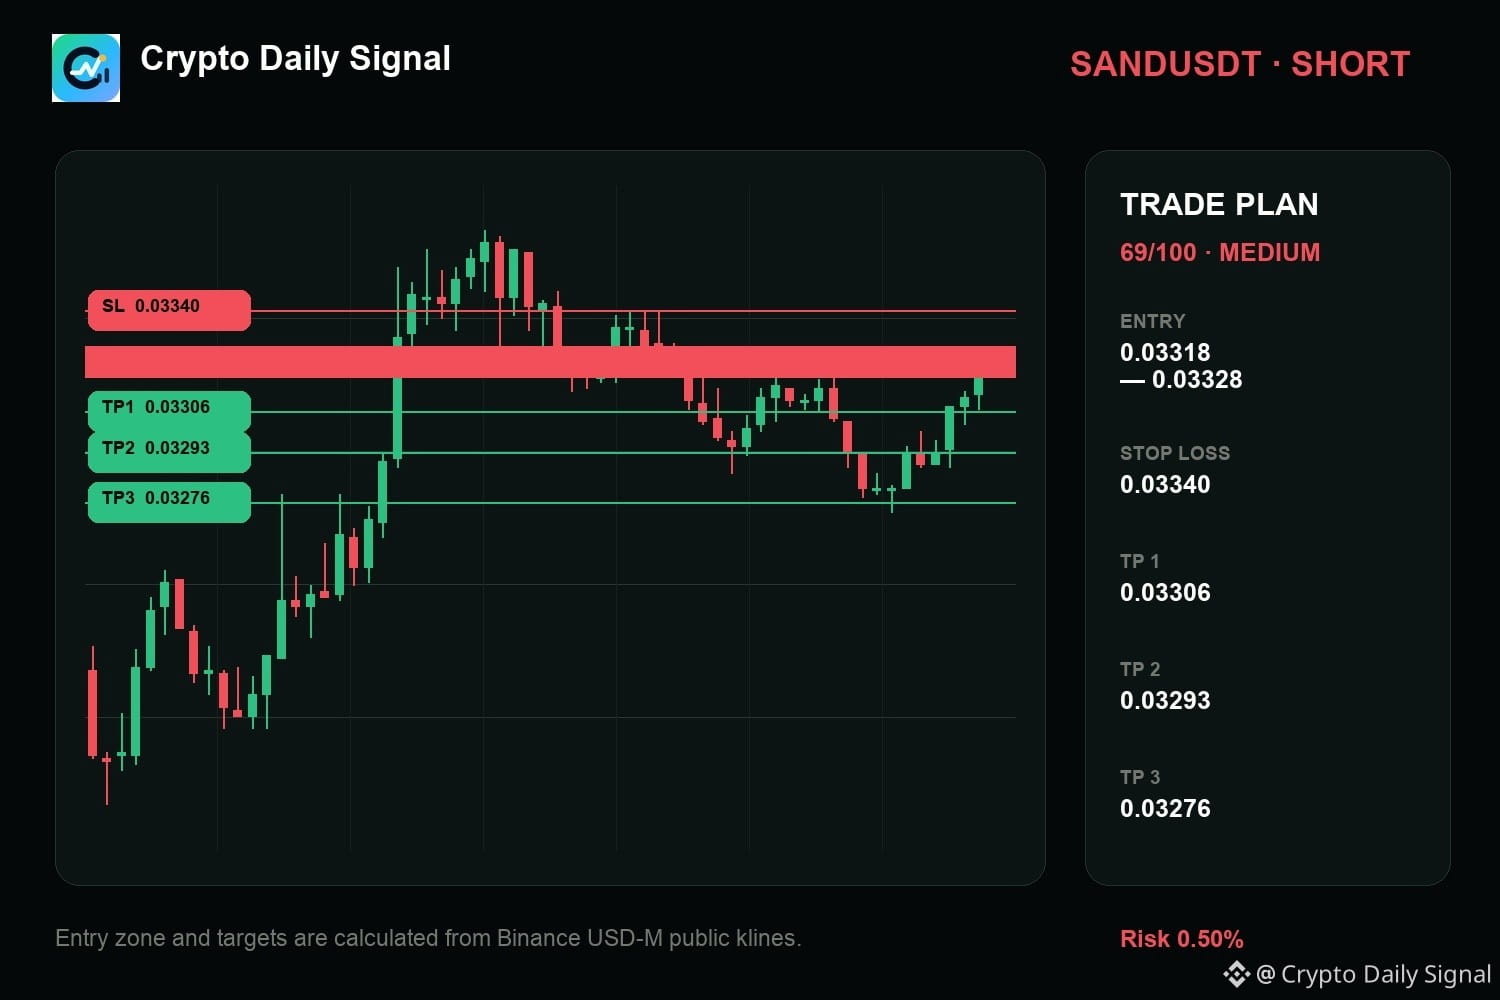
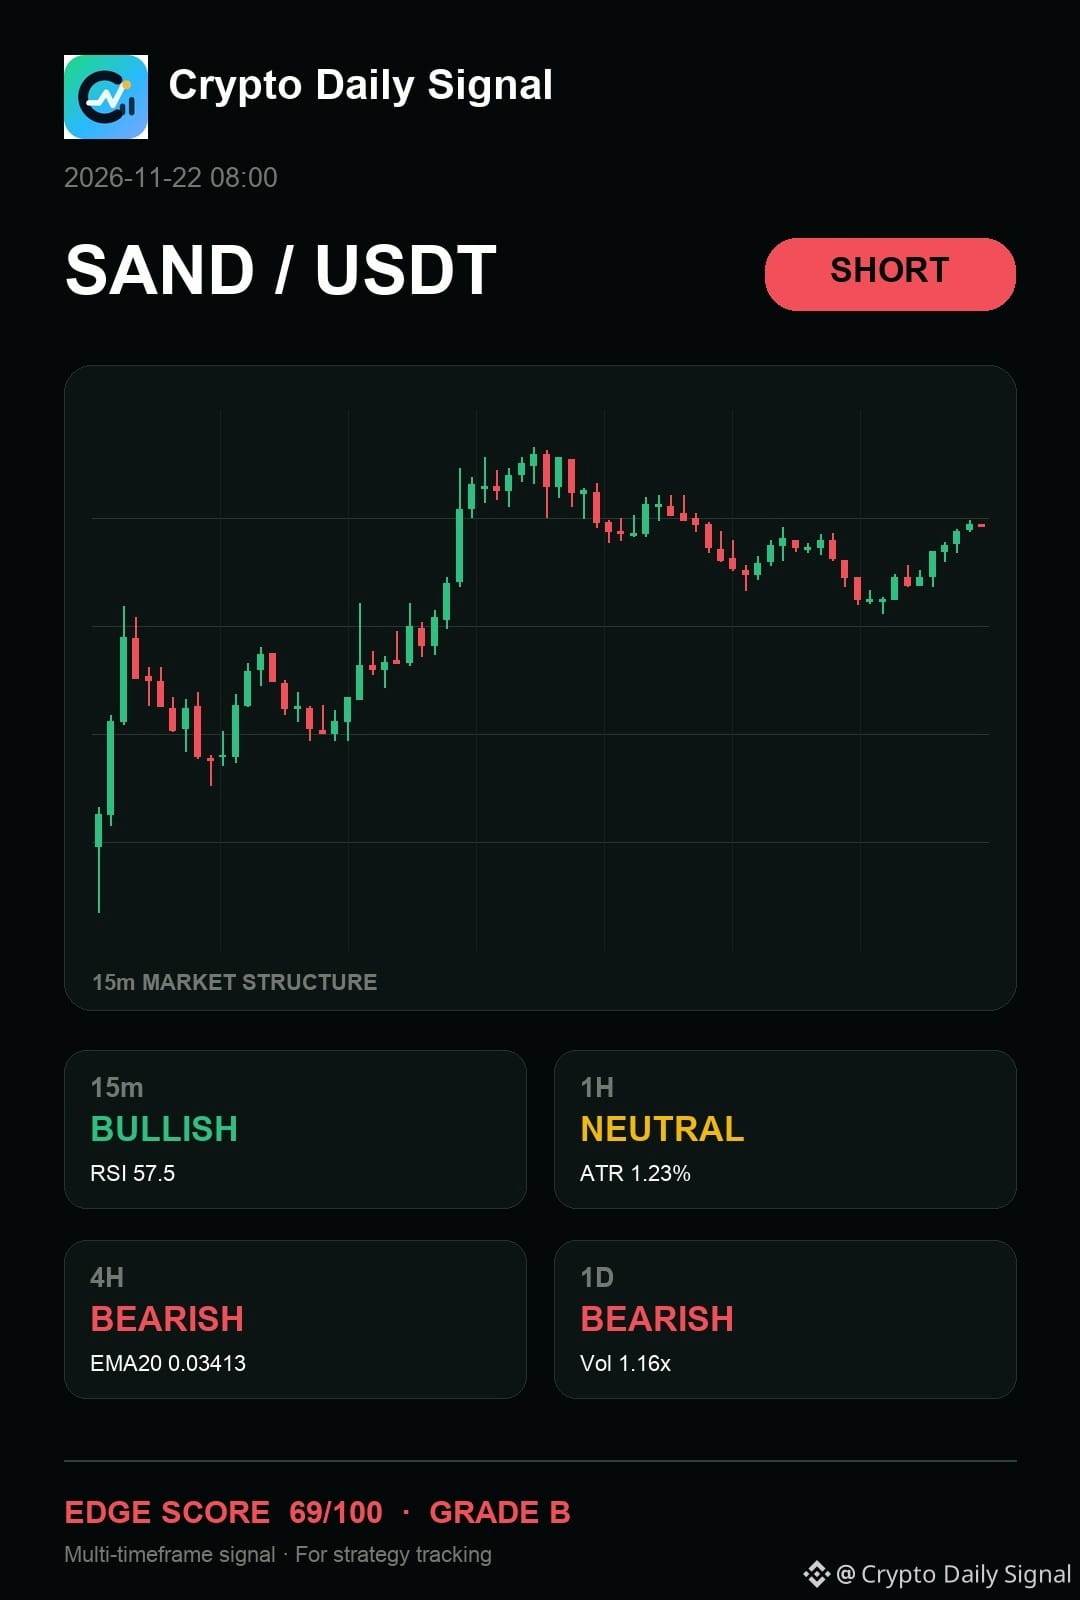
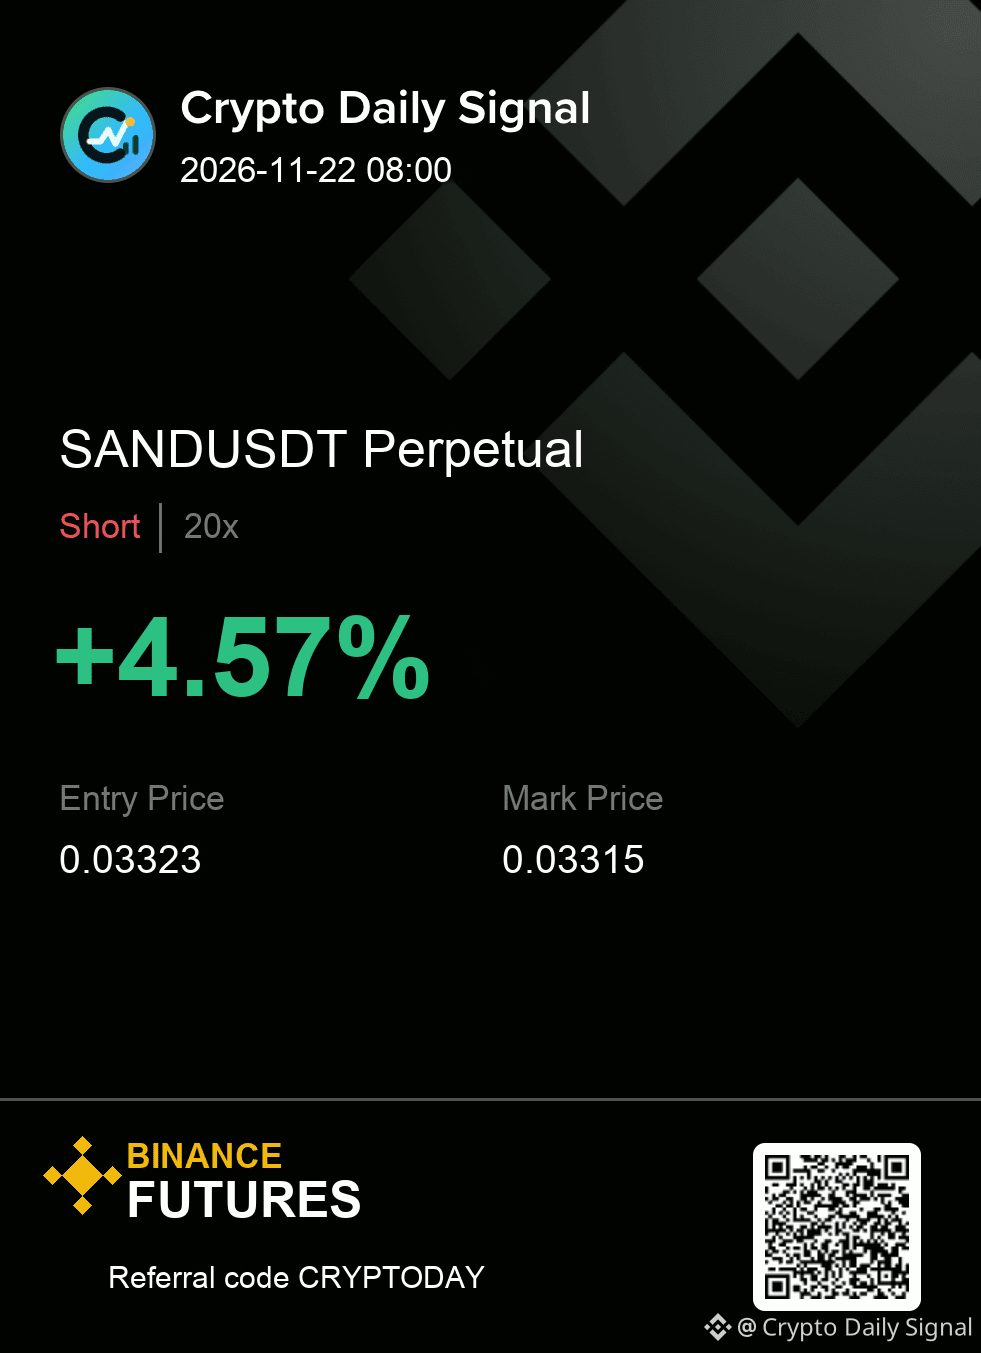
$SAND — look, my read is simple: it is a patience trade on the short side as the price is currently boxing in between its recent high and low points. Bearish candles are setting up lower highs, which fits the wider bearish tone seen on the daily and four-hour charts. A decisive break below the established floor would give this a clearer path, but a firm move above the prior swing high kills the thought immediately.
The map is useful only while the invalidation remains intact.
SANDUSDT | SHORT
Entry 0.03318 - 0.03328
Invalidation 0.03340
Targets 0.03306 / 0.03293 / 0.03276
#TradingSignal
{future}(SANDUSDT)
$SAND — look, my read is simple: it is a patience trade on the short side as the price is currently boxing in between its recent high and low points. Bearish candles are setting up lower highs, which fits the wider bearish tone seen on the daily and four-hour charts. A decisive break below the established floor would give this a clearer path, but a firm move above the prior swing high kills the thought immediately.
The map is useful only while the invalidation remains intact.
SANDUSDT | SHORT
Entry 0.03318 - 0.03328
Invalidation 0.03340
Targets 0.03306 / 0.03293 / 0.03276
#TradingSignal
The map is useful only while the invalidation remains intact.
SANDUSDT | SHORT
Entry 0.03318 - 0.03328
Invalidation 0.03340
Targets 0.03306 / 0.03293 / 0.03276
#TradingSignal
3
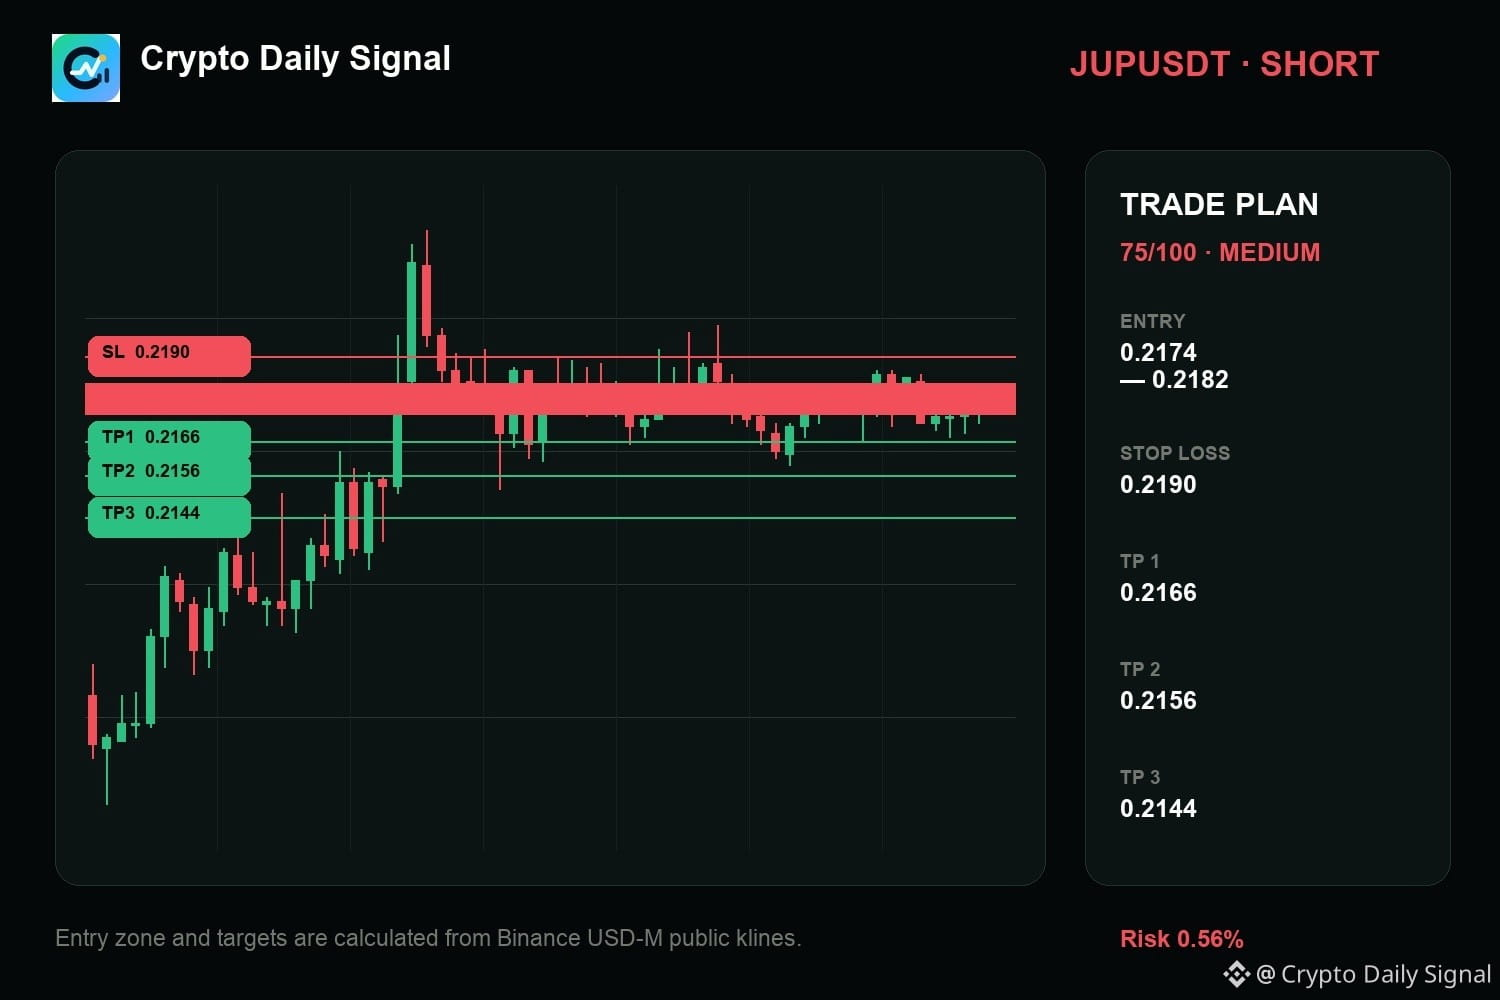
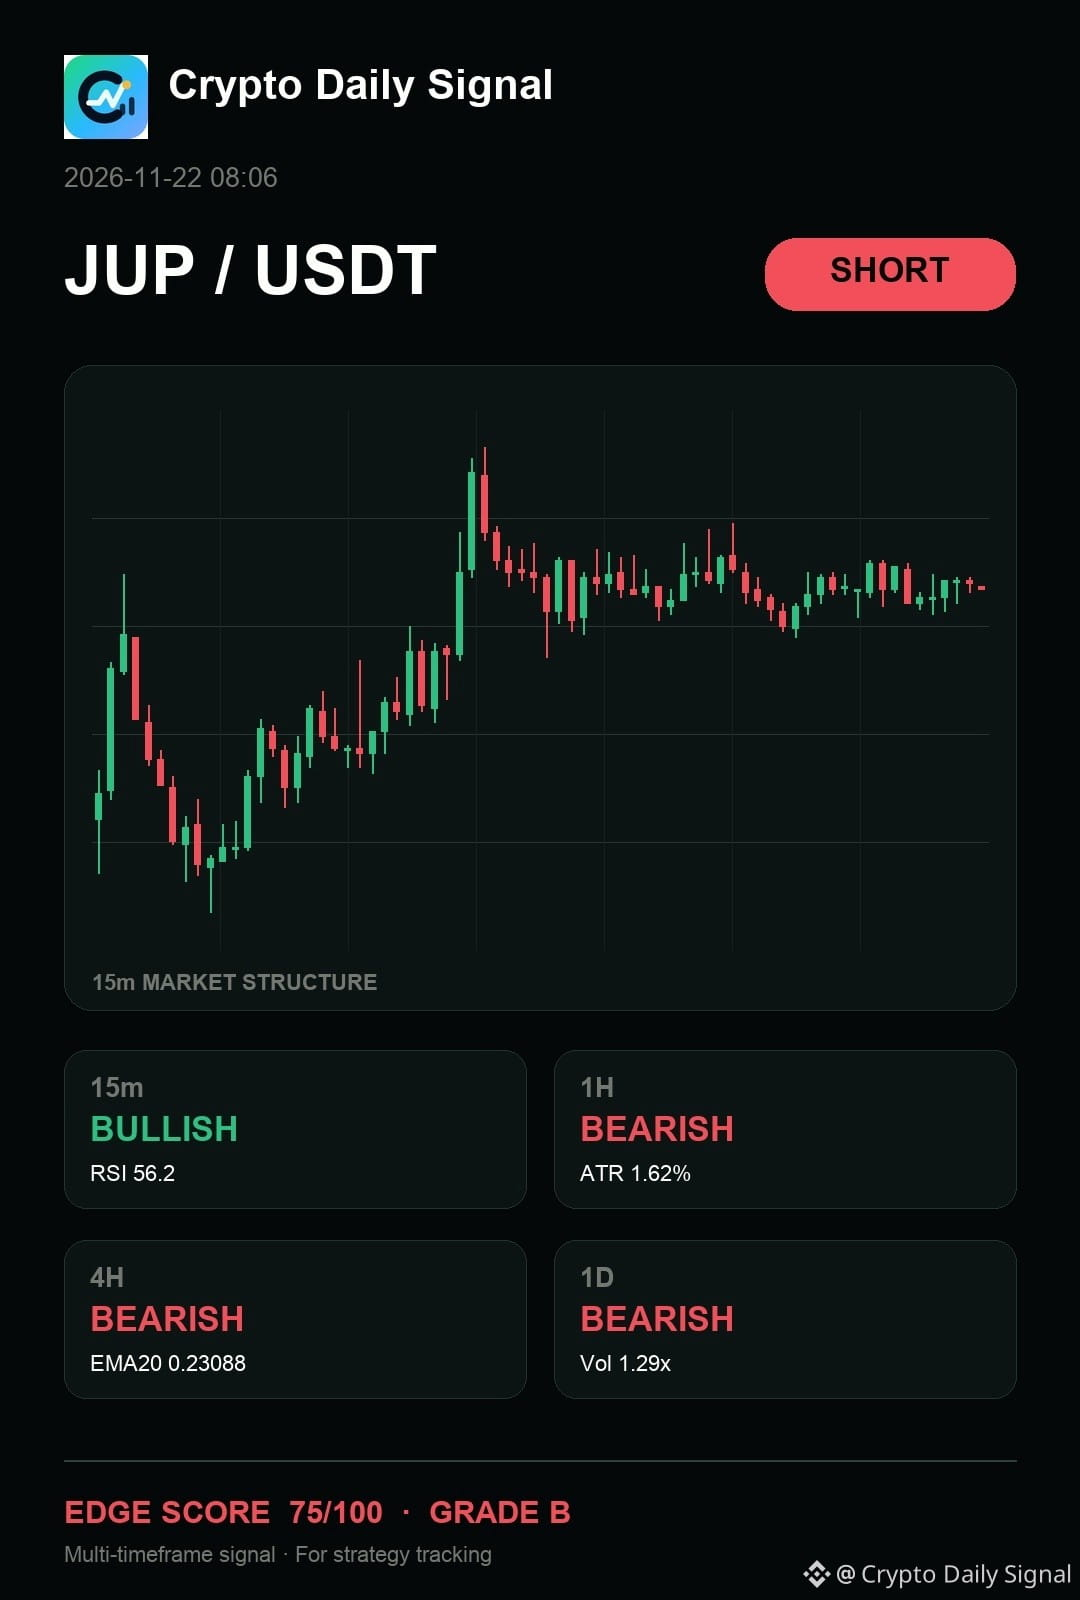
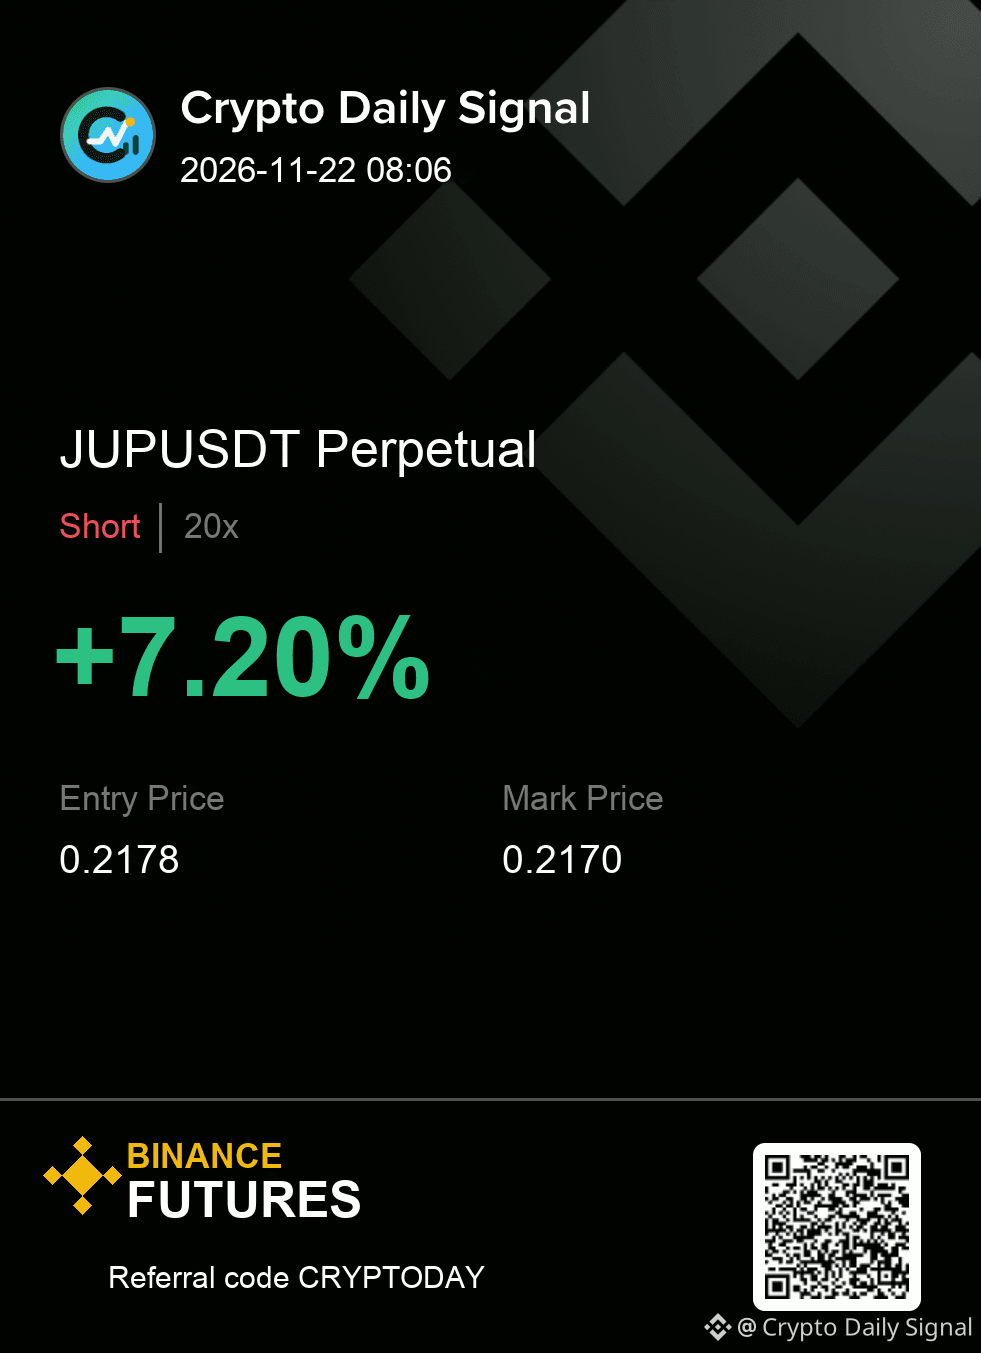
$JUP — okay, my read still says it still offers the cleaner bearish argument as the asset is trapped in a choppy range despite short-term upward nudges. The wider trends on the daily and four-hour charts suggest downside bias, making a break below the current range floor necessary for the short to play out. If it convincingly clears that short-term high, the idea reverses.
Confirmation first or early entry — which side of that trade-off are you on?
My levels for JUPUSDT — SHORT
Entry zone 0.2174 - 0.2182
Risk line 0.2190
Targets 0.2166 / 0.2156 / 0.2144
#TradingSignal
{future}(JUPUSDT)
$JUP — okay, my read still says it still offers the cleaner bearish argument as the asset is trapped in a choppy range despite short-term upward nudges. The wider trends on the daily and four-hour charts suggest downside bias, making a break below the current range floor necessary for the short to play out. If it convincingly clears that short-term high, the idea reverses.
Confirmation first or early entry — which side of that trade-off are you on?
My levels for JUPUSDT — SHORT
Entry zone 0.2174 - 0.2182
Risk line 0.2190
Targets 0.2166 / 0.2156 / 0.2144
#TradingSignal
Confirmation first or early entry — which side of that trade-off are you on?
My levels for JUPUSDT — SHORT
Entry zone 0.2174 - 0.2182
Risk line 0.2190
Targets 0.2166 / 0.2156 / 0.2144
#TradingSignal
3
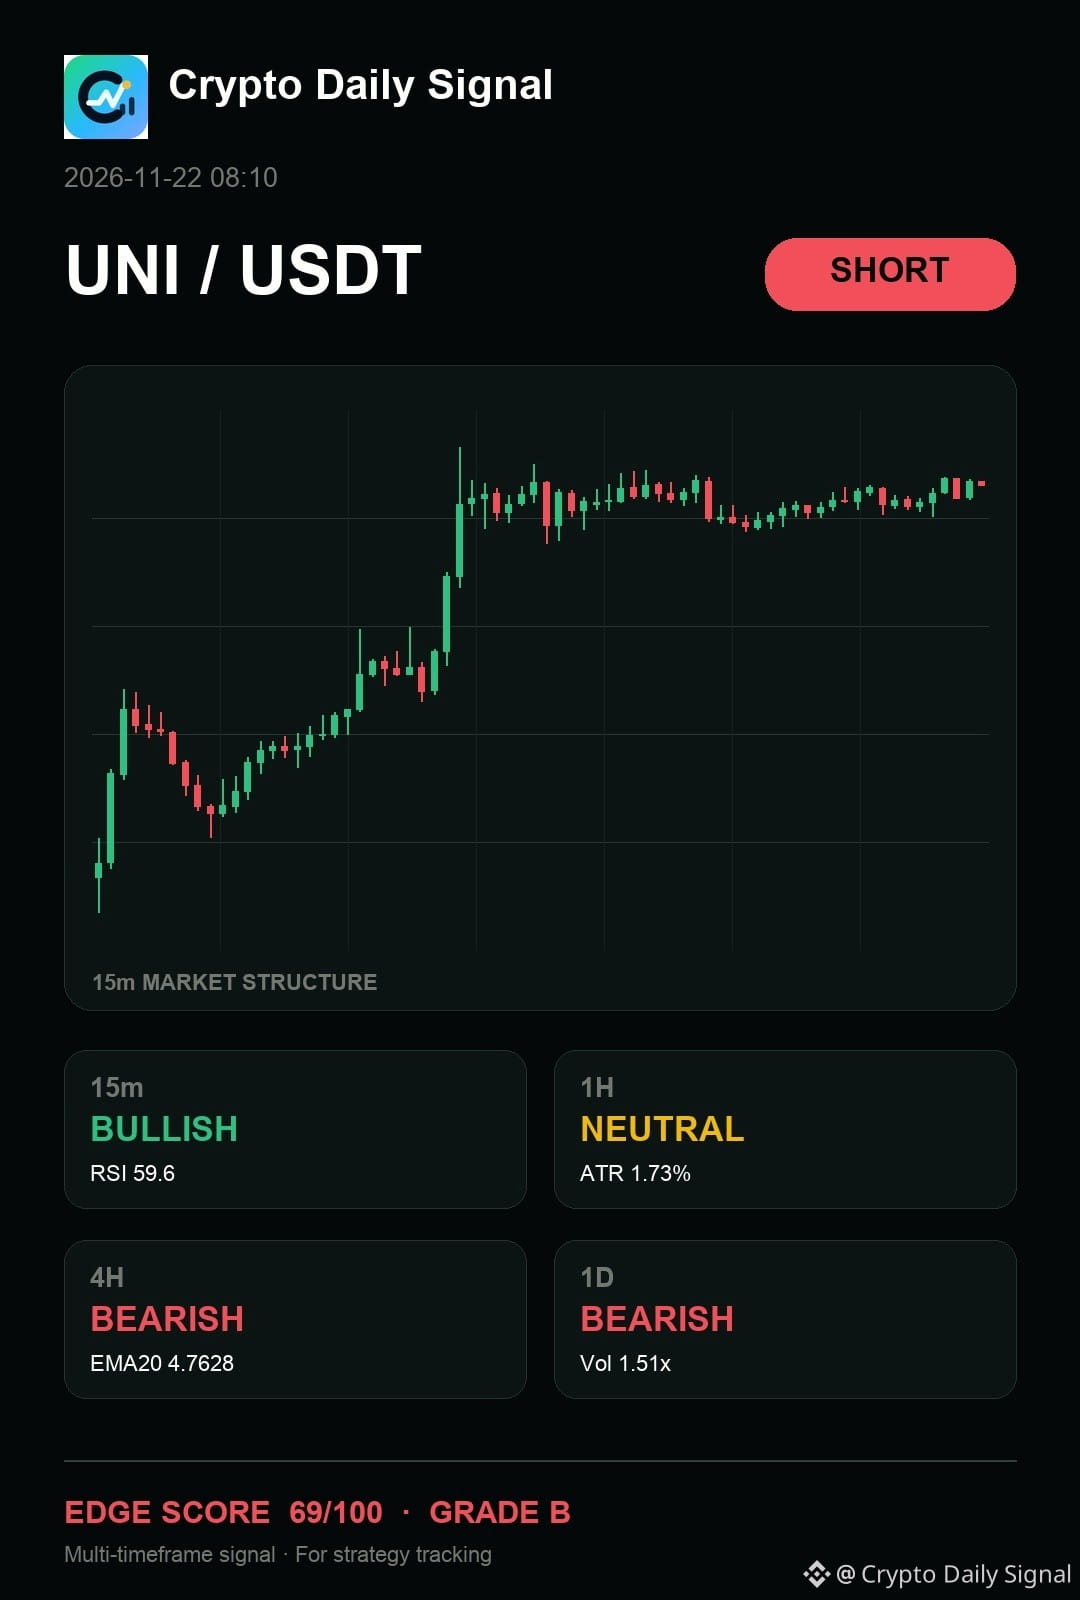
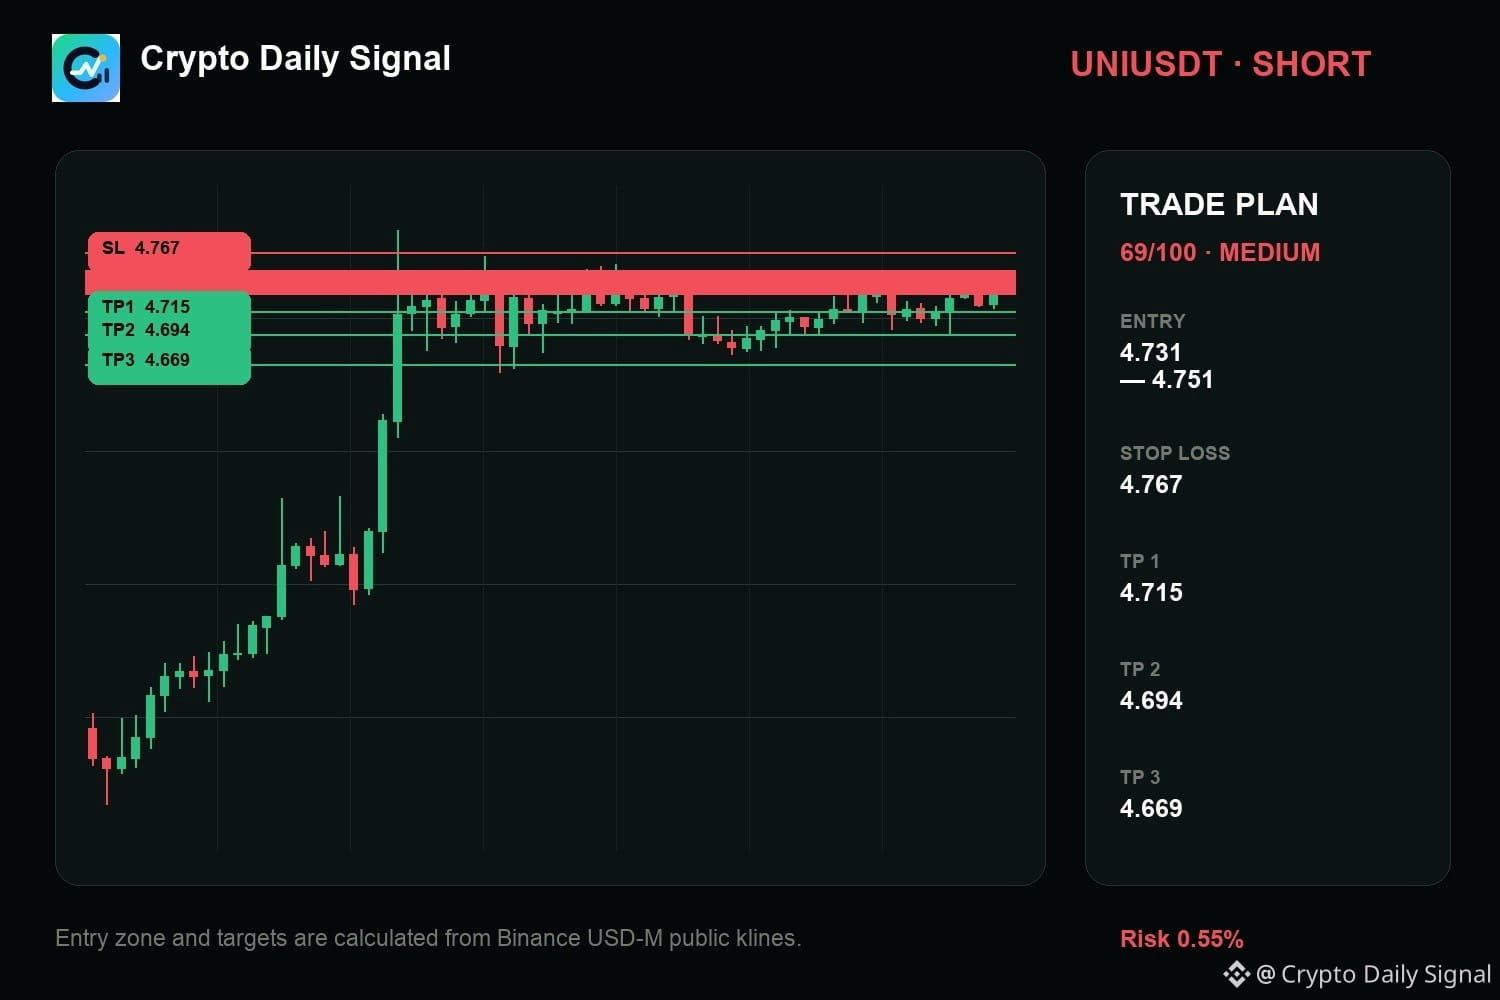
$UNI still gives sellers the cleaner argument as it tests the upper boundary of its recent consolidation range. Candles showing rejection at higher prices line up with the bearish bias across the daily and four-hour views. A definitive close below that range floor would solidify the downside move.
The levels matter more than the prediction. Size it accordingly.
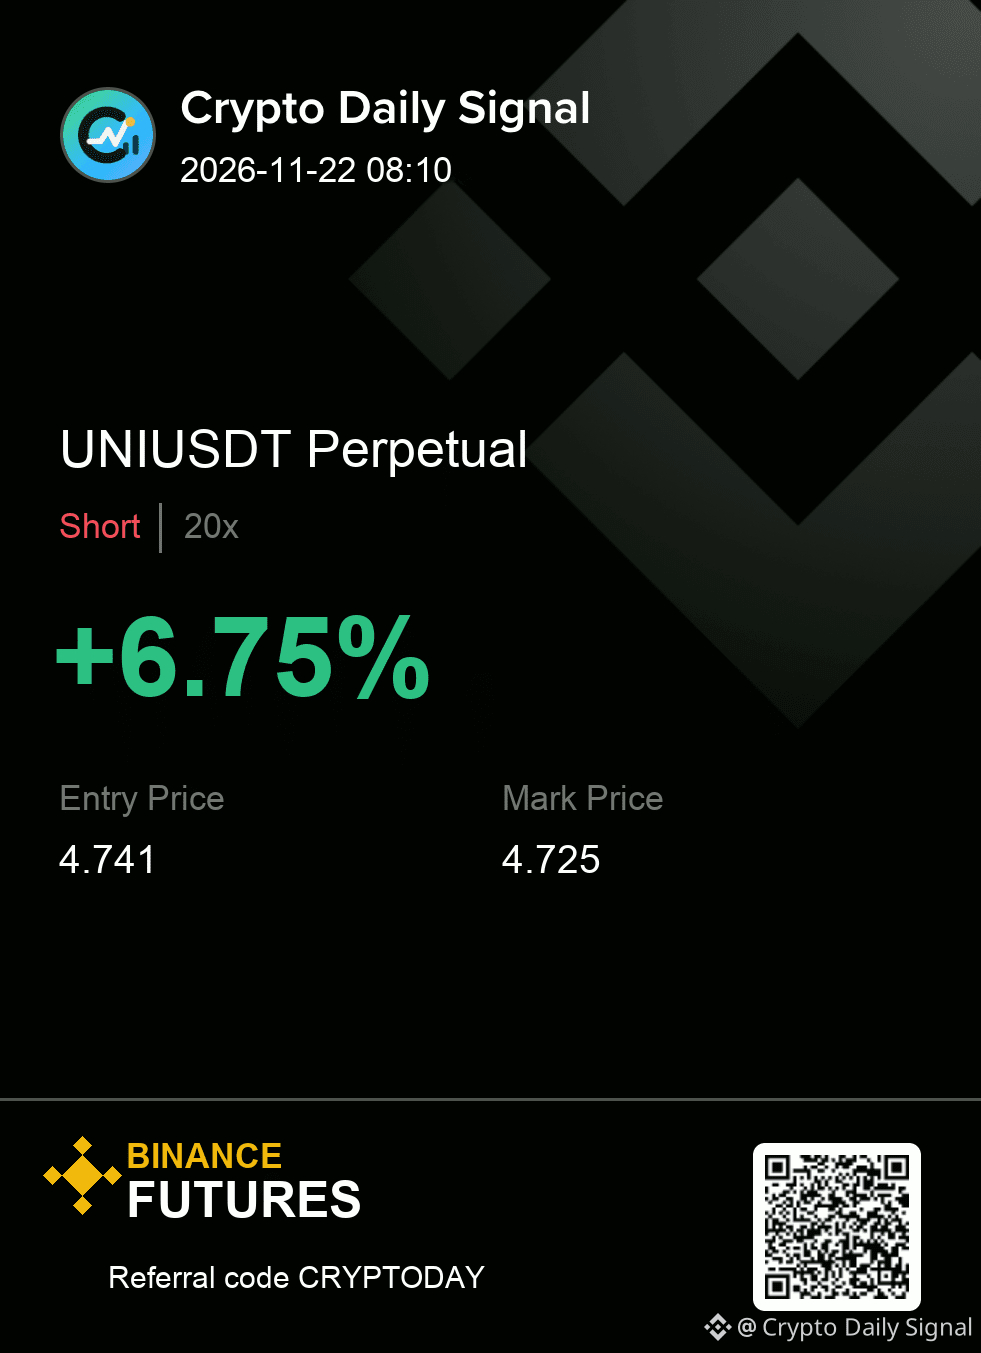
Execution plan (UNIUSDT — SHORT)
Entry: 4.731 - 4.751 | SL: 4.767
Take profit: 4.715 → 4.694 → 4.669
#TradingSignal
{future}(UNIUSDT)
$UNI still gives sellers the cleaner argument as it tests the upper boundary of its recent consolidation range. Candles showing rejection at higher prices line up with the bearish bias across the daily and four-hour views. A definitive close below that range floor would solidify the downside move.
The levels matter more than the prediction. Size it accordingly.
Execution plan (UNIUSDT — SHORT)
Entry: 4.731 - 4.751 | SL: 4.767
Take profit: 4.715 → 4.694 → 4.669
#TradingSignal
The levels matter more than the prediction. Size it accordingly.
Execution plan (UNIUSDT — SHORT)
Entry: 4.731 - 4.751 | SL: 4.767
Take profit: 4.715 → 4.694 → 4.669
#TradingSignal
4
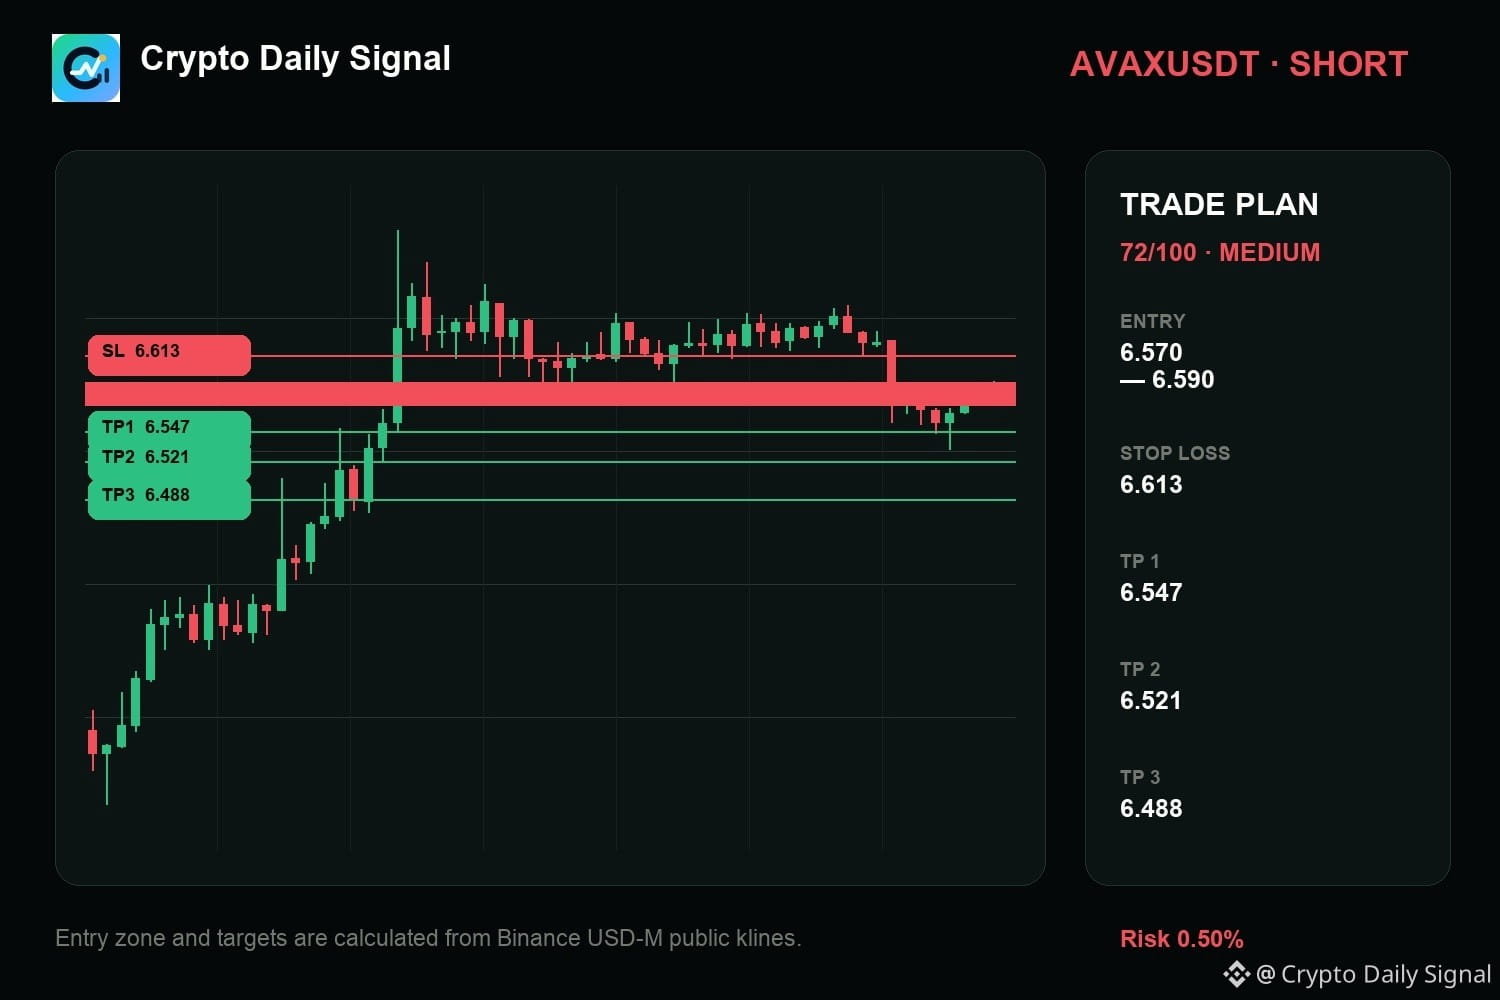
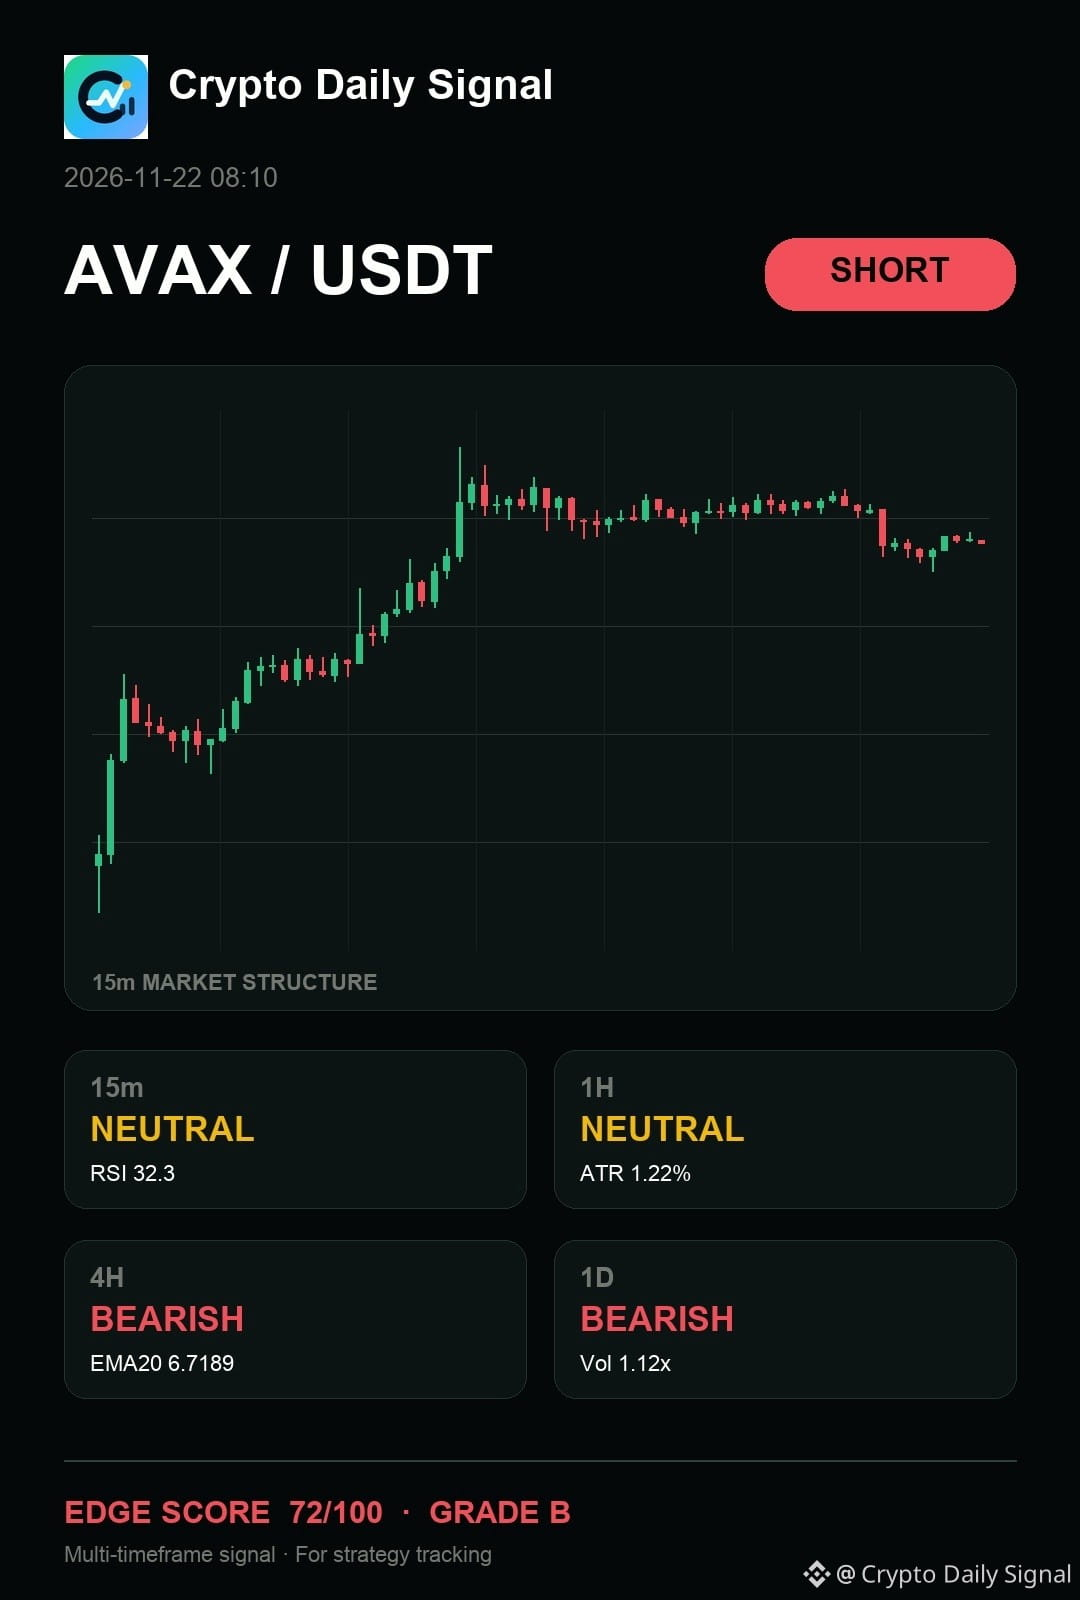
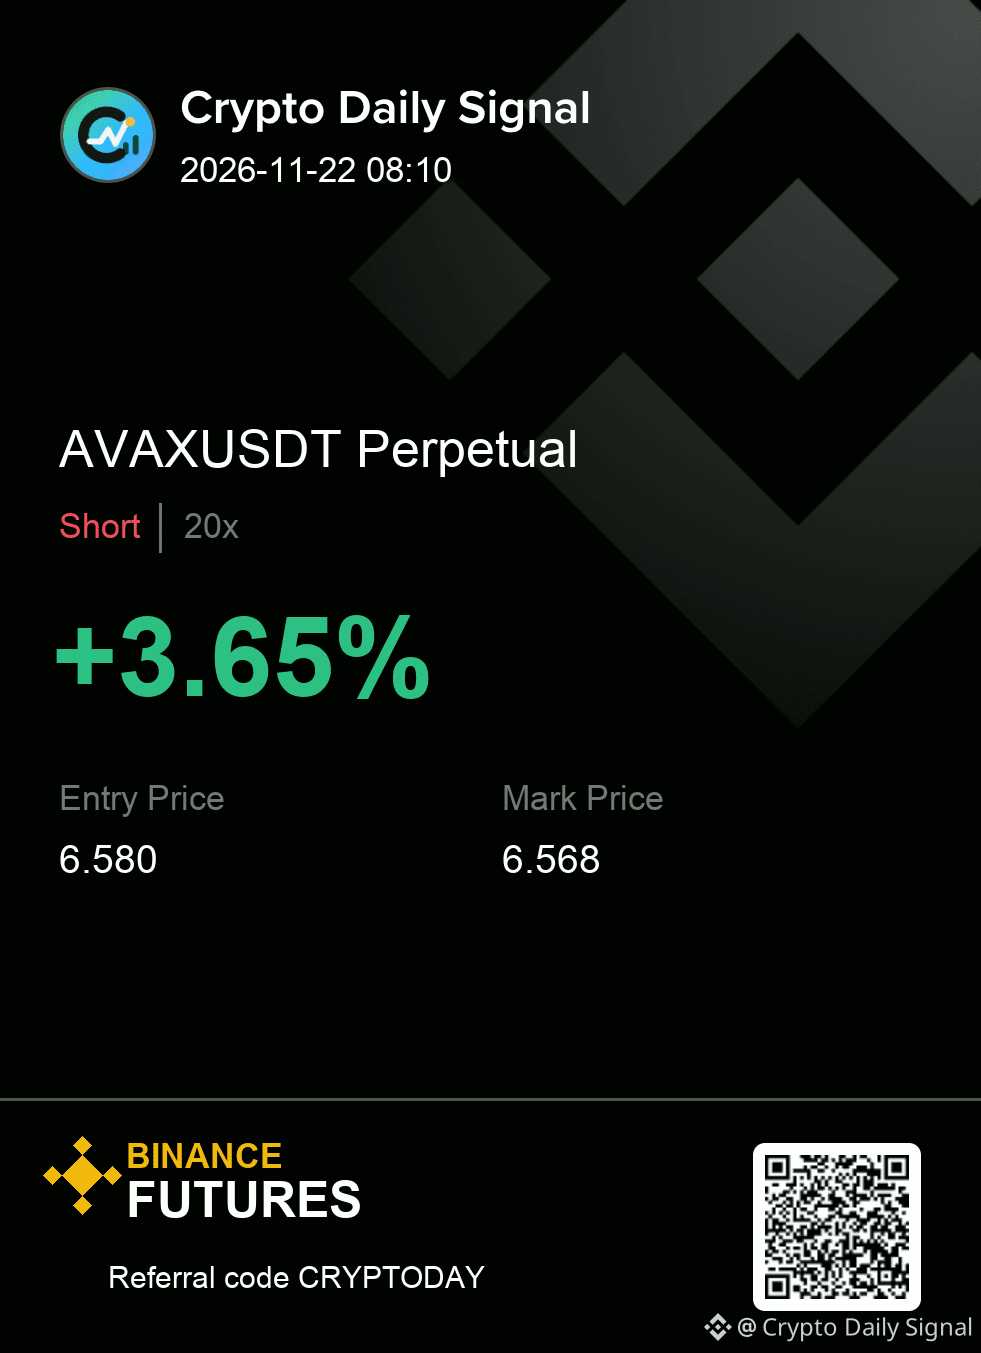
$AVAX is a patience trade on the short side. The current tight range shows lower highs setting up bearish conviction, even if the hourly action is flat. A decisive drop out of this range floor on strong selling action would give the short thesis immediate weight.
Levels — AVAXUSDT
Zone: 6.570 - 6.590
Cut: 6.613
Scale: 6.547 | 6.521 | 6.488
No chase outside the zone; the stop defines the whole idea.
#TradingSignal
{future}(AVAXUSDT)
$AVAX is a patience trade on the short side. The current tight range shows lower highs setting up bearish conviction, even if the hourly action is flat. A decisive drop out of this range floor on strong selling action would give the short thesis immediate weight.
Levels — AVAXUSDT
Zone: 6.570 - 6.590
Cut: 6.613
Scale: 6.547 | 6.521 | 6.488
No chase outside the zone; the stop defines the whole idea.
#TradingSignal
Levels — AVAXUSDT
Zone: 6.570 - 6.590
Cut: 6.613
Scale: 6.547 | 6.521 | 6.488
No chase outside the zone; the stop defines the whole idea.
#TradingSignal
8
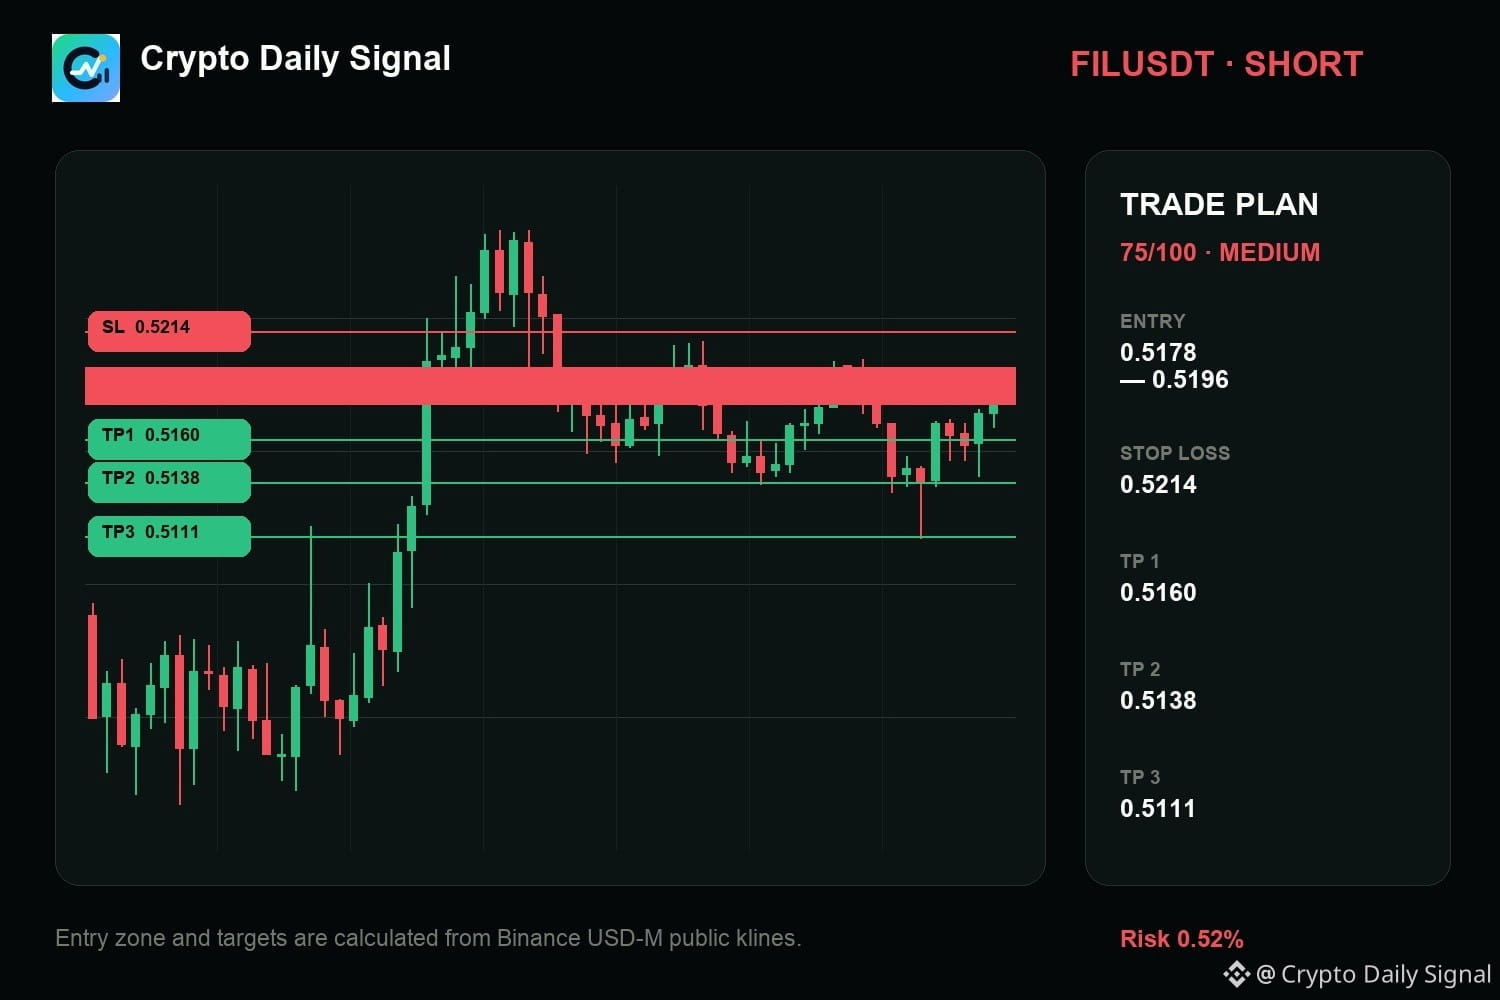
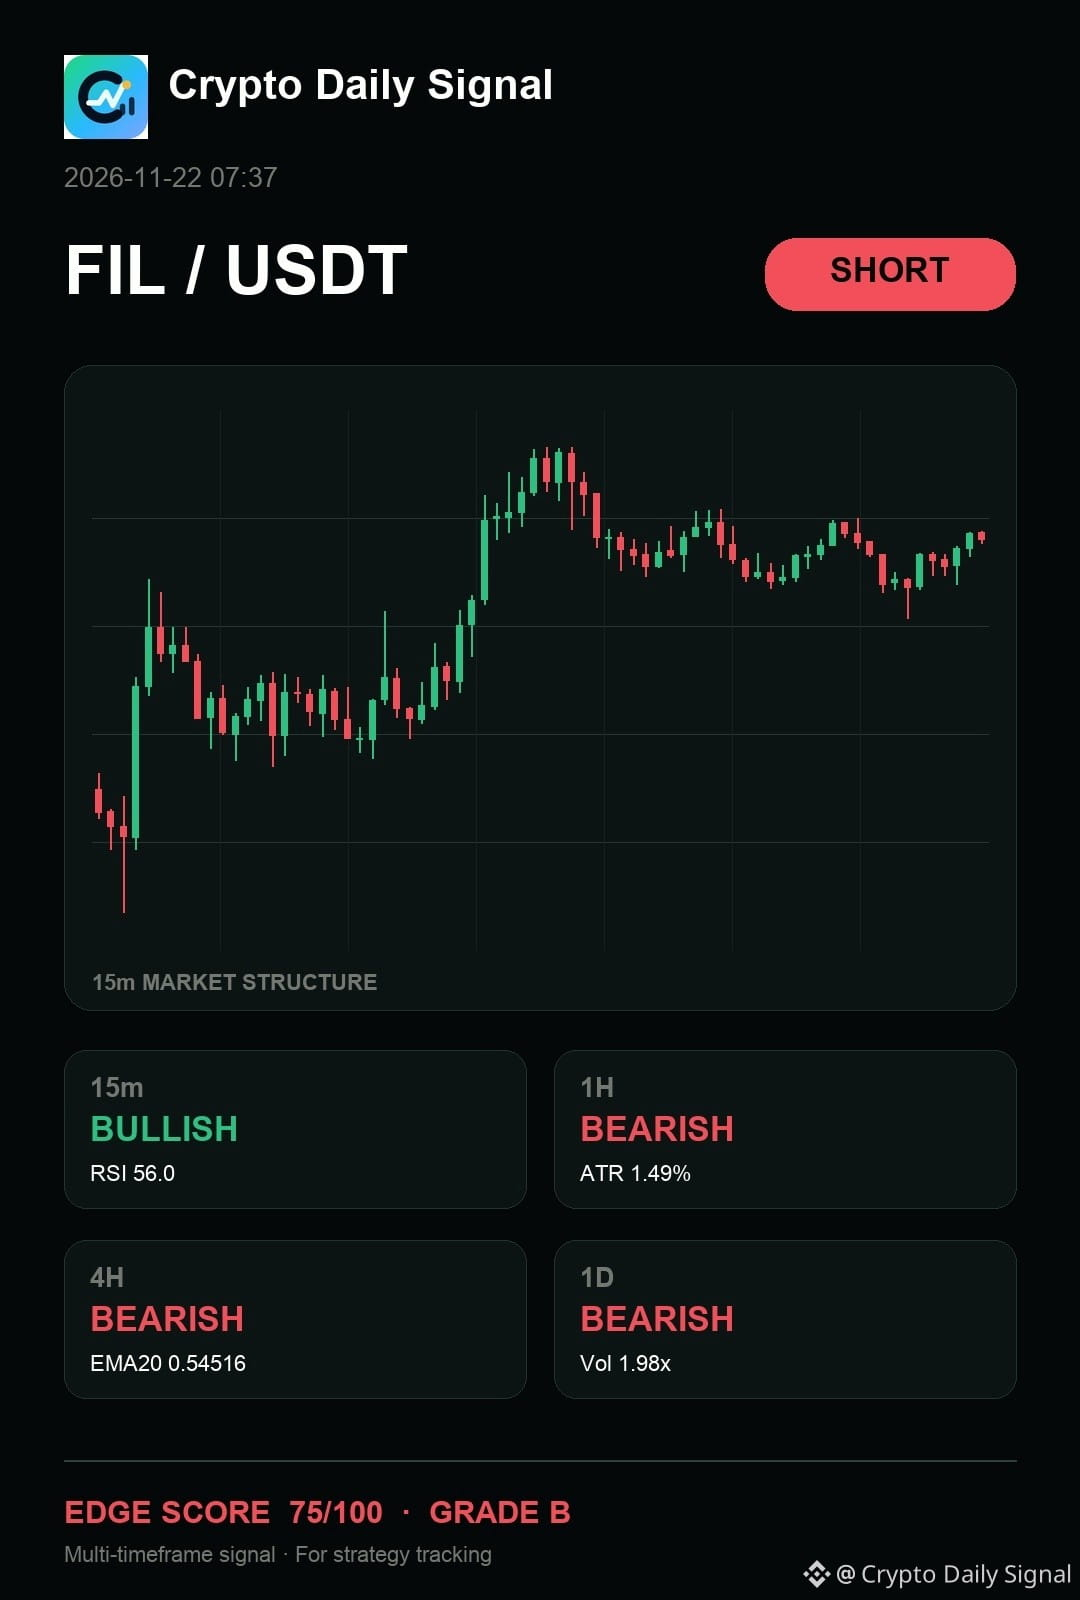
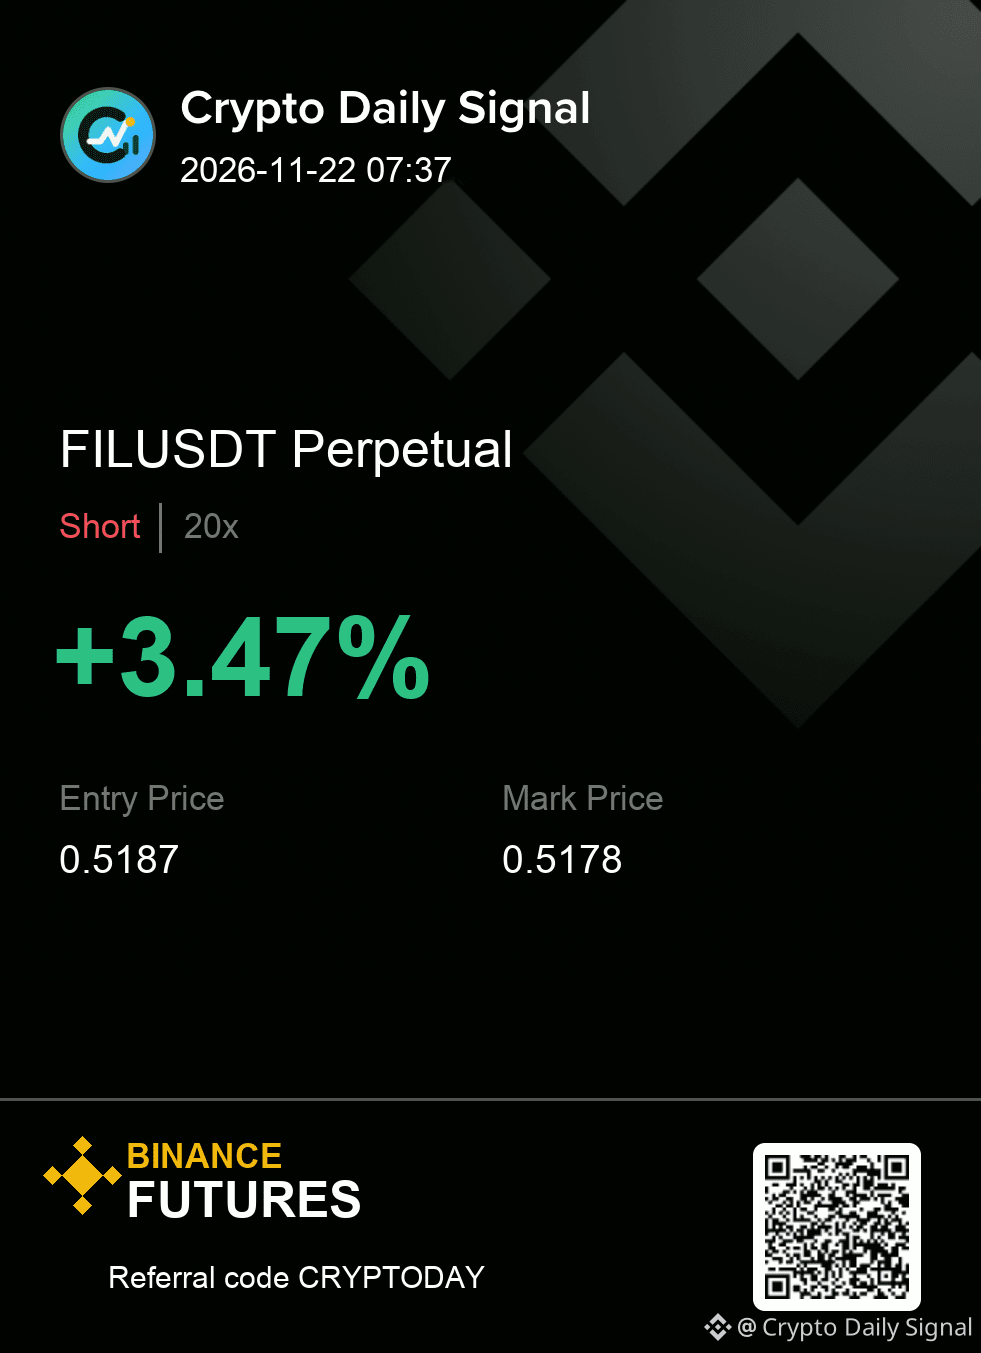
$FIL — my two cents, I am reading it like it remains a short watch for me as the price keeps fitting into a descending channel. The lower momentum on the smaller timeframes doesn't overcome the bearish signal across the hourly and four-hour views. If it manages a break below the immediate support, the bearish argument gets stronger.
FILUSDT | SHORT
Entry 0.5178 - 0.5196
Invalidation 0.5214
Targets 0.5160 / 0.5138 / 0.5111
Execution is simple here: respect the zone and respect the cut.
#TradingSignal
{future}(FILUSDT)
$FIL — my two cents, I am reading it like it remains a short watch for me as the price keeps fitting into a descending channel. The lower momentum on the smaller timeframes doesn't overcome the bearish signal across the hourly and four-hour views. If it manages a break below the immediate support, the bearish argument gets stronger.
FILUSDT | SHORT
Entry 0.5178 - 0.5196
Invalidation 0.5214
Targets 0.5160 / 0.5138 / 0.5111
Execution is simple here: respect the zone and respect the cut.
#TradingSignal
FILUSDT | SHORT
Entry 0.5178 - 0.5196
Invalidation 0.5214
Targets 0.5160 / 0.5138 / 0.5111
Execution is simple here: respect the zone and respect the cut.
#TradingSignal
18
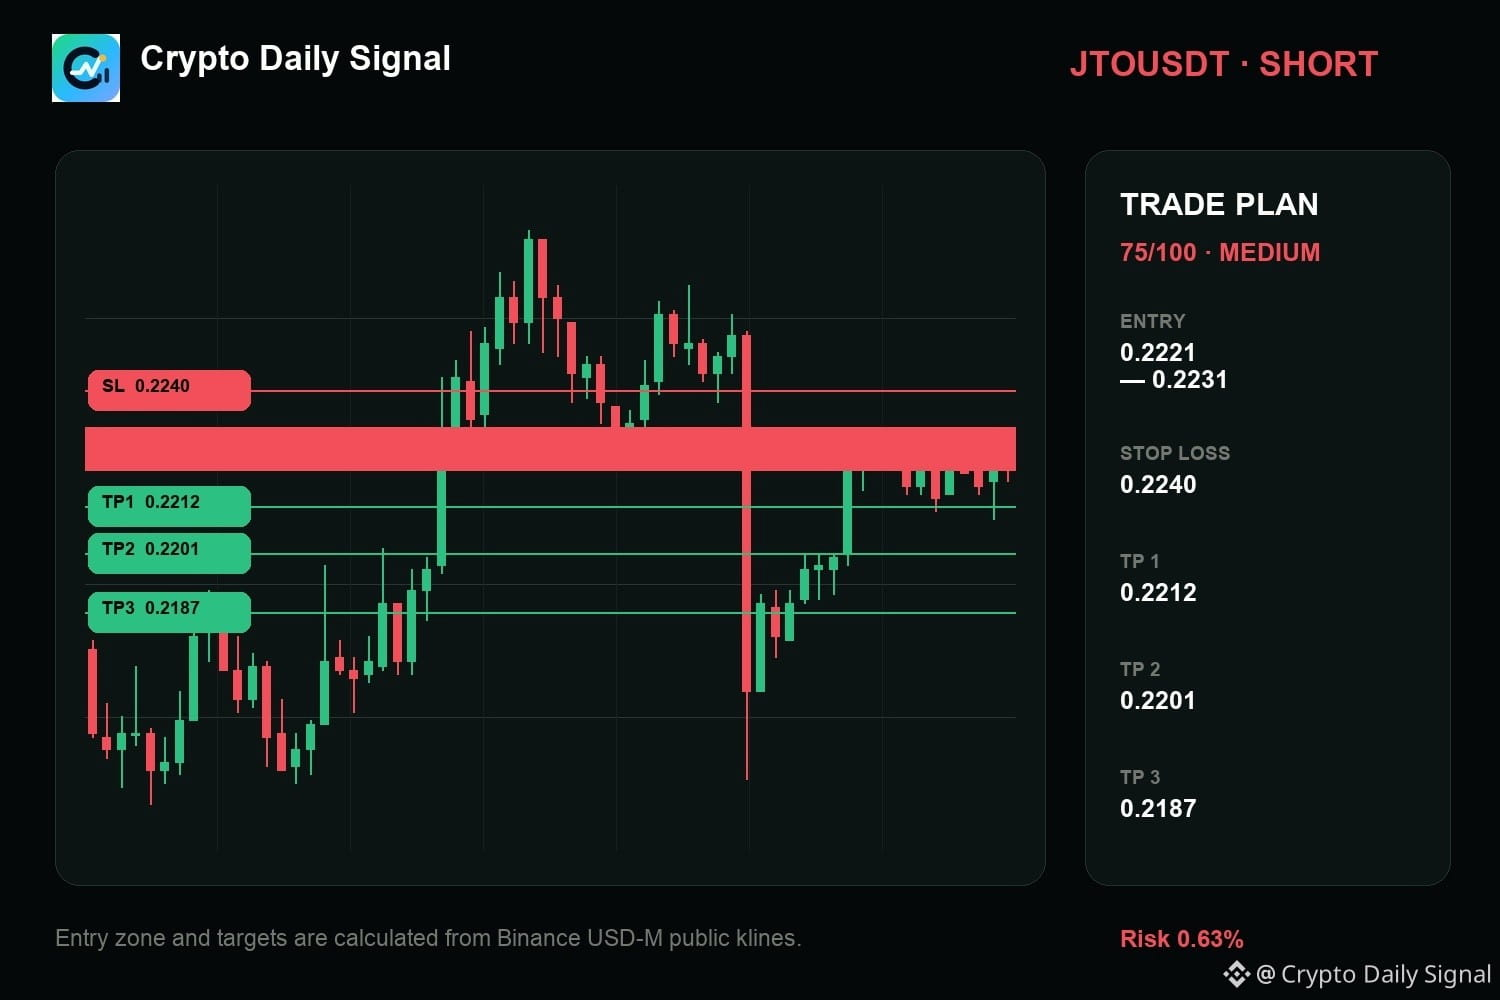
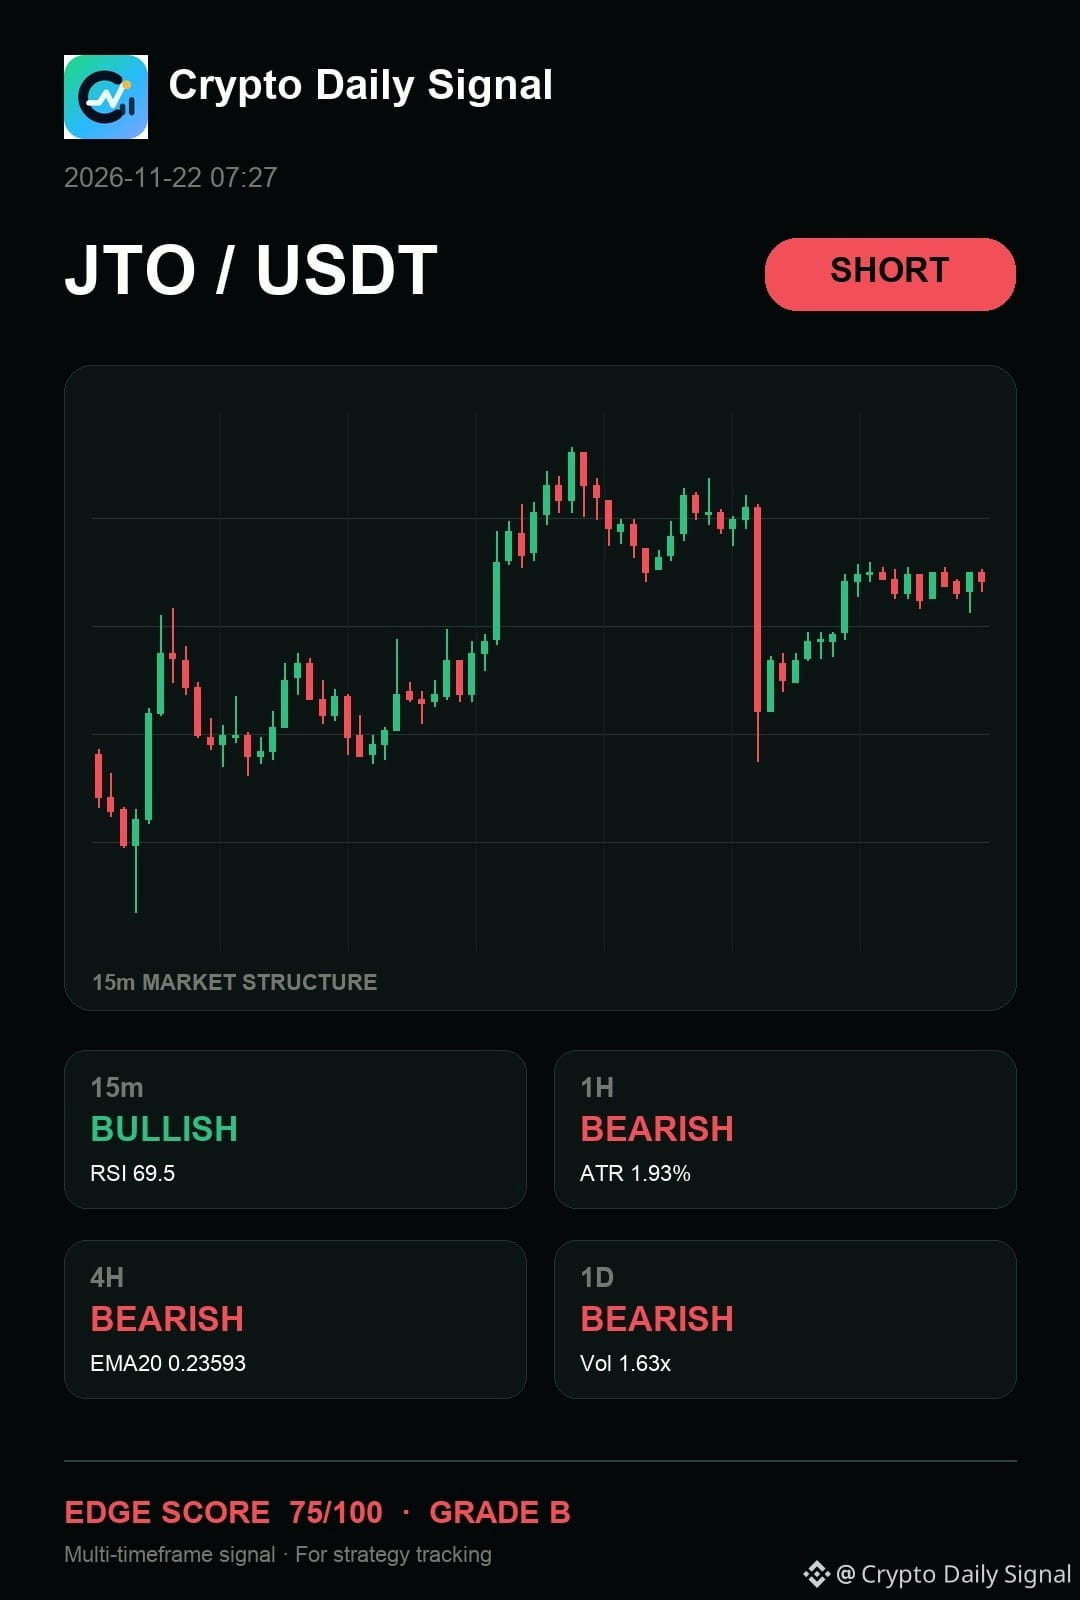
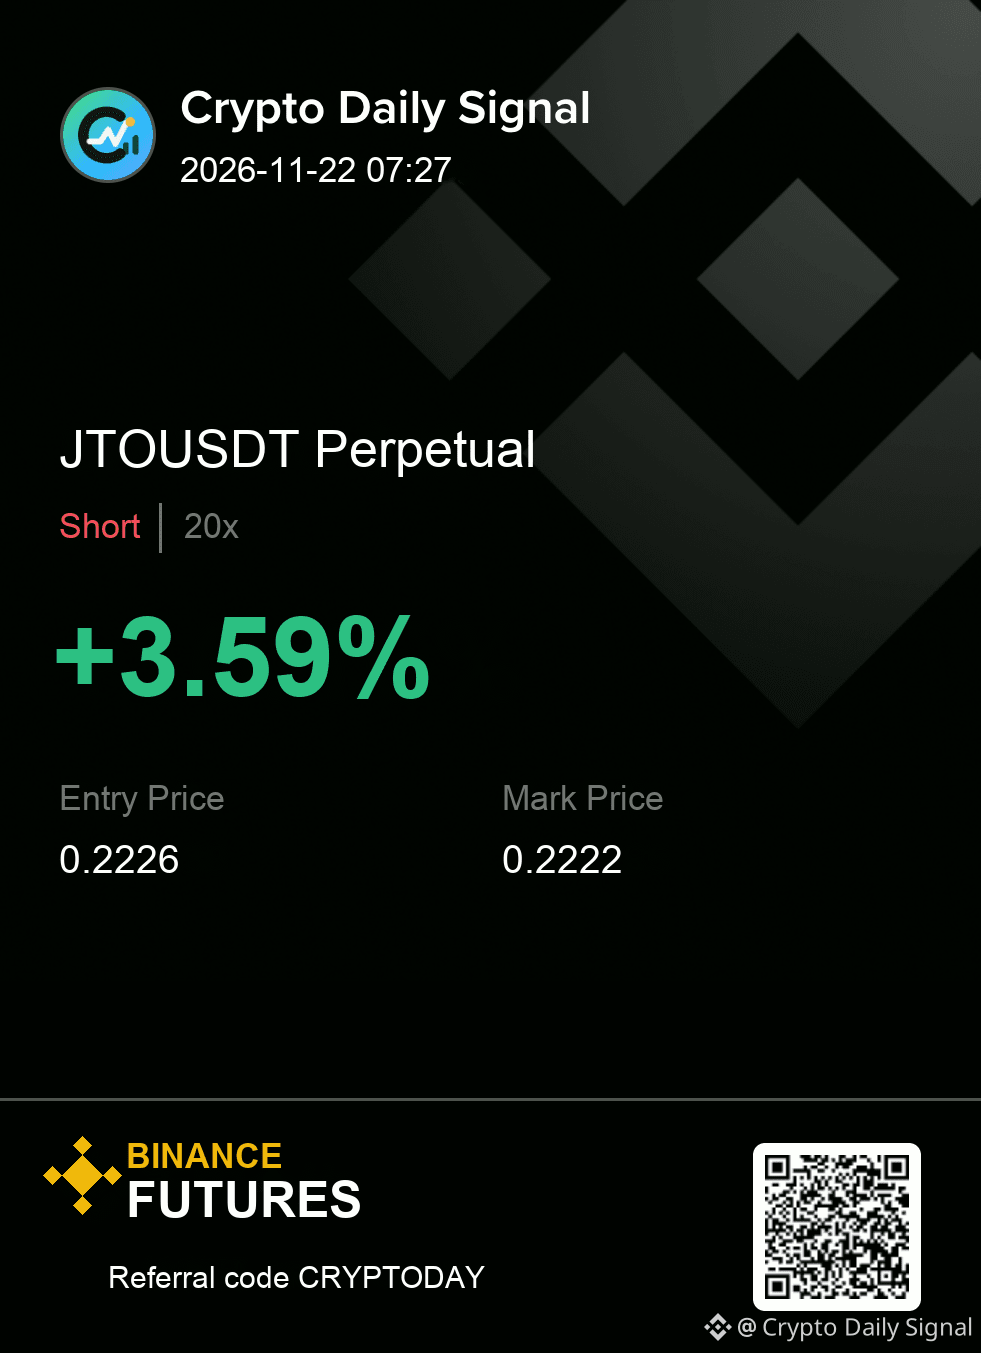
$JTO — look, my read is simple: it keeps me focused on the downside response as the wider market picture remains bearish across the daily and four-hour views. Although the recent moves are trapped in a tighter band, the hourly action reflects that bearish tone, which is more important than the brief uptick seen on the fifteen-minute scale. The setup gets stronger if the price breaches that immediate short-term support zone to the downside.
Execution is simple here: respect the zone and respect the cut.
SHORT plan for JTOUSDT
0.2221 - 0.2231 entry | 0.2240 stop
0.2212 → 0.2201 → 0.2187
#TradingSignal
{future}(JTOUSDT)
$JTO — look, my read is simple: it keeps me focused on the downside response as the wider market picture remains bearish across the daily and four-hour views. Although the recent moves are trapped in a tighter band, the hourly action reflects that bearish tone, which is more important than the brief uptick seen on the fifteen-minute scale. The setup gets stronger if the price breaches that immediate short-term support zone to the downside.
Execution is simple here: respect the zone and respect the cut.
SHORT plan for JTOUSDT
0.2221 - 0.2231 entry | 0.2240 stop
0.2212 → 0.2201 → 0.2187
#TradingSignal
Execution is simple here: respect the zone and respect the cut.
SHORT plan for JTOUSDT
0.2221 - 0.2231 entry | 0.2240 stop
0.2212 → 0.2201 → 0.2187
#TradingSignal
10
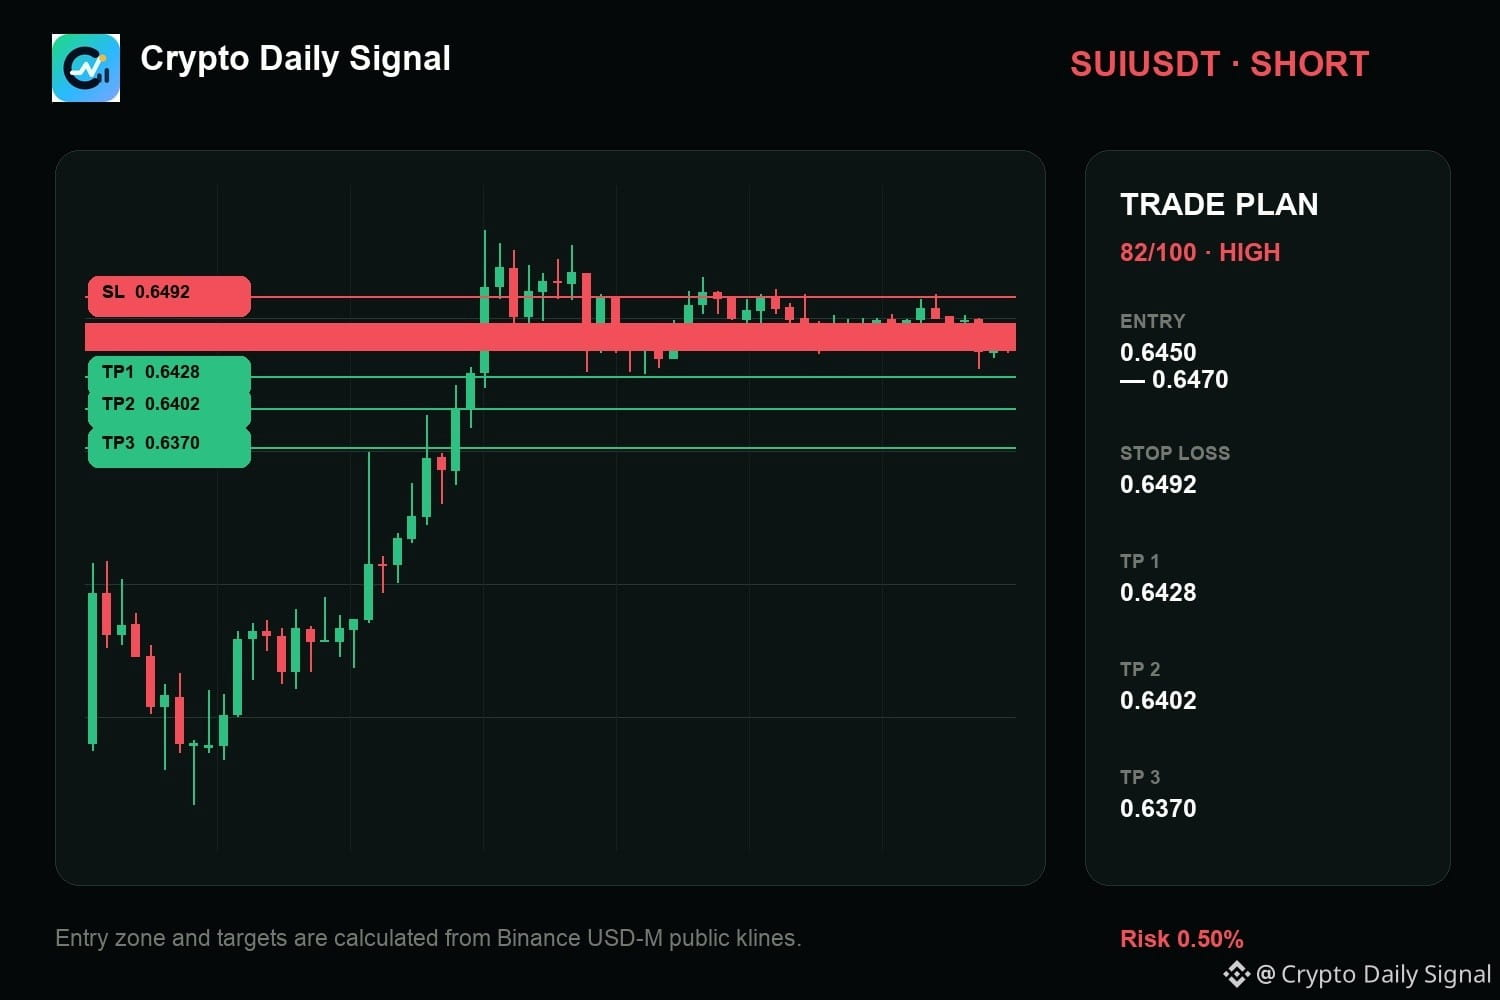
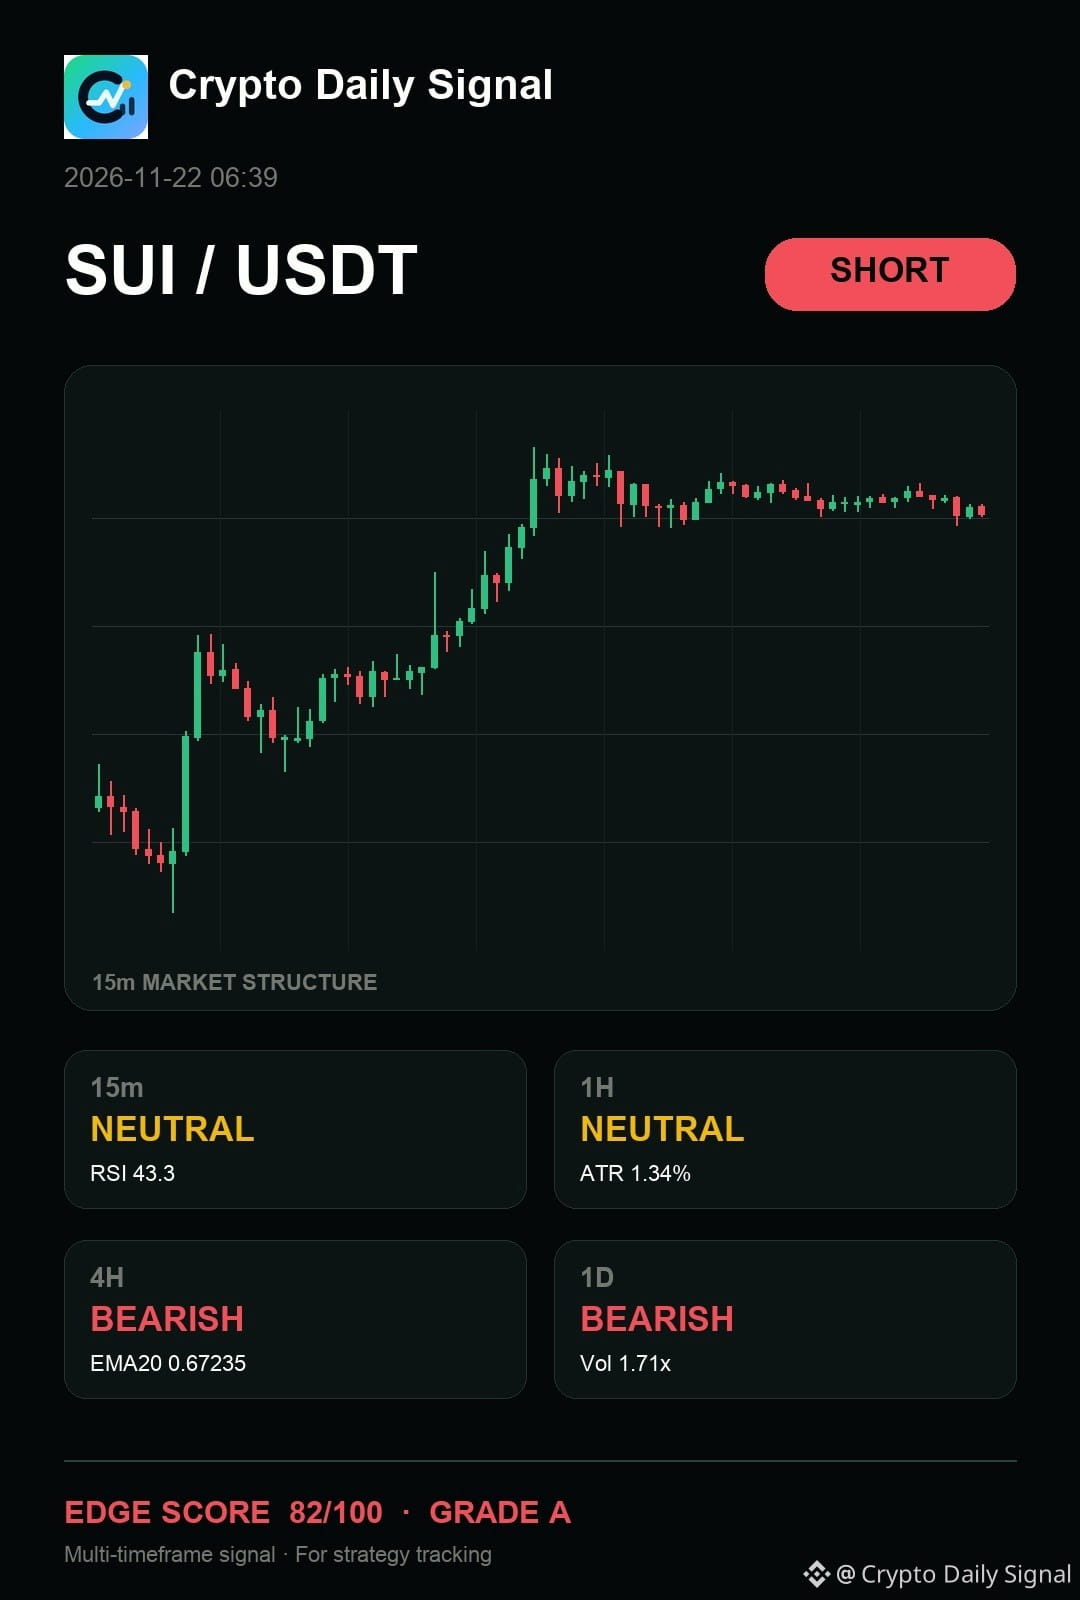
$SUI still offers the cleaner bearish argument as the price rejects the upper boundary on the most recent candle. The downward bias holds on both the daily and four-hour charts, making a break above the prior high the key invalidation.
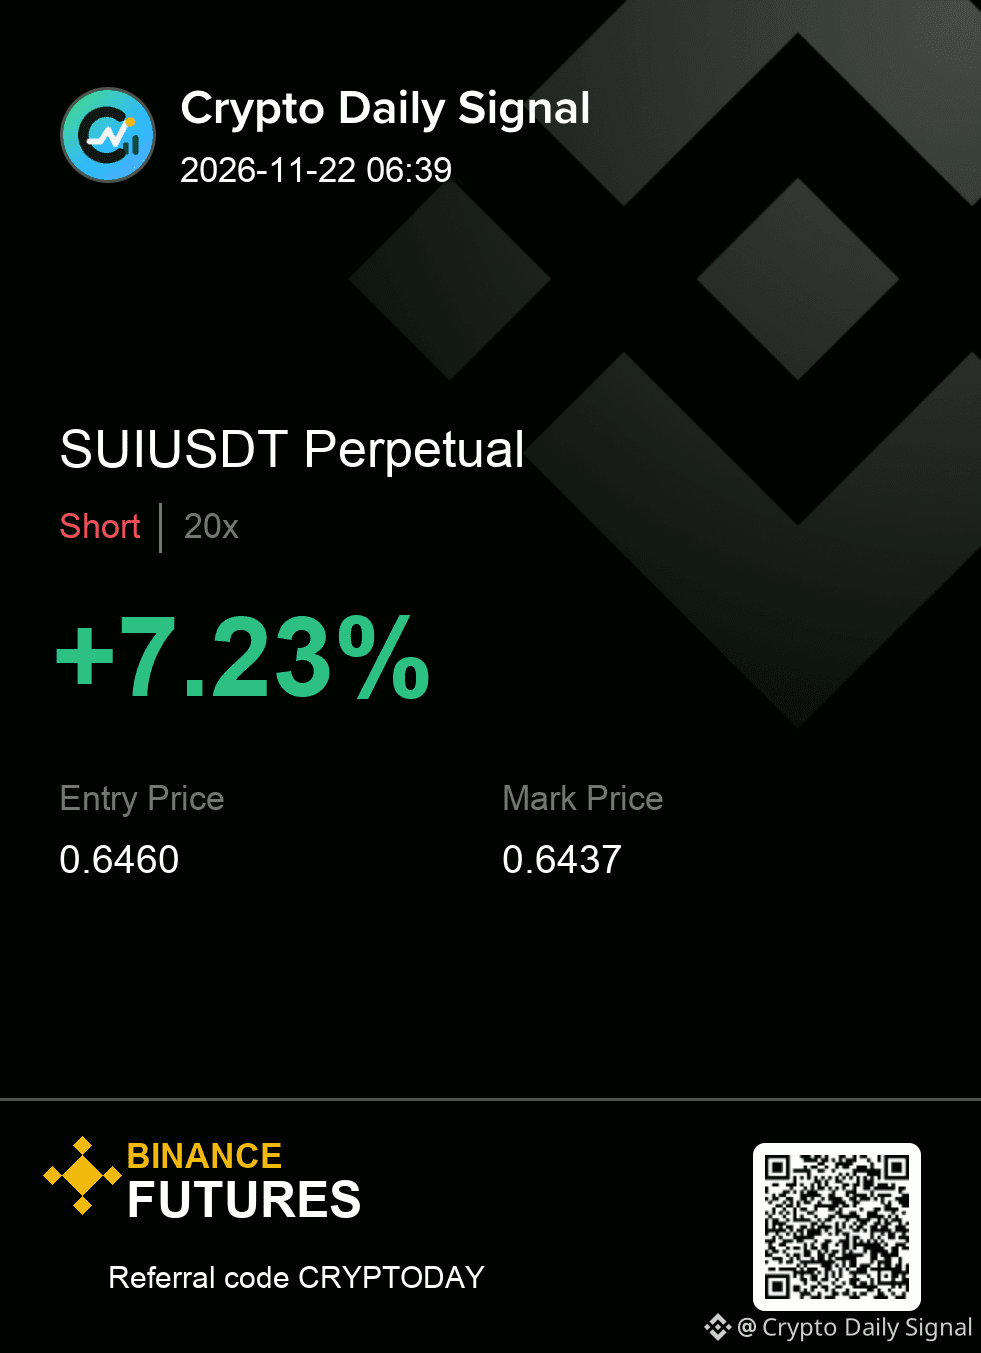
Execution plan (SUIUSDT — SHORT)
Entry: 0.6450 - 0.6470 | SL: 0.6492
Take profit: 0.6428 → 0.6402 → 0.6370
#TradingSignal
{future}(SUIUSDT)
$SUI still offers the cleaner bearish argument as the price rejects the upper boundary on the most recent candle. The downward bias holds on both the daily and four-hour charts, making a break above the prior high the key invalidation.
Execution plan (SUIUSDT — SHORT)
Entry: 0.6450 - 0.6470 | SL: 0.6492
Take profit: 0.6428 → 0.6402 → 0.6370
#TradingSignal
Execution plan (SUIUSDT — SHORT)
Entry: 0.6450 - 0.6470 | SL: 0.6492
Take profit: 0.6428 → 0.6402 → 0.6370
#TradingSignal
5

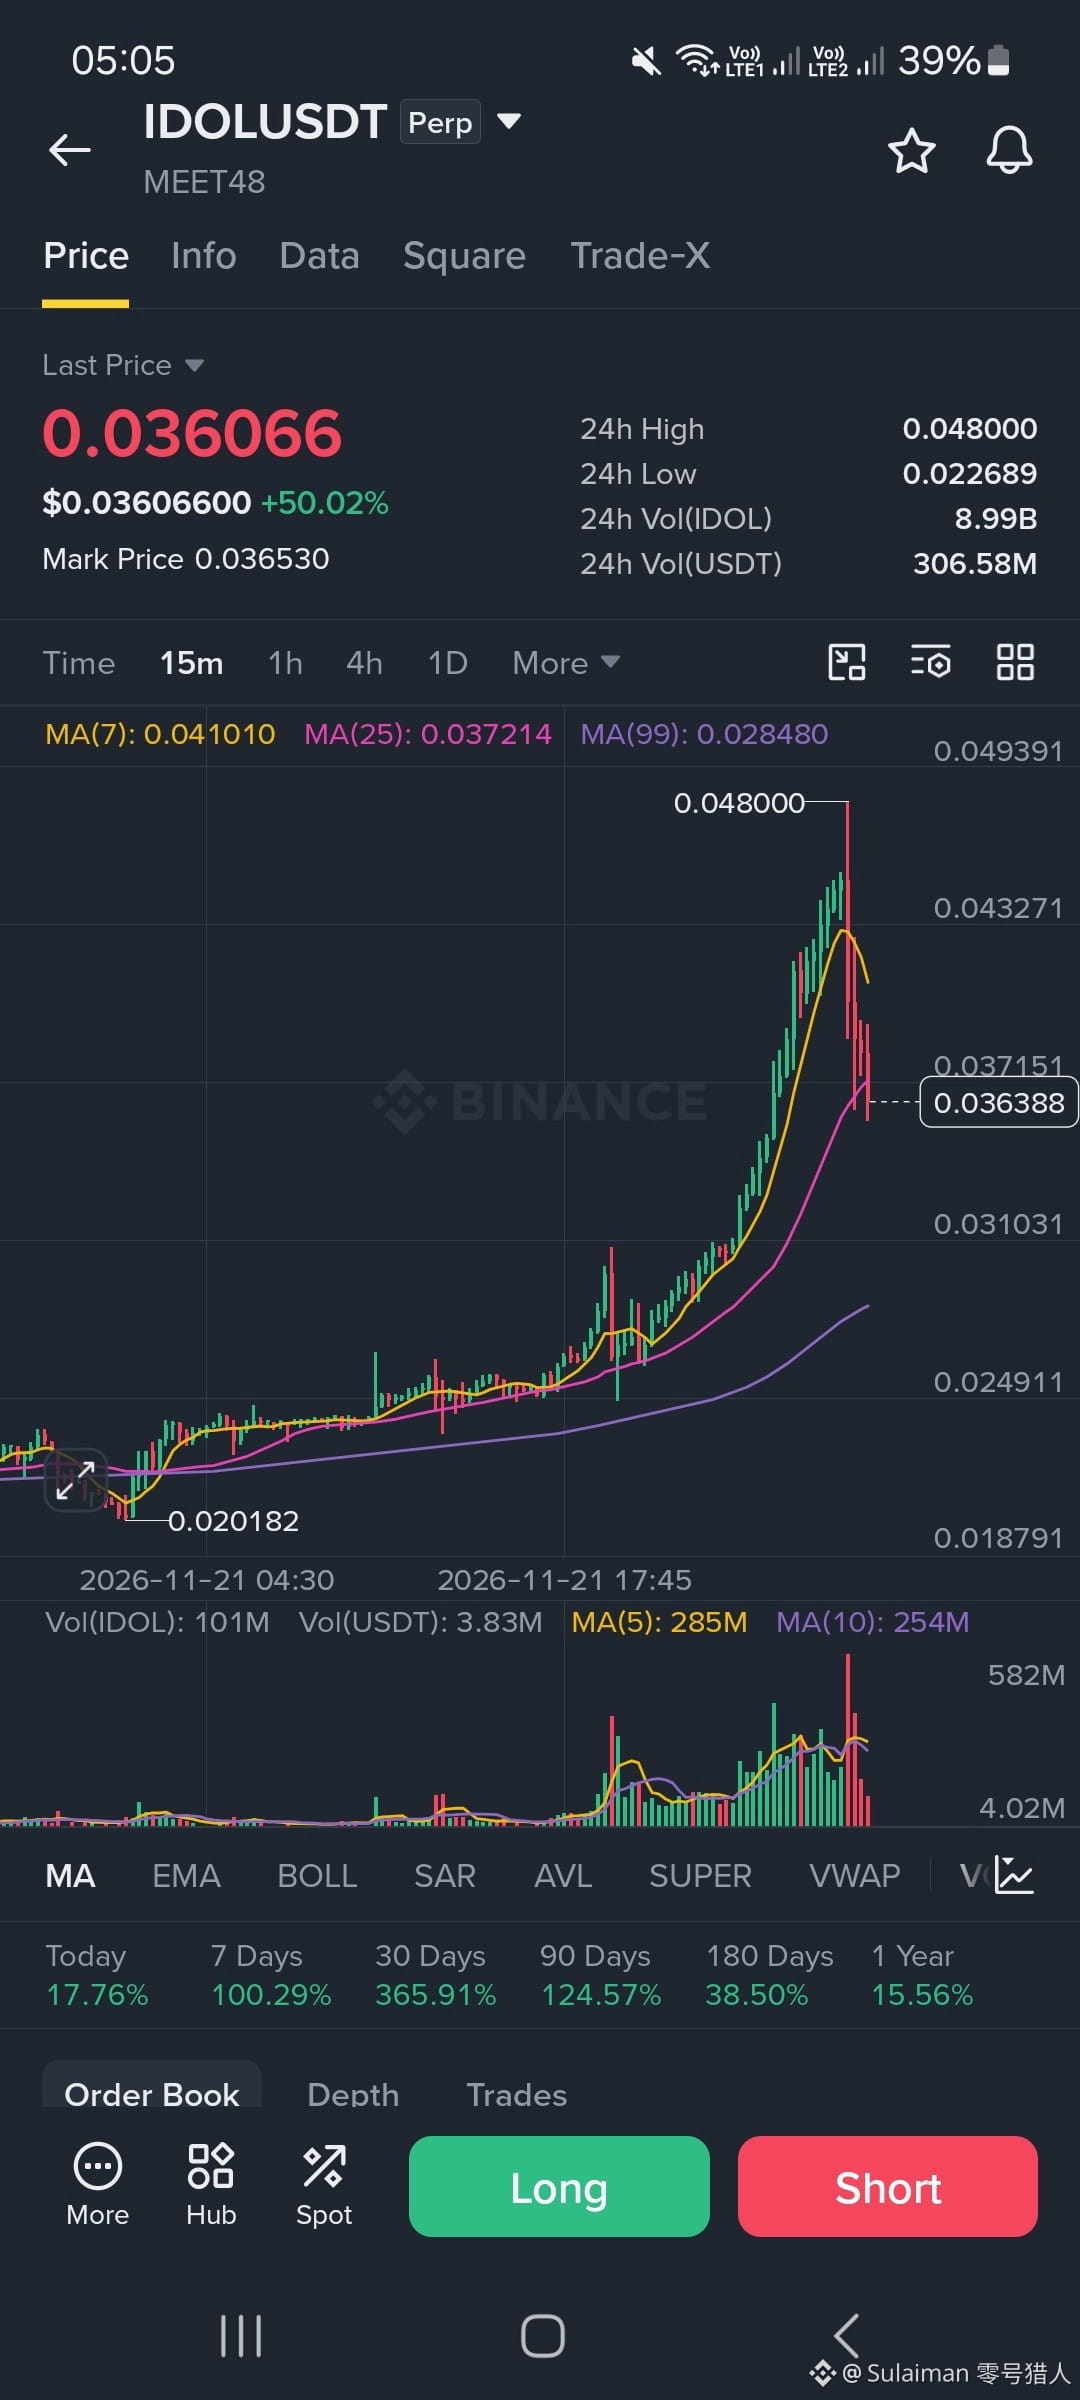
🚨 $IDOL
{future}(IDOLUSDT)
🚨 IDOLUSDT — SHORT SIGNAL
🔴 Bias: SHORT
📊 Timeframe: 15M
💰 Current Price: $0.03606
Entry Zone: $0.0365 – $0.0372
🎯 Take Profit
- TP1: $0.0340
- TP2: $0.0310
- TP3: $0.0285
🛑 Stop Loss: $0.0415
Why SHORT?
- Strong rejection from $0.0480.
- Price below MA(7) & MA(25).
- Heavy selling volume after the rally.
- Short-term momentum turning bearish.
⚠️ Wait for confirmation before entry. Use controlled leverage and strict risk management.
#IDOL #BinanceFutures #TradingSignal #ShortSqueeze
🚨 $IDOL
🚨 IDOLUSDT — SHORT SIGNAL
🔴 Bias: SHORT
📊 Timeframe: 15M
💰 Current Price: $0.03606
Entry Zone: $0.0365 – $0.0372
🎯 Take Profit
- TP1: $0.0340
- TP2: $0.0310
- TP3: $0.0285
🛑 Stop Loss: $0.0415
Why SHORT?
- Strong rejection from $0.0480.
- Price below MA(7) & MA(25).
- Heavy selling volume after the rally.
- Short-term momentum turning bearish.
⚠️ Wait for confirmation before entry. Use controlled leverage and strict risk management.
#IDOL #BinanceFutures #TradingSignal #ShortSqueeze
🚨 IDOLUSDT — SHORT SIGNAL
🔴 Bias: SHORT
📊 Timeframe: 15M
💰 Current Price: $0.03606
Entry Zone: $0.0365 – $0.0372
🎯 Take Profit
- TP1: $0.0340
- TP2: $0.0310
- TP3: $0.0285
🛑 Stop Loss: $0.0415
Why SHORT?
- Strong rejection from $0.0480.
- Price below MA(7) & MA(25).
- Heavy selling volume after the rally.
- Short-term momentum turning bearish.
⚠️ Wait for confirmation before entry. Use controlled leverage and strict risk management.
#IDOL #BinanceFutures #TradingSignal #ShortSqueeze
1
1
884
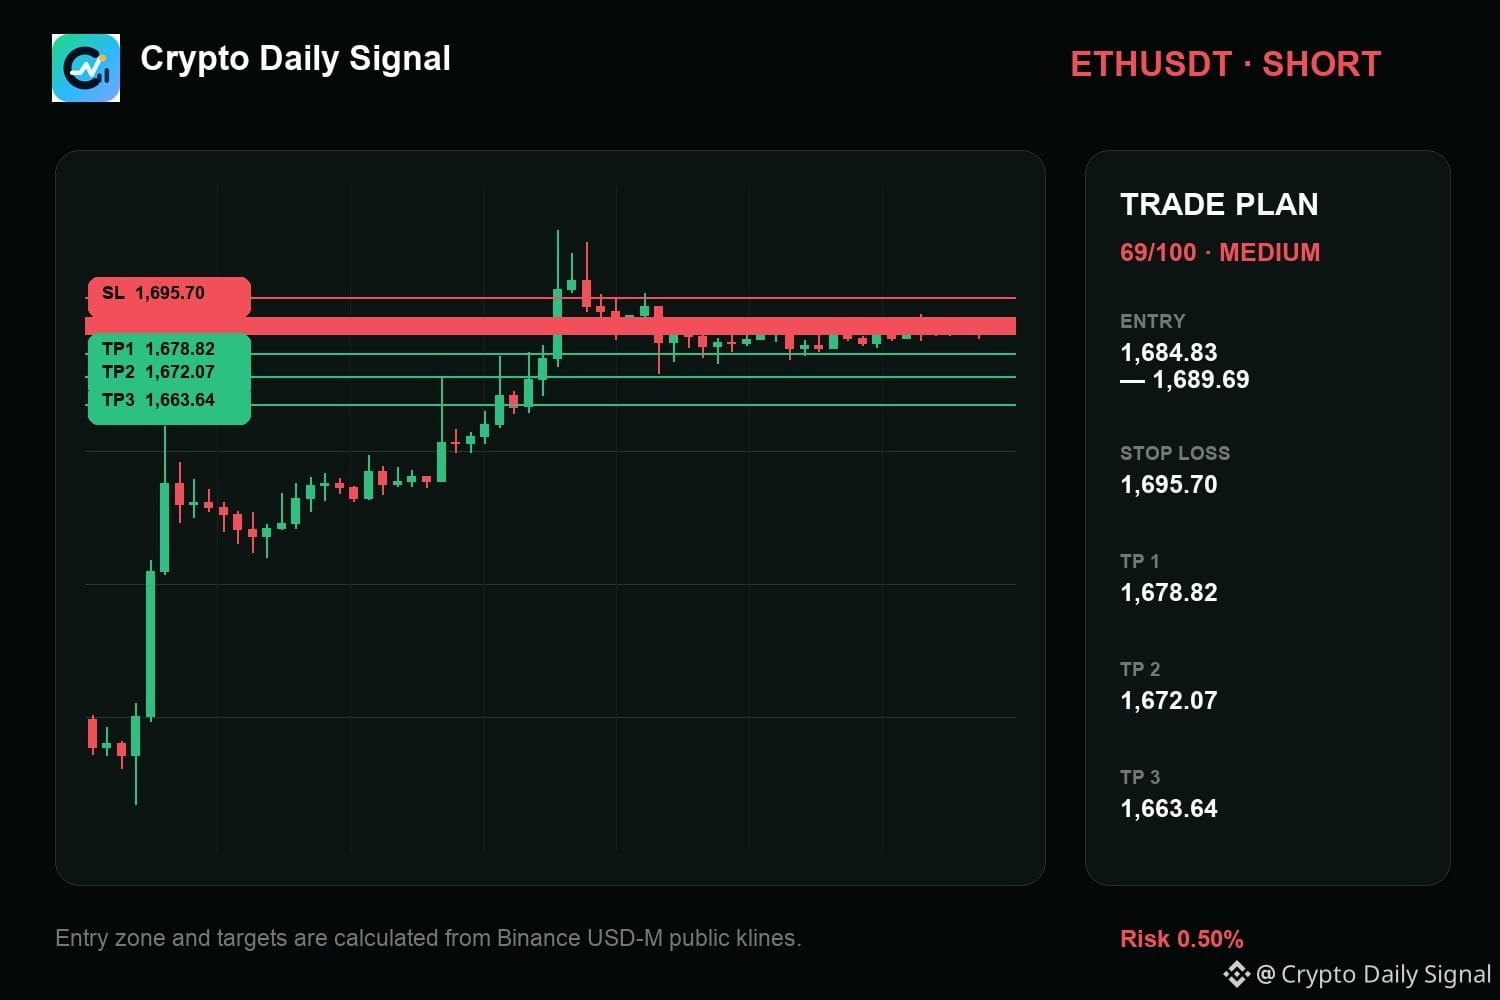
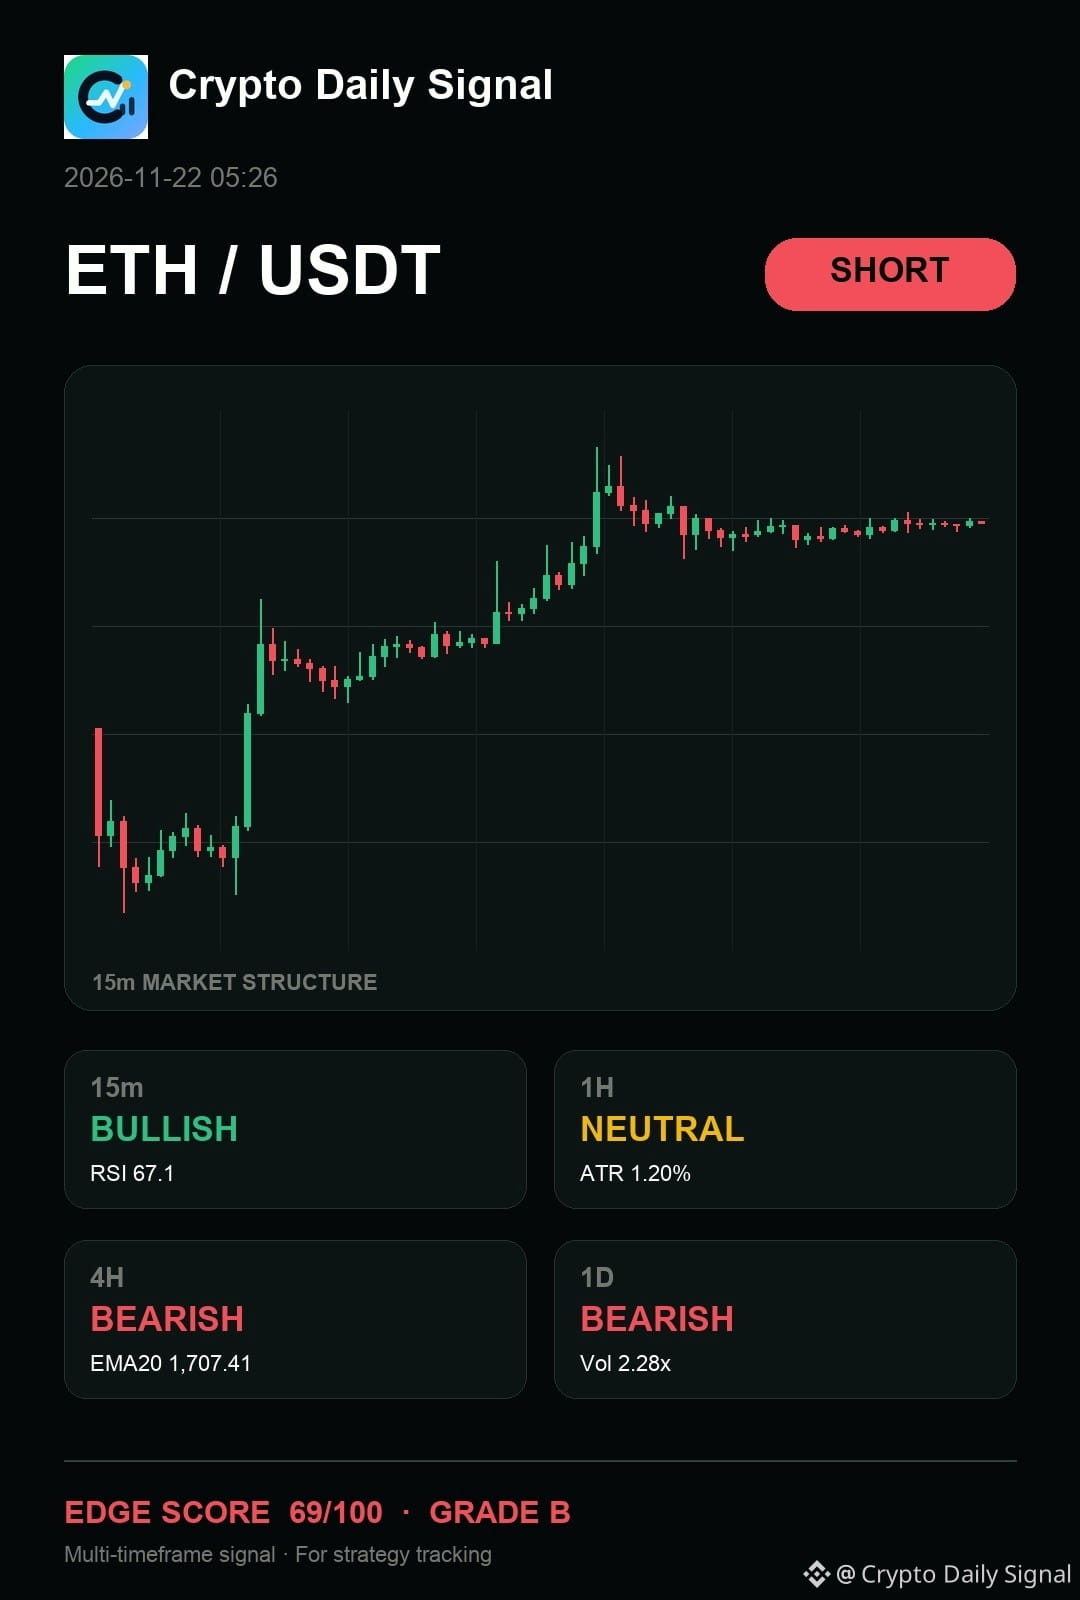
$ETH still has a valid bearish path because the four-hour bias is clearly down, even though the short-term action is locked in a tight trading range. The recent candle formations show clear supply stepping in at higher levels, suggesting immediate selling pressure remains dominant. A break above the upper boundary would challenge this view, but holding below that area supports the down side.
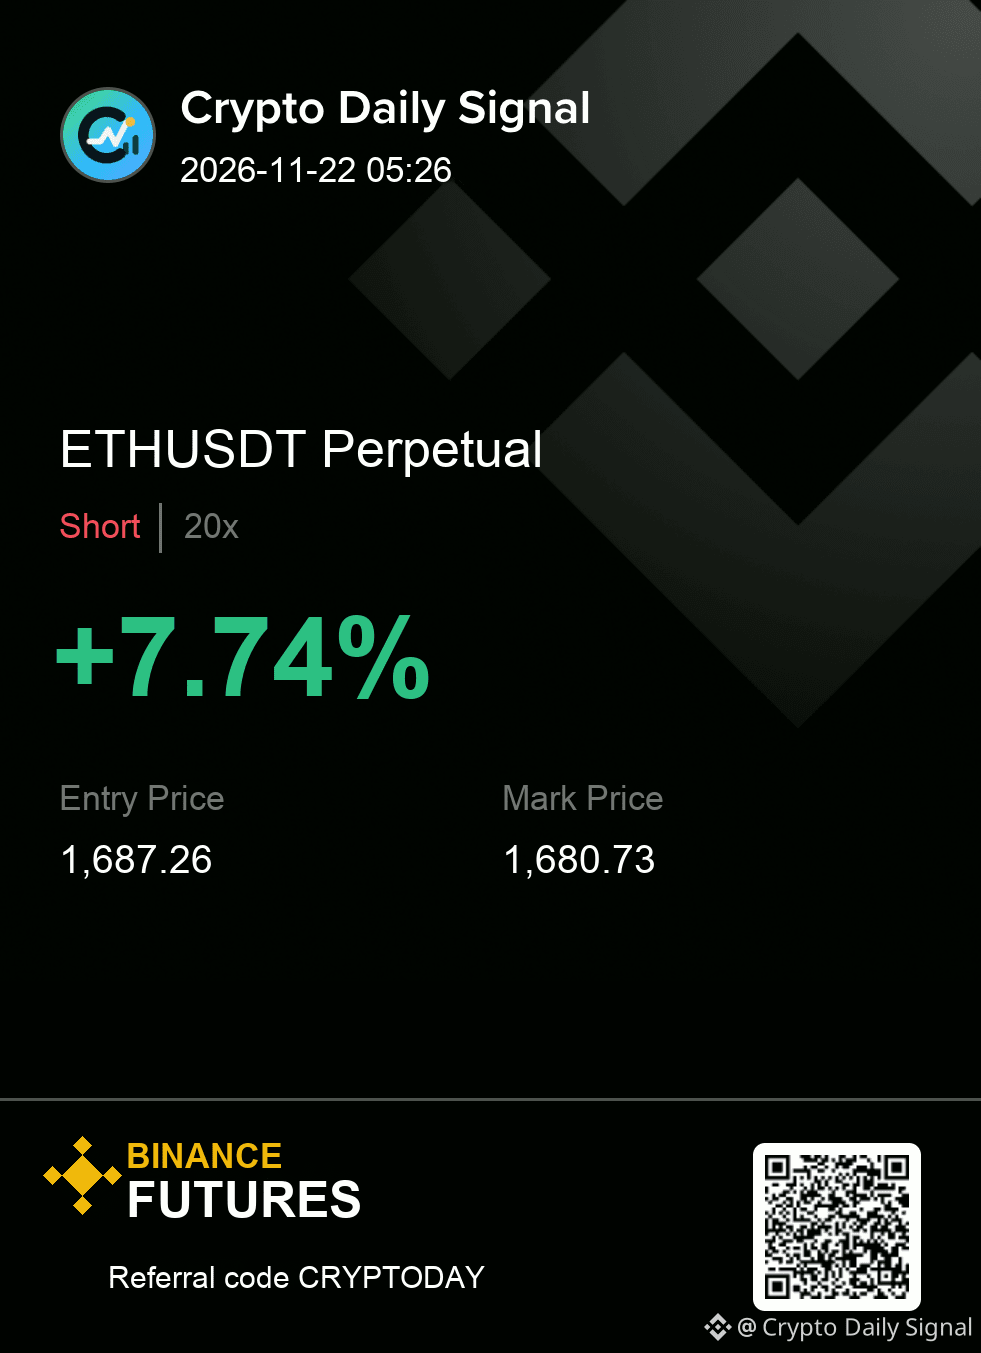
Execution plan (ETHUSDT — SHORT)
Entry: 1,684.83 - 1,689.69 | SL: 1,695.70
Take profit: 1,678.82 → 1,672.07 → 1,663.64
No chase outside the zone; the stop defines the whole idea.
#TradingSignal
{future}(ETHUSDT)
$ETH still has a valid bearish path because the four-hour bias is clearly down, even though the short-term action is locked in a tight trading range. The recent candle formations show clear supply stepping in at higher levels, suggesting immediate selling pressure remains dominant. A break above the upper boundary would challenge this view, but holding below that area supports the down side.
Execution plan (ETHUSDT — SHORT)
Entry: 1,684.83 - 1,689.69 | SL: 1,695.70
Take profit: 1,678.82 → 1,672.07 → 1,663.64
No chase outside the zone; the stop defines the whole idea.
#TradingSignal
Execution plan (ETHUSDT — SHORT)
Entry: 1,684.83 - 1,689.69 | SL: 1,695.70
Take profit: 1,678.82 → 1,672.07 → 1,663.64
No chase outside the zone; the stop defines the whole idea.
#TradingSignal
6
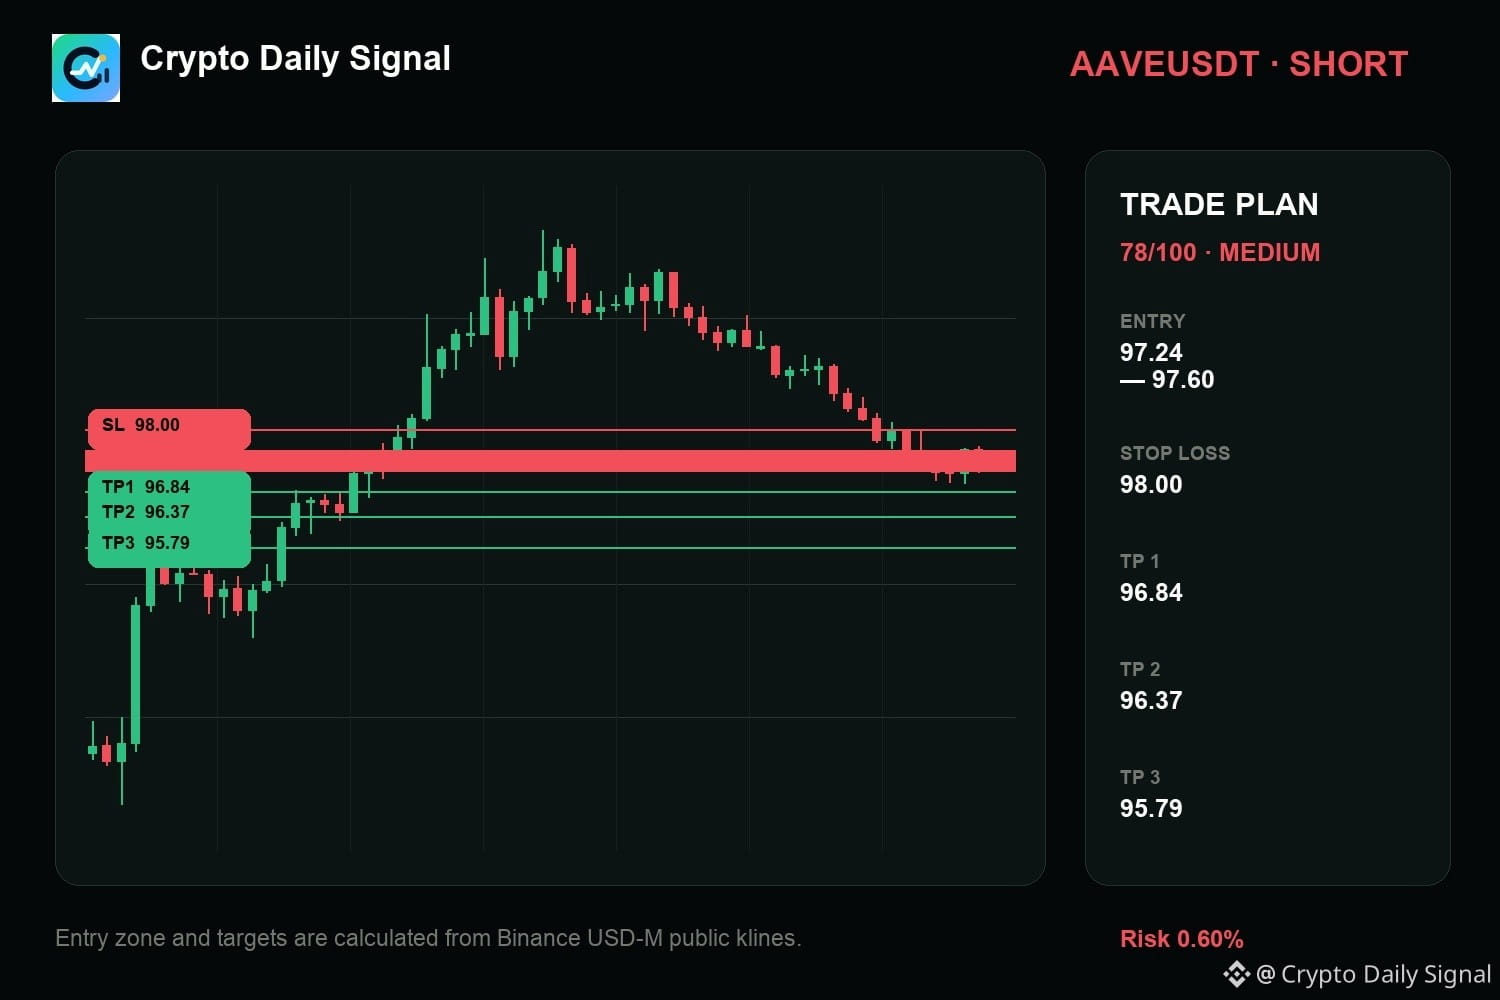
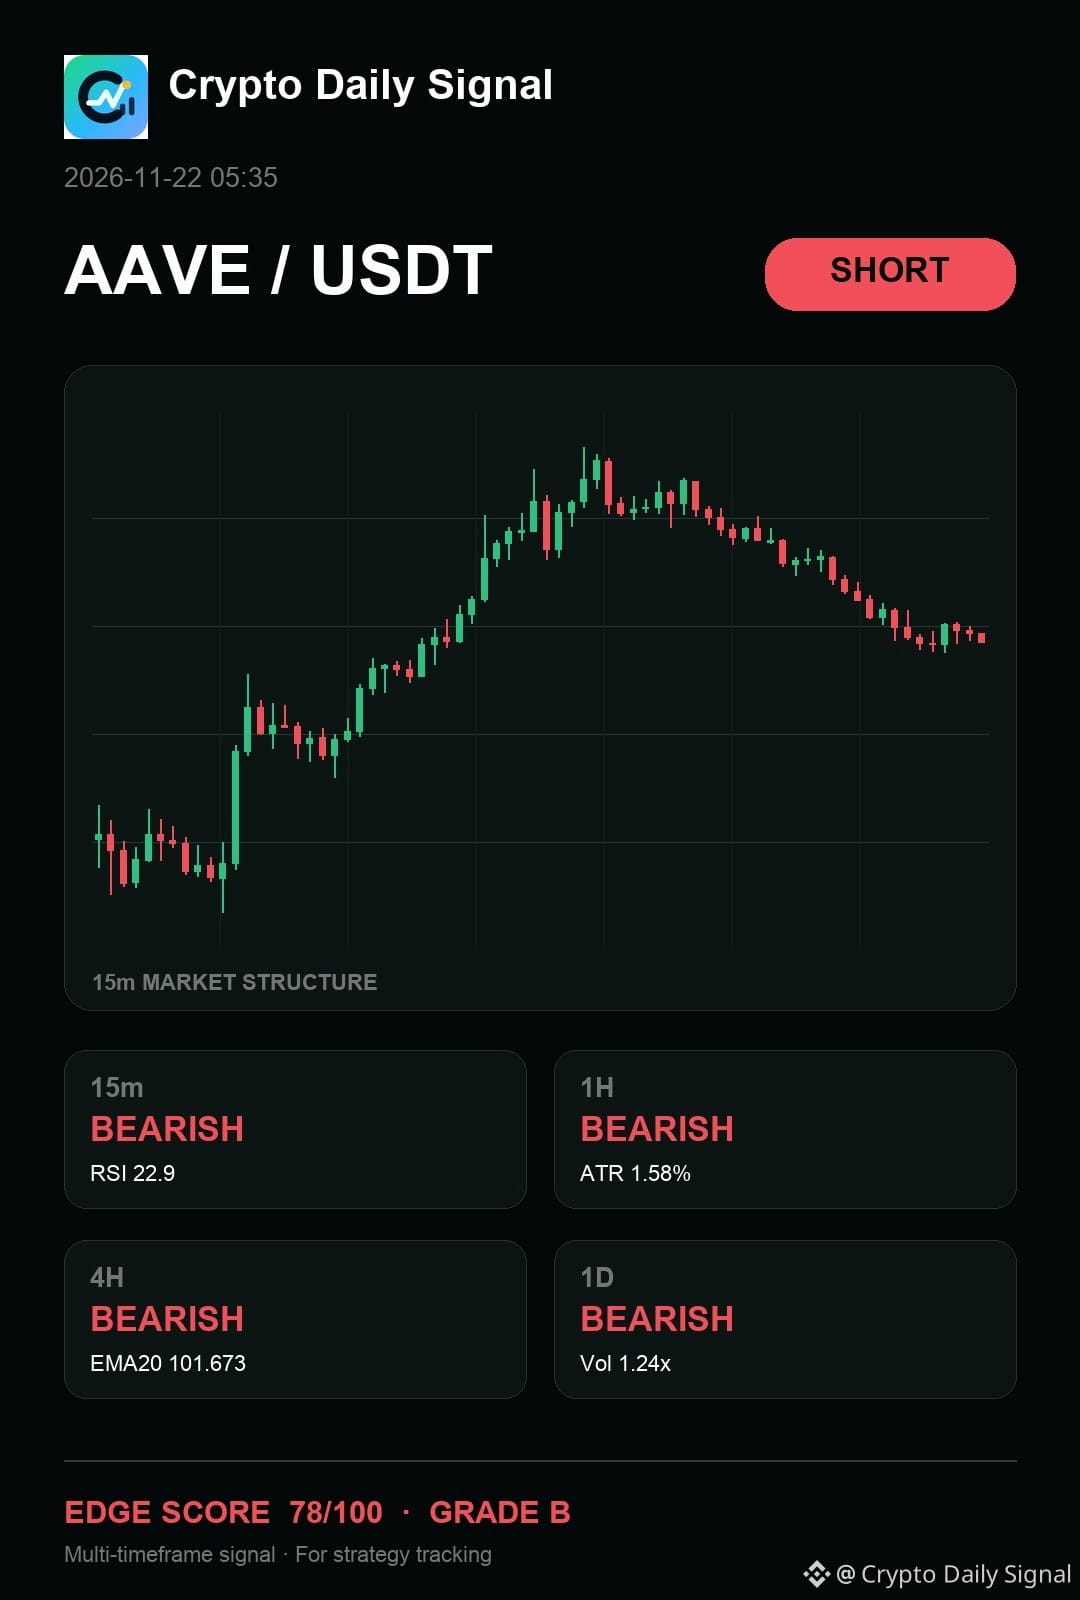
$AAVE — okay, my read still says it still gives sellers the cleaner argument as the price struggles to push past its recent resistance levels. We are seeing multiple peaks fail to advance beyond the immediate selling zone, and the whole four-hour and daily bias is pointing down. A break above those higher points would change the story entirely.
Trade Plan — AAVEUSDT SHORT
Entry: 97.24 - 97.60
Stop Loss: 98.00
TP1: 96.84 | TP2: 96.37 | TP3: 95.79
Would you take it here, or wait for one more confirmation candle?
#TradingSignal
{future}(AAVEUSDT)
$AAVE — okay, my read still says it still gives sellers the cleaner argument as the price struggles to push past its recent resistance levels. We are seeing multiple peaks fail to advance beyond the immediate selling zone, and the whole four-hour and daily bias is pointing down. A break above those higher points would change the story entirely.
Trade Plan — AAVEUSDT SHORT
Entry: 97.24 - 97.60
Stop Loss: 98.00
TP1: 96.84 | TP2: 96.37 | TP3: 95.79
Would you take it here, or wait for one more confirmation candle?
#TradingSignal
Trade Plan — AAVEUSDT SHORT
Entry: 97.24 - 97.60
Stop Loss: 98.00
TP1: 96.84 | TP2: 96.37 | TP3: 95.79
Would you take it here, or wait for one more confirmation candle?
#TradingSignal
10
·
--
🔥 DOS SHORT setup triggered.
Bias: Bearish pressure with strong volume spikes. Price dropping 5m and 15m while volume surges +4736% and +1430%.
Entry: 0.1473
SL: 0.149134
TP1: 0.144549
TP2: 0.142714
⚠️ This is a signal, not a guarantee.
Question: Are you watching DOS for a break below TP2?
#DOSUSDT #CryptoSetup
$DOS #TradingSignal #CryptoAnalysis
🔥 DOS SHORT setup triggered.
Bias: Bearish pressure with strong volume spikes. Price dropping 5m and 15m while volume surges +4736% and +1430%.
Entry: 0.1473
SL: 0.149134
TP1: 0.144549
TP2: 0.142714
⚠️ This is a signal, not a guarantee.
Question: Are you watching DOS for a break below TP2?
#DOSUSDT #CryptoSetup
$DOS #TradingSignal #CryptoAnalysis
Bias: Bearish pressure with strong volume spikes. Price dropping 5m and 15m while volume surges +4736% and +1430%.
Entry: 0.1473
SL: 0.149134
TP1: 0.144549
TP2: 0.142714
⚠️ This is a signal, not a guarantee.
Question: Are you watching DOS for a break below TP2?
#DOSUSDT #CryptoSetup
$DOS #TradingSignal #CryptoAnalysis

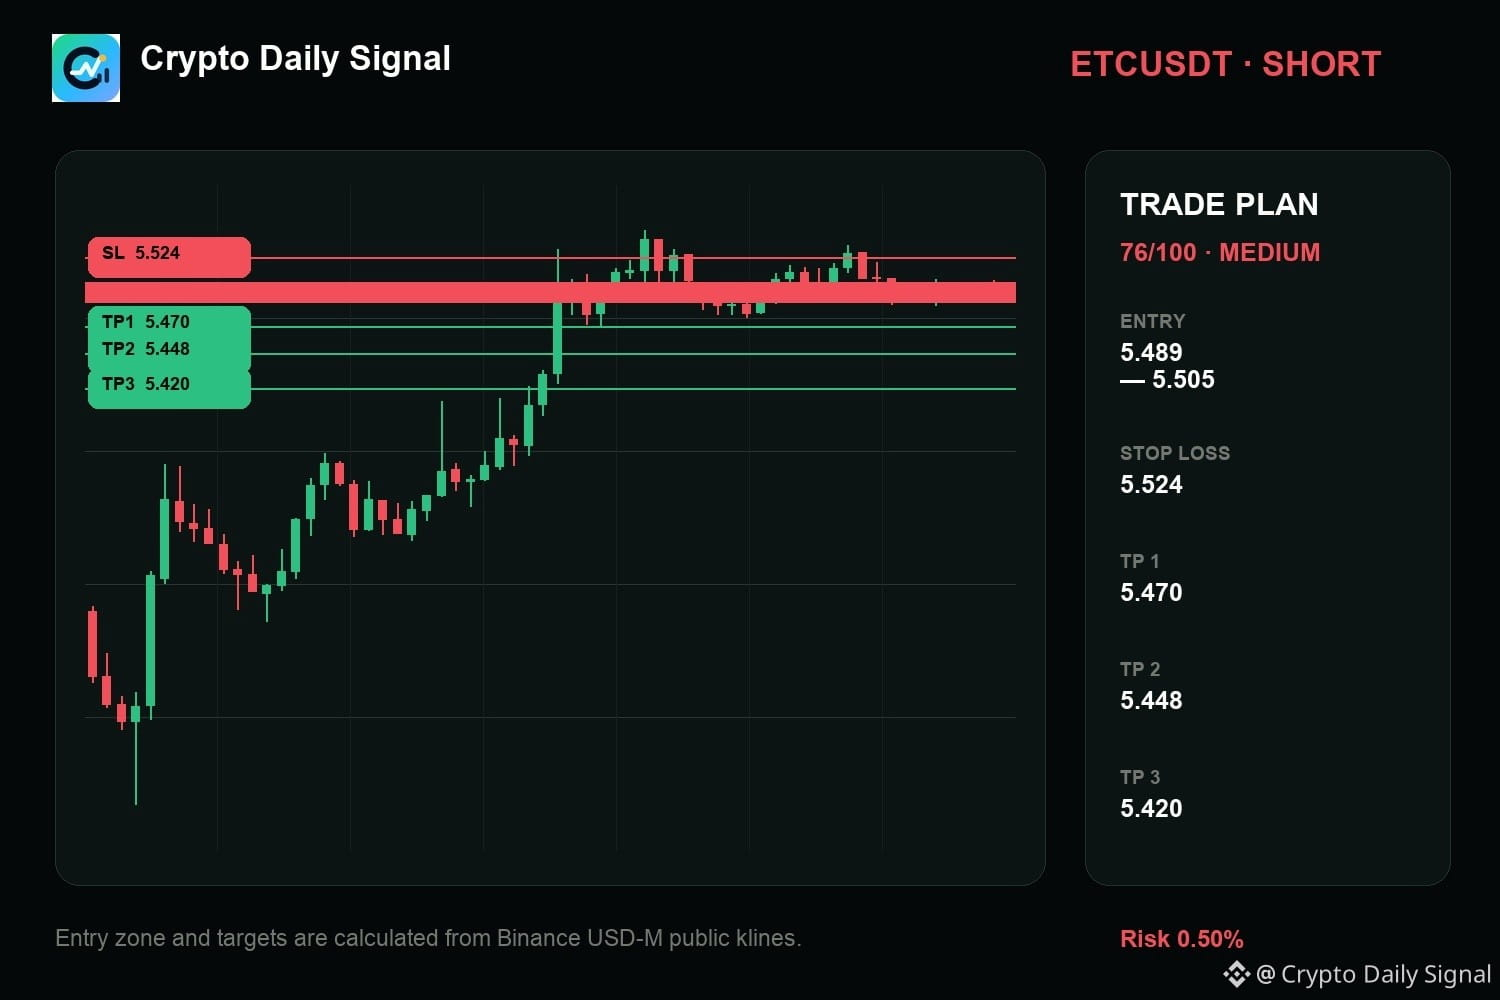
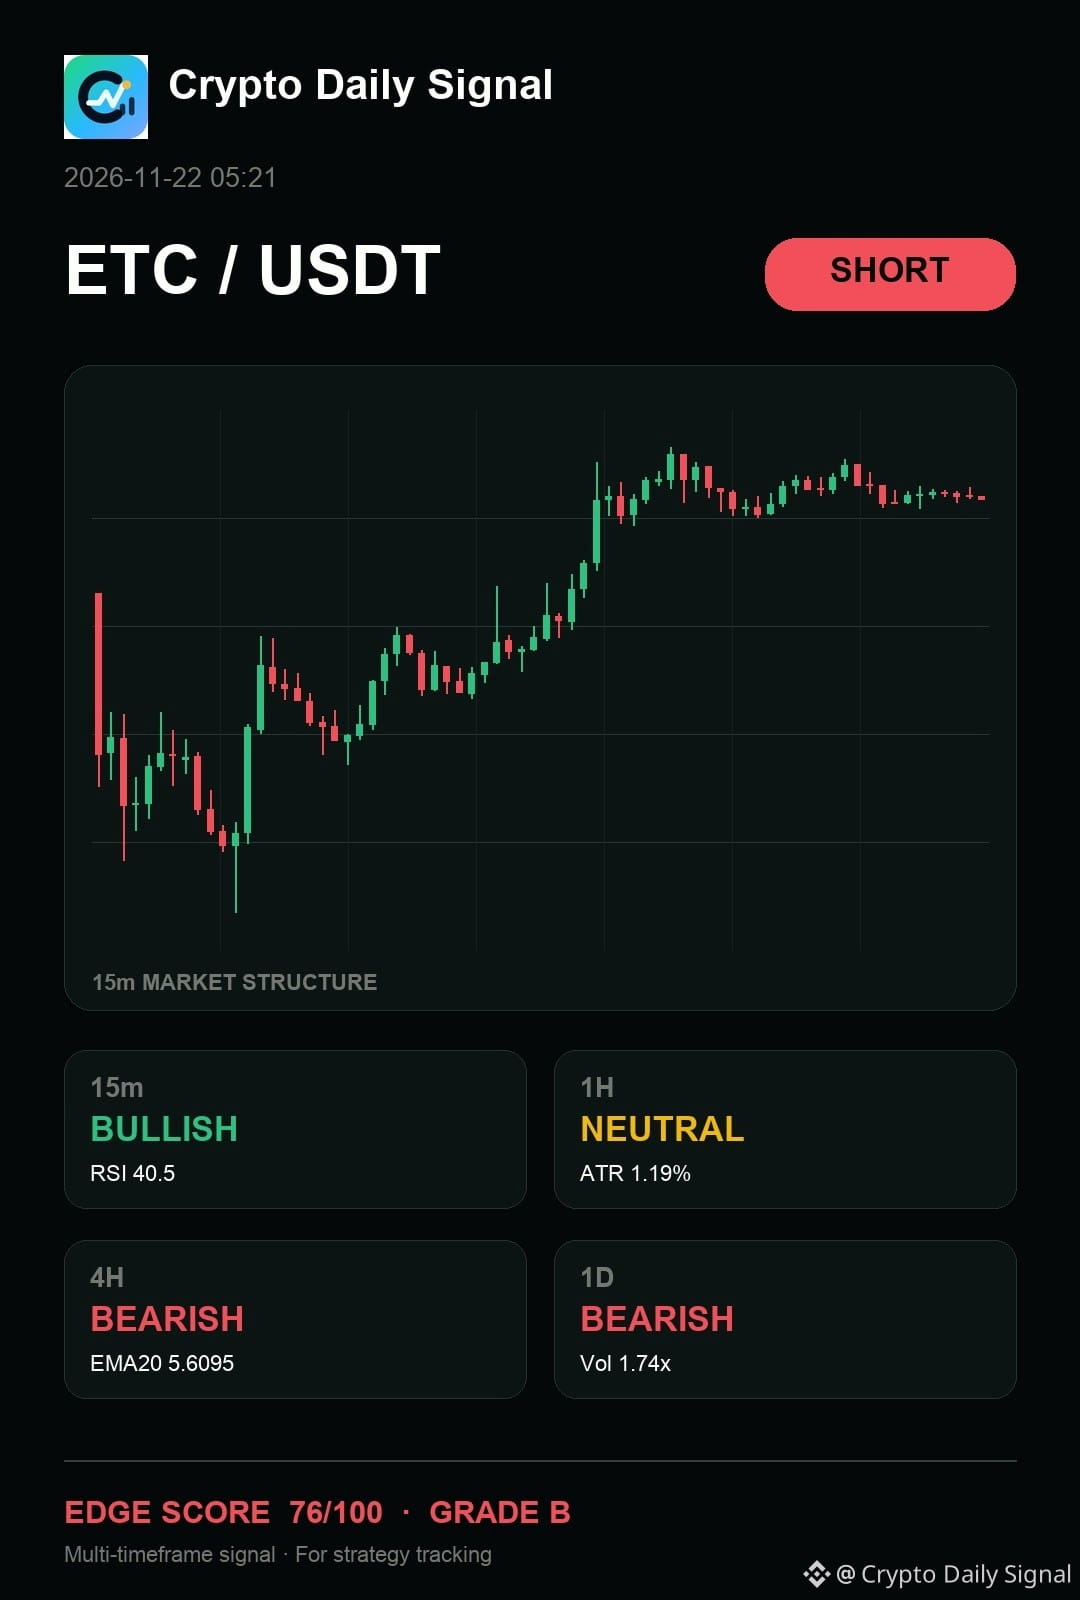
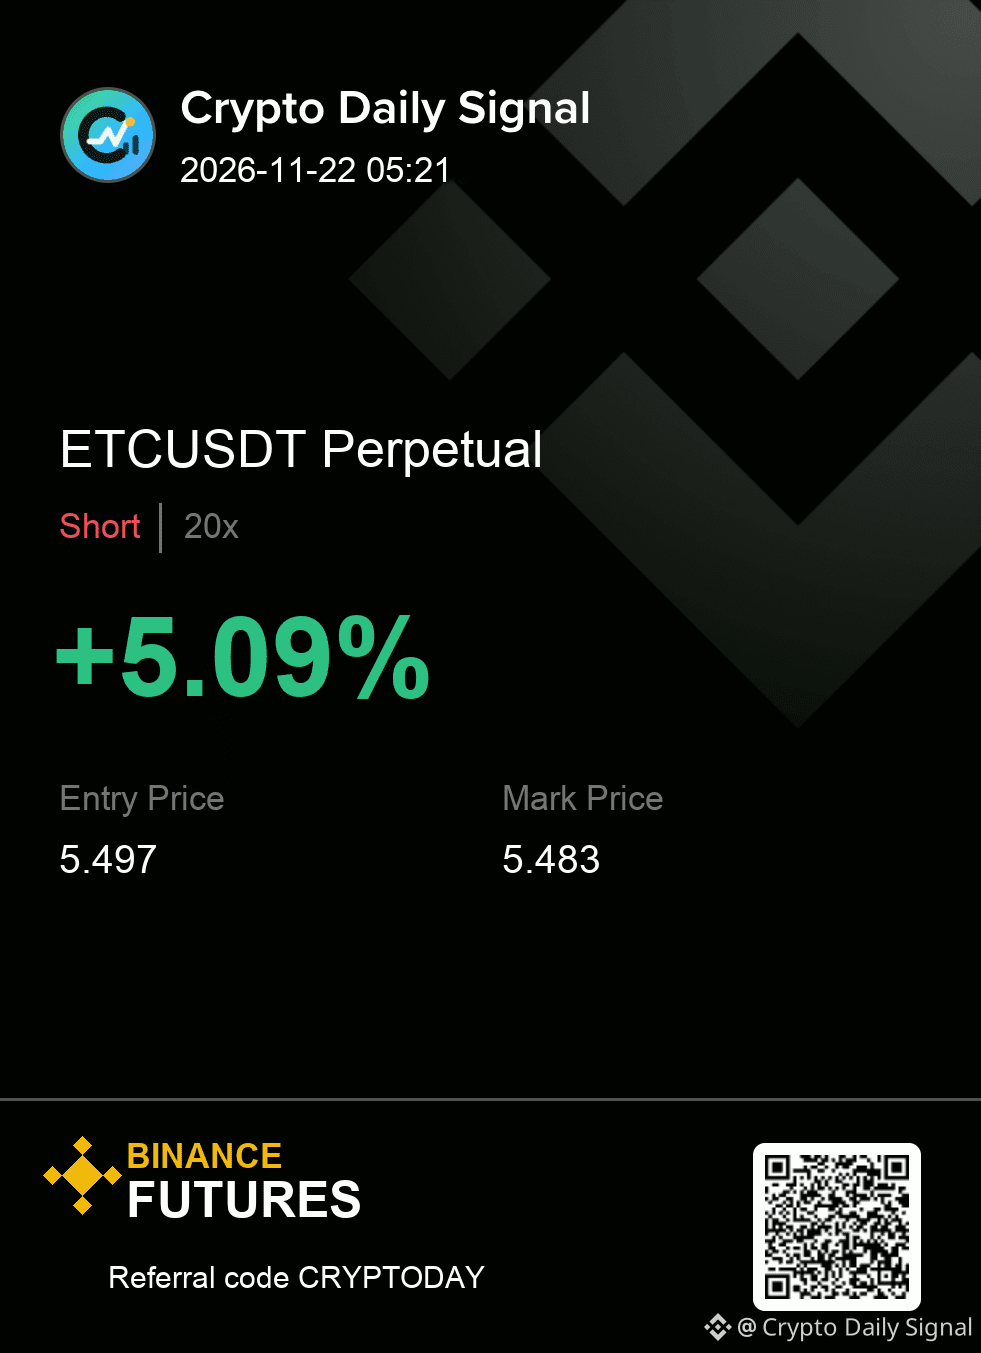
$ETC — quick take, I still think it sits on my short-side watchlist because the asset is currently stuck in a tight trading range while the higher timeframes suggest a down bias. We're seeing rejections forming near the upper boundary of this consolidation. A clear break above that upper boundary would complicate the short picture.
ETCUSDT SHORT
IN 5.489 - 5.505
OUT 5.524
TP 5.470 · 5.448 · 5.420
#TradingSignal
{future}(ETCUSDT)
$ETC — quick take, I still think it sits on my short-side watchlist because the asset is currently stuck in a tight trading range while the higher timeframes suggest a down bias. We're seeing rejections forming near the upper boundary of this consolidation. A clear break above that upper boundary would complicate the short picture.
ETCUSDT SHORT
IN 5.489 - 5.505
OUT 5.524
TP 5.470 · 5.448 · 5.420
#TradingSignal
ETCUSDT SHORT
IN 5.489 - 5.505
OUT 5.524
TP 5.470 · 5.448 · 5.420
#TradingSignal
18
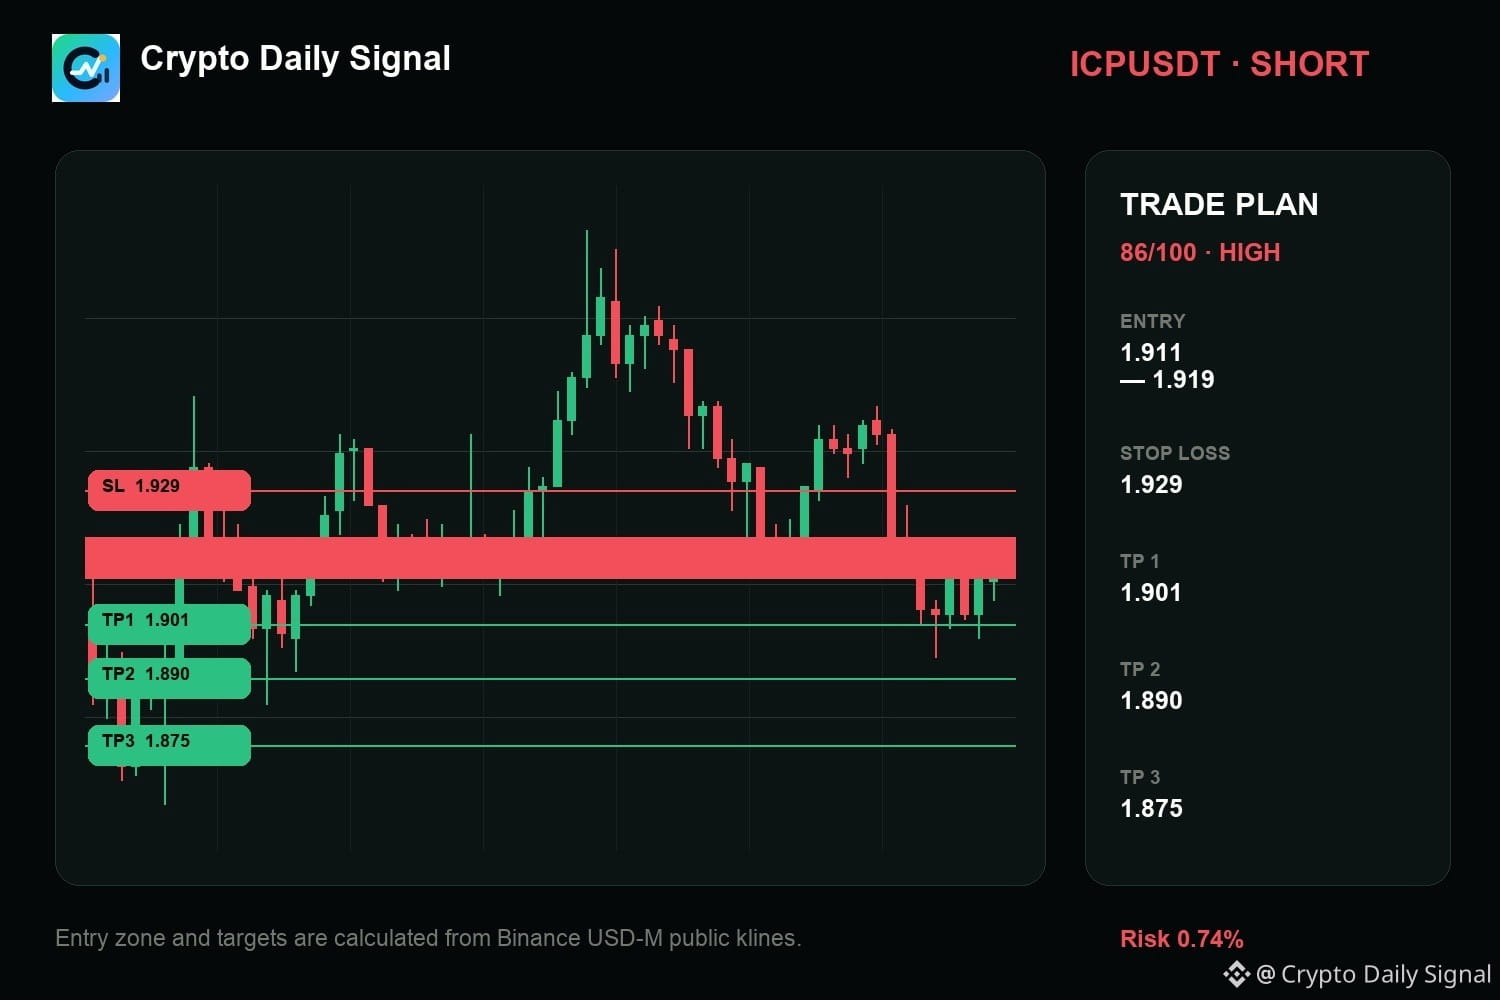
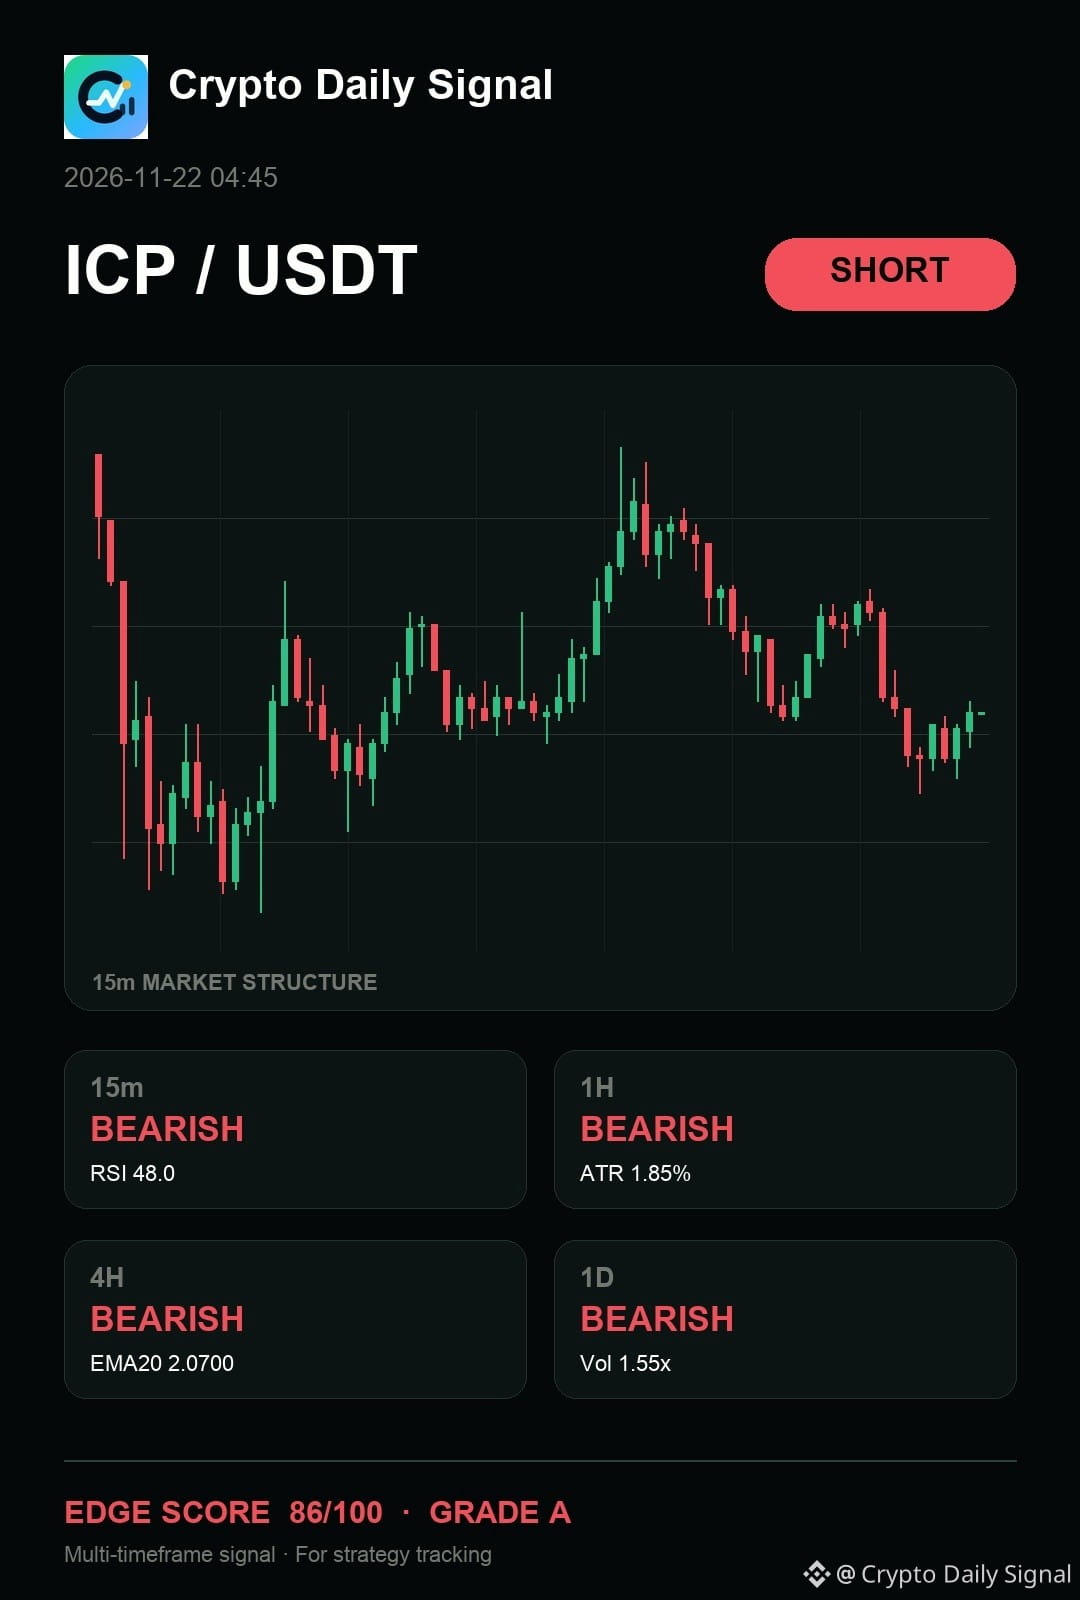
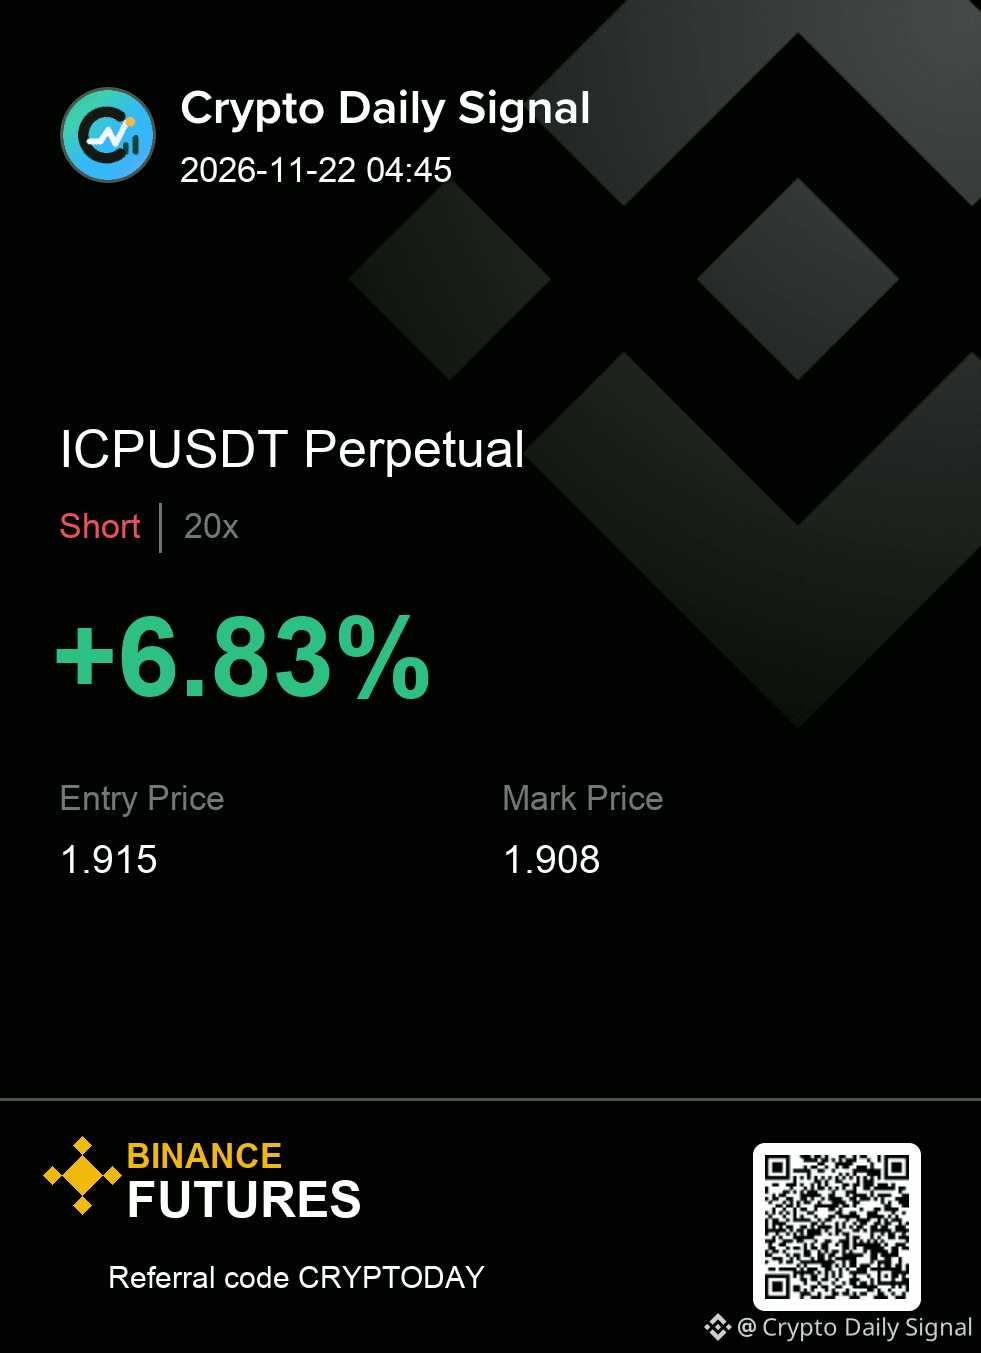
$ICP — quick take, I still think it keeps the bearish thesis active as the price stays boxed in a tight trading range. Recent candles show a tendency toward lower highs, suggesting sellers maintain control even if momentum across the short-term is balanced.
The map is useful only while the invalidation remains intact.
My levels for ICPUSDT — SHORT
Entry zone 1.911 - 1.919
Risk line 1.929
Targets 1.901 / 1.890 / 1.875
#TradingSignal
{future}(ICPUSDT)
$ICP — quick take, I still think it keeps the bearish thesis active as the price stays boxed in a tight trading range. Recent candles show a tendency toward lower highs, suggesting sellers maintain control even if momentum across the short-term is balanced.
The map is useful only while the invalidation remains intact.
My levels for ICPUSDT — SHORT
Entry zone 1.911 - 1.919
Risk line 1.929
Targets 1.901 / 1.890 / 1.875
#TradingSignal
The map is useful only while the invalidation remains intact.
My levels for ICPUSDT — SHORT
Entry zone 1.911 - 1.919
Risk line 1.929
Targets 1.901 / 1.890 / 1.875
#TradingSignal
17
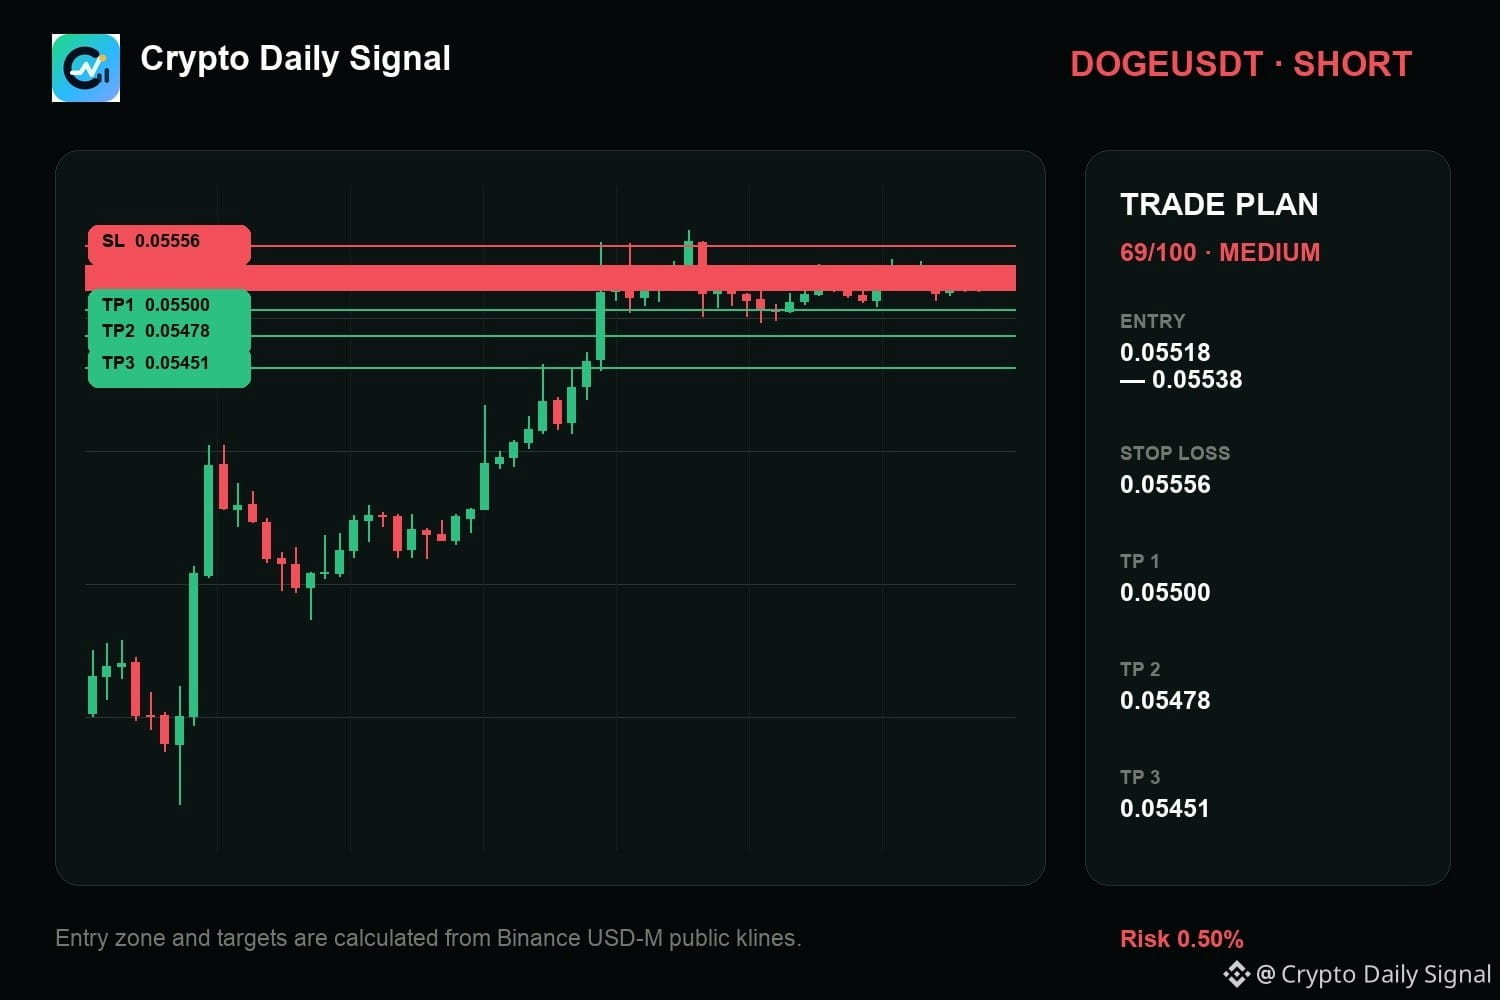
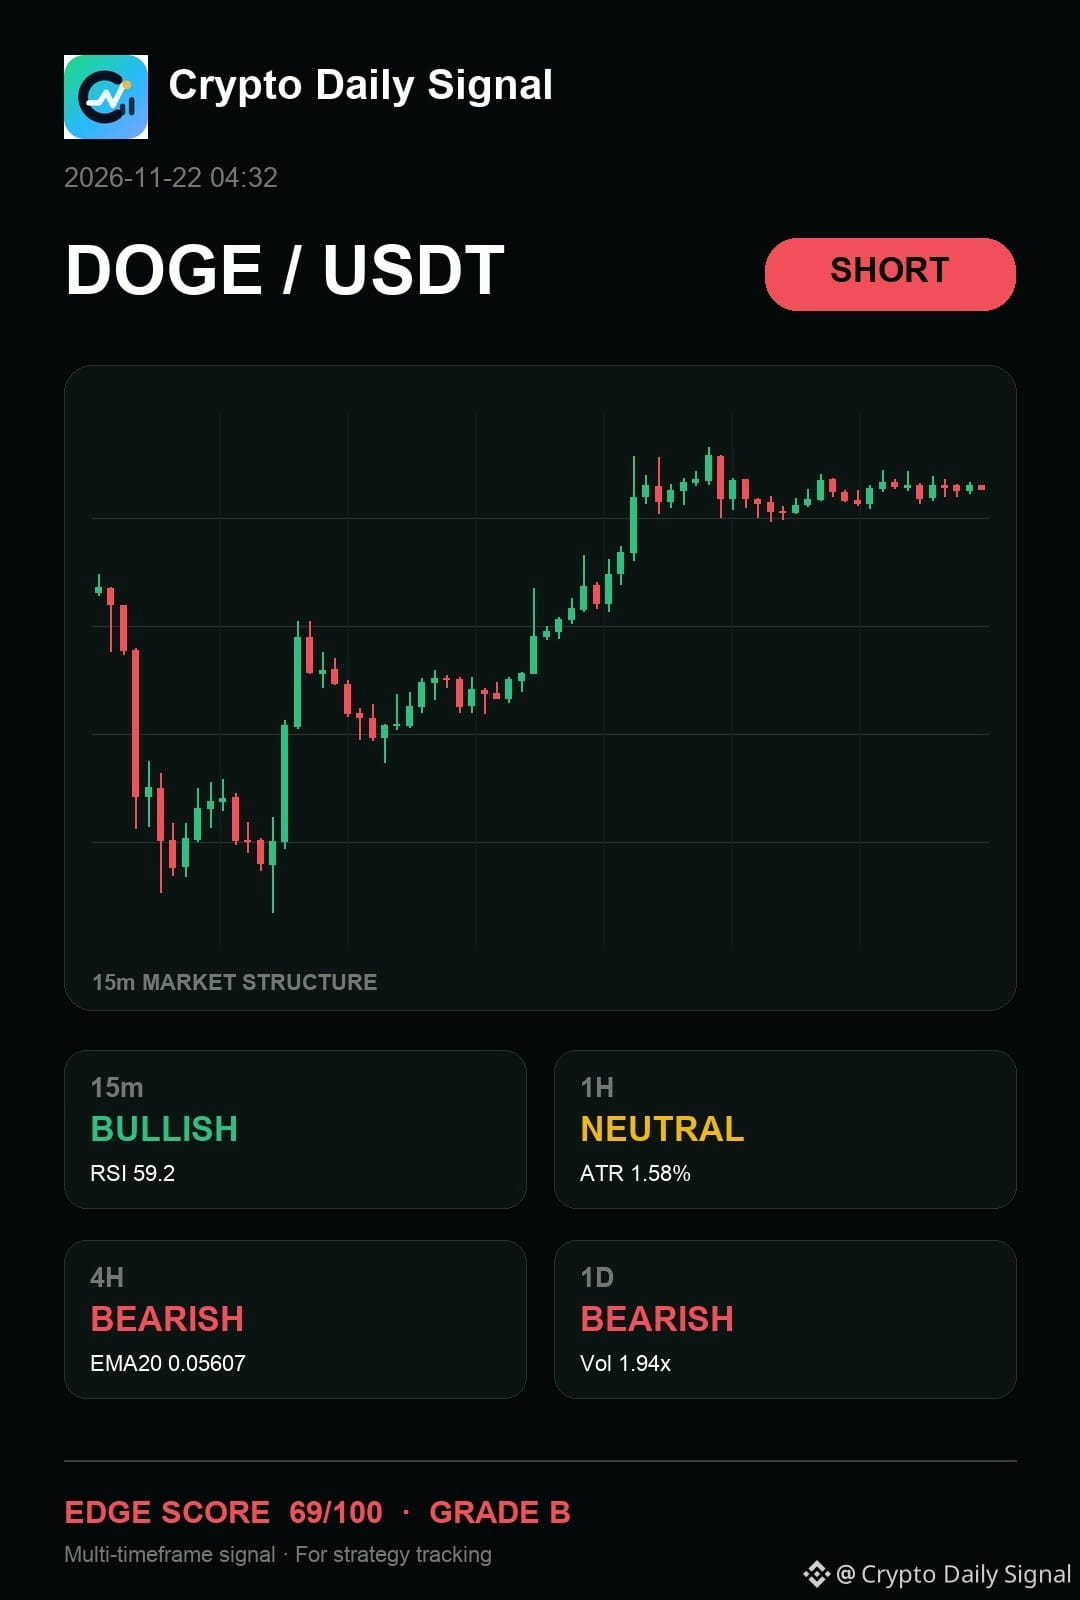
$DOGE is one rejection away from a cleaner short after failing to push past the recent upper boundary. The overall flow lacks real conviction to break higher, and the longer-term trend structure points downward. What would make this idea weaker is a decisive move cleanly above the recent short-term resistance level.
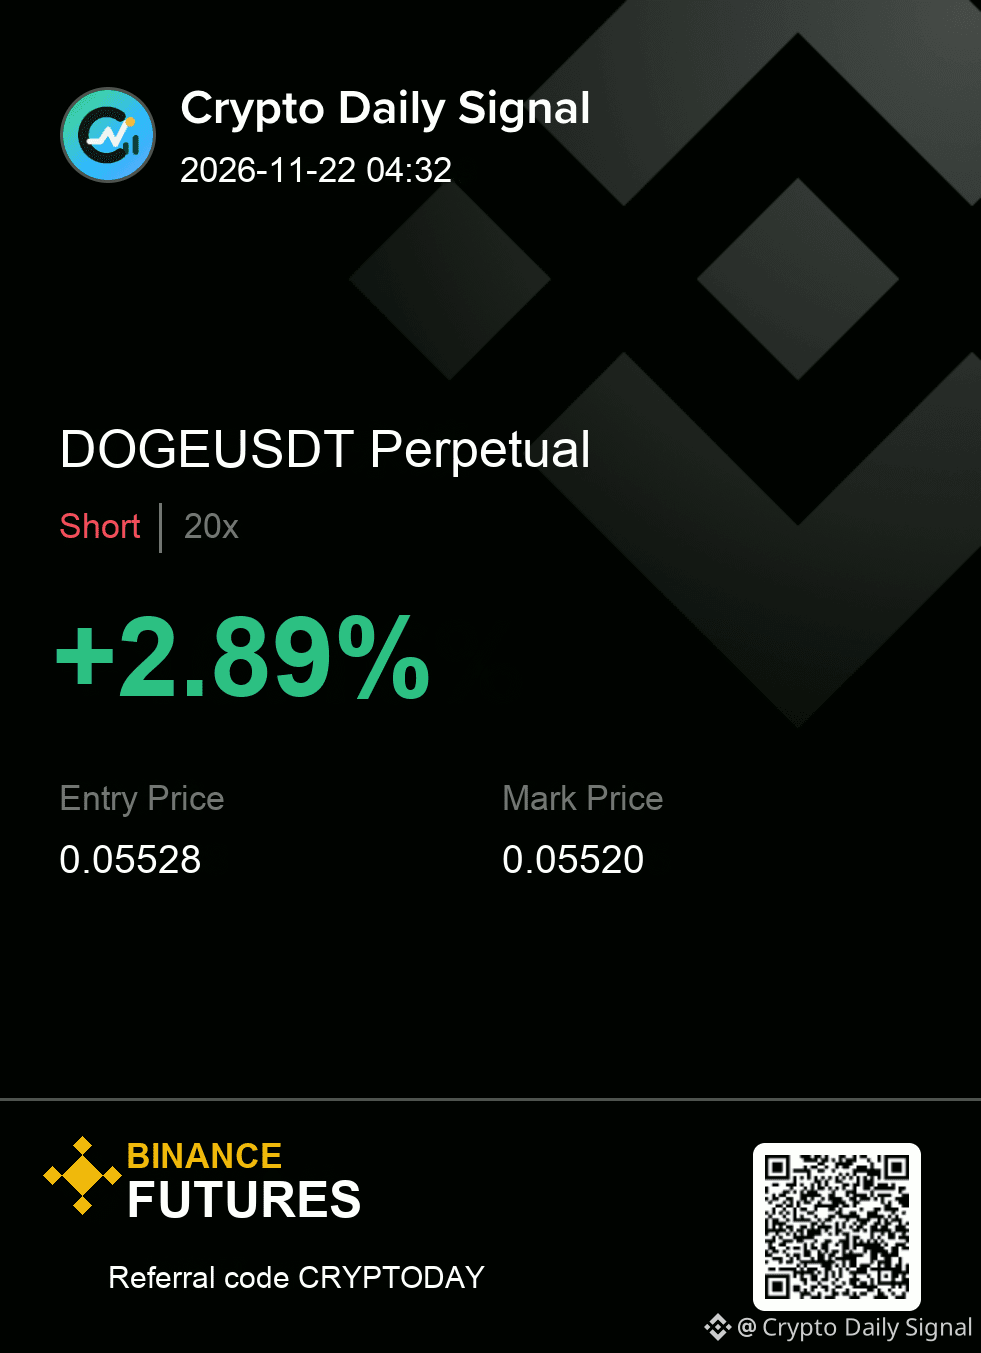
DOGEUSDT | SHORT
Entry 0.05518 - 0.05538
Invalidation 0.05556
Targets 0.05500 / 0.05478 / 0.05451
I am tracking the reaction inside the entry zone. What would make you pass on it?
#TradingSignal
{future}(DOGEUSDT)
$DOGE is one rejection away from a cleaner short after failing to push past the recent upper boundary. The overall flow lacks real conviction to break higher, and the longer-term trend structure points downward. What would make this idea weaker is a decisive move cleanly above the recent short-term resistance level.
DOGEUSDT | SHORT
Entry 0.05518 - 0.05538
Invalidation 0.05556
Targets 0.05500 / 0.05478 / 0.05451
I am tracking the reaction inside the entry zone. What would make you pass on it?
#TradingSignal
DOGEUSDT | SHORT
Entry 0.05518 - 0.05538
Invalidation 0.05556
Targets 0.05500 / 0.05478 / 0.05451
I am tracking the reaction inside the entry zone. What would make you pass on it?
#TradingSignal
11
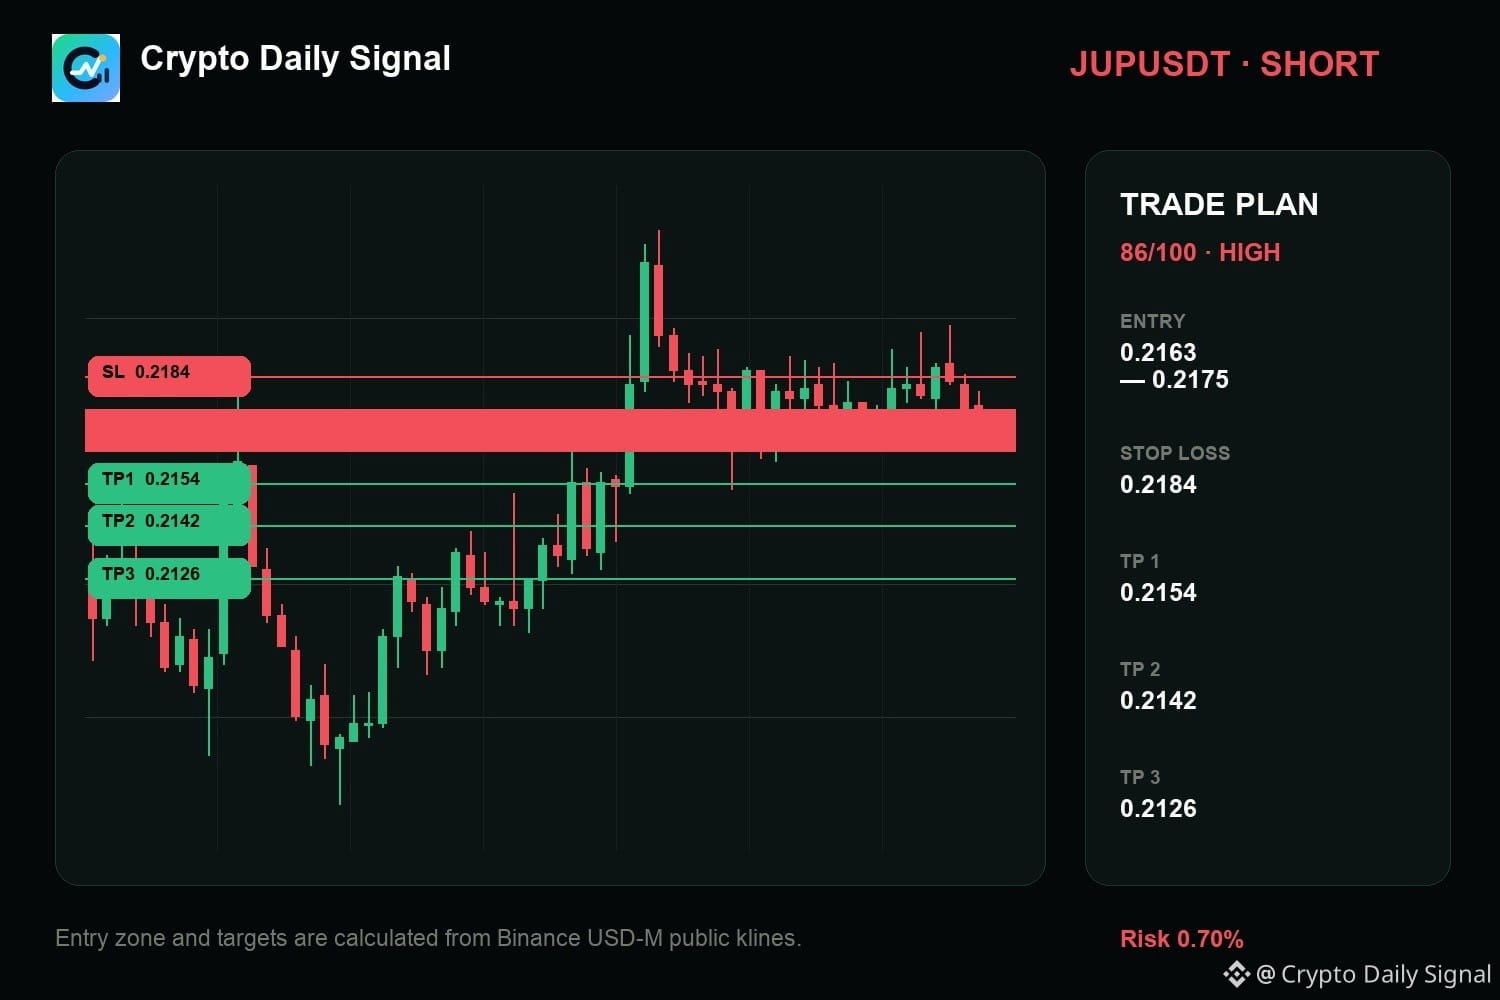
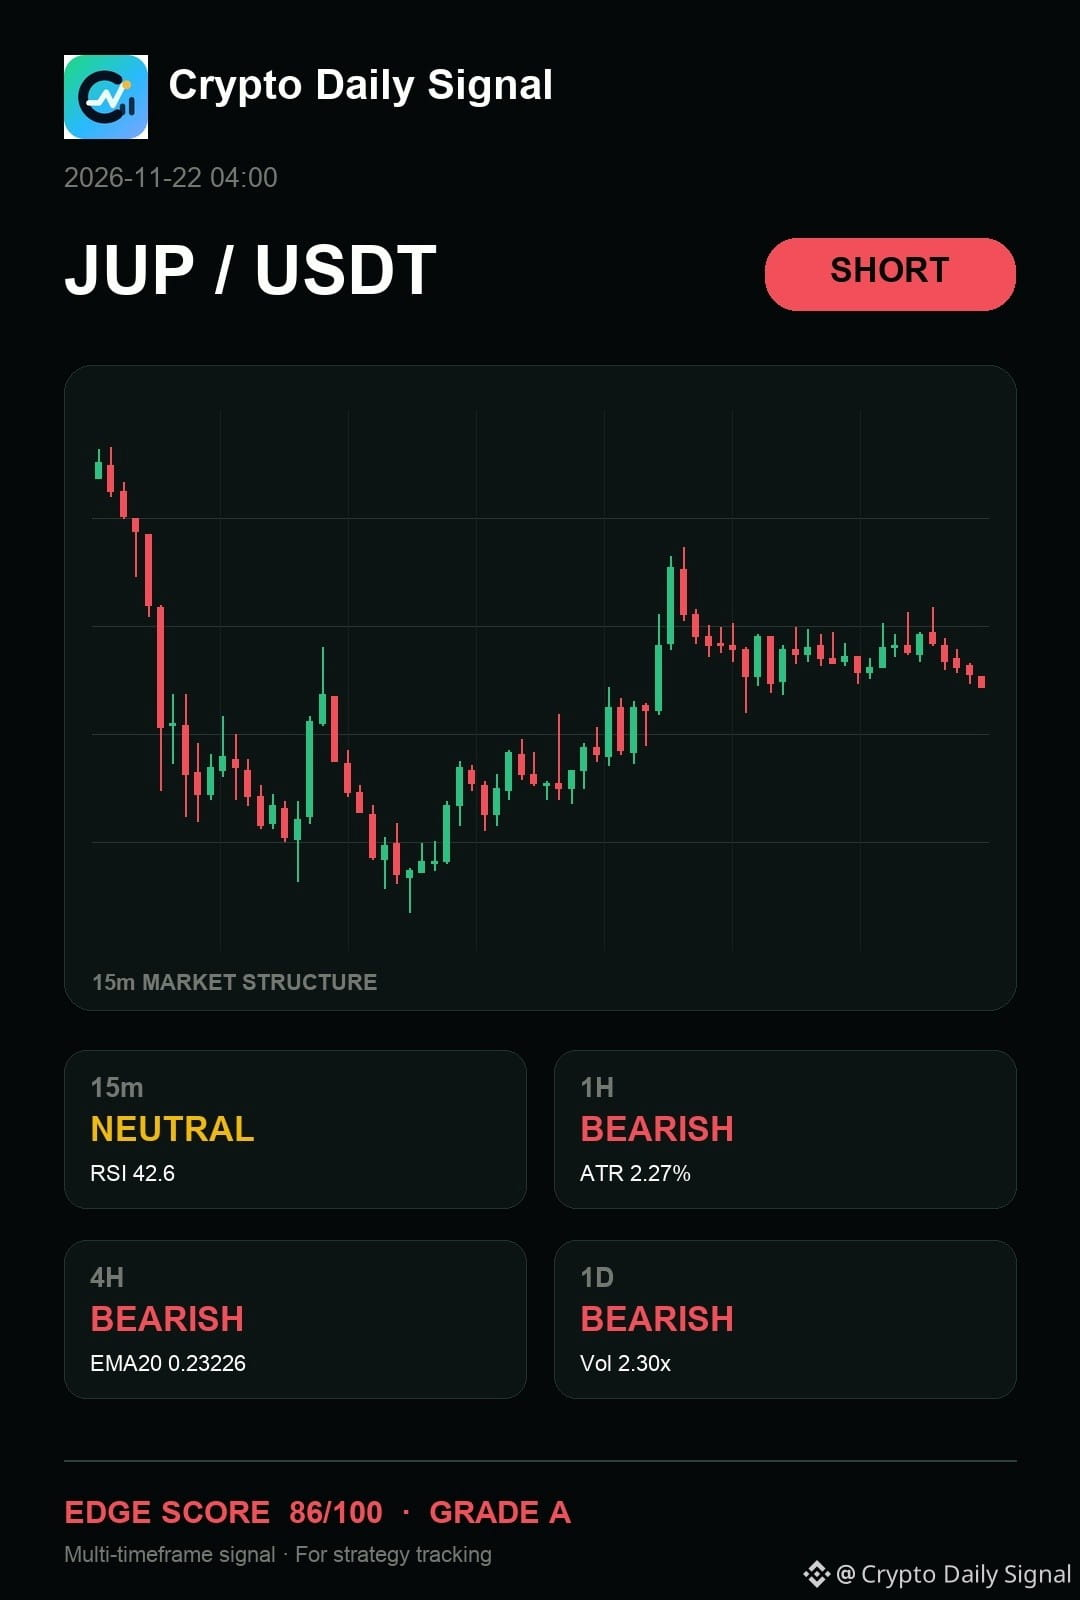
$JUP — for me, the core read is that it needs confirmation before I press the short. The current setup is tucked tightly within a range, though the daily and four-hour charts are pointing down. For this to become a solid short idea, I need a convincing bearish candle to close below the bottom of that visible range. If it breaks above the short-term high, that changes the whole picture immediately.
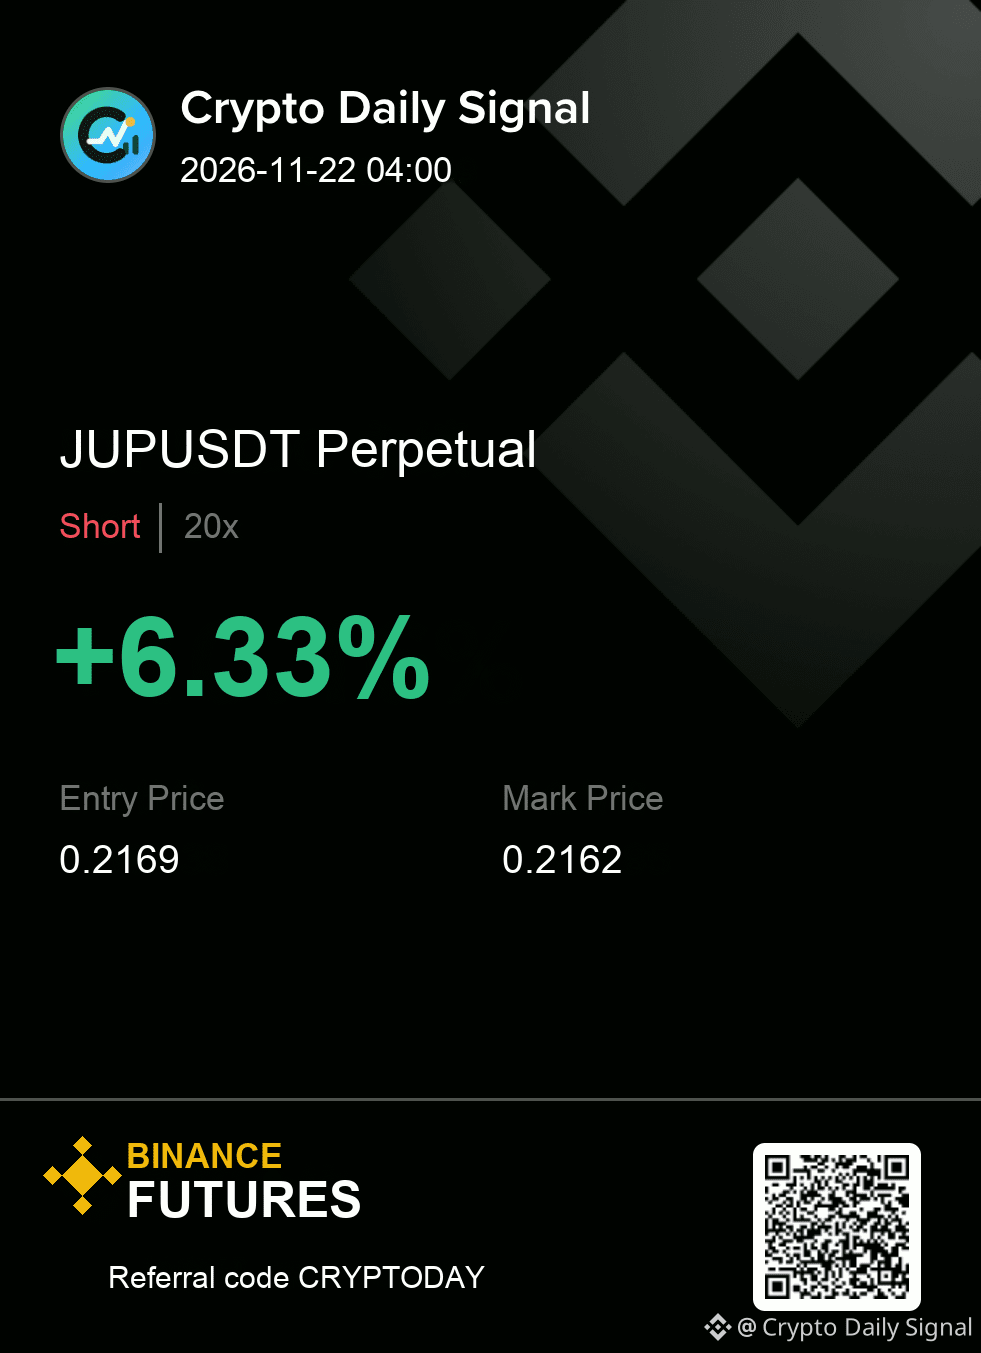
JUPUSDT SHORT map
Entry → 0.2163 - 0.2175
SL → 0.2184
TP → 0.2154 · 0.2142 · 0.2126
Clean enough to execute, or still too early for you?
#TradingSignal
{future}(JUPUSDT)
$JUP — for me, the core read is that it needs confirmation before I press the short. The current setup is tucked tightly within a range, though the daily and four-hour charts are pointing down. For this to become a solid short idea, I need a convincing bearish candle to close below the bottom of that visible range. If it breaks above the short-term high, that changes the whole picture immediately.
JUPUSDT SHORT map
Entry → 0.2163 - 0.2175
SL → 0.2184
TP → 0.2154 · 0.2142 · 0.2126
Clean enough to execute, or still too early for you?
#TradingSignal
JUPUSDT SHORT map
Entry → 0.2163 - 0.2175
SL → 0.2184
TP → 0.2154 · 0.2142 · 0.2126
Clean enough to execute, or still too early for you?
#TradingSignal
7
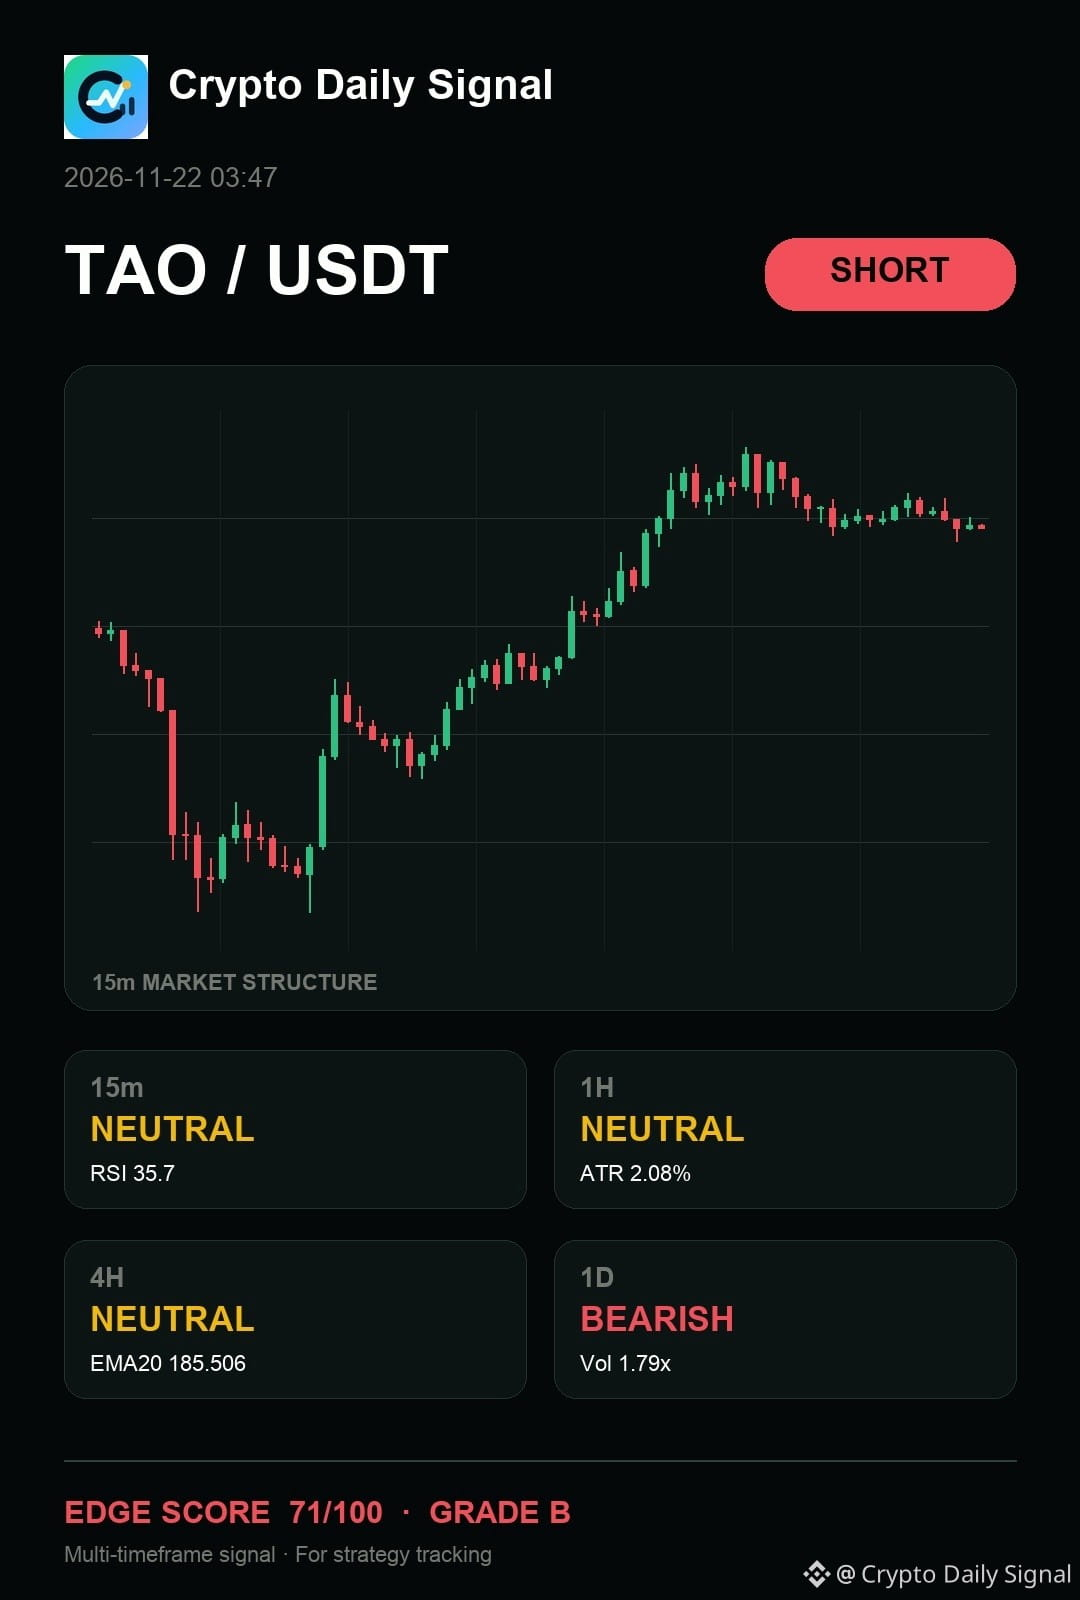
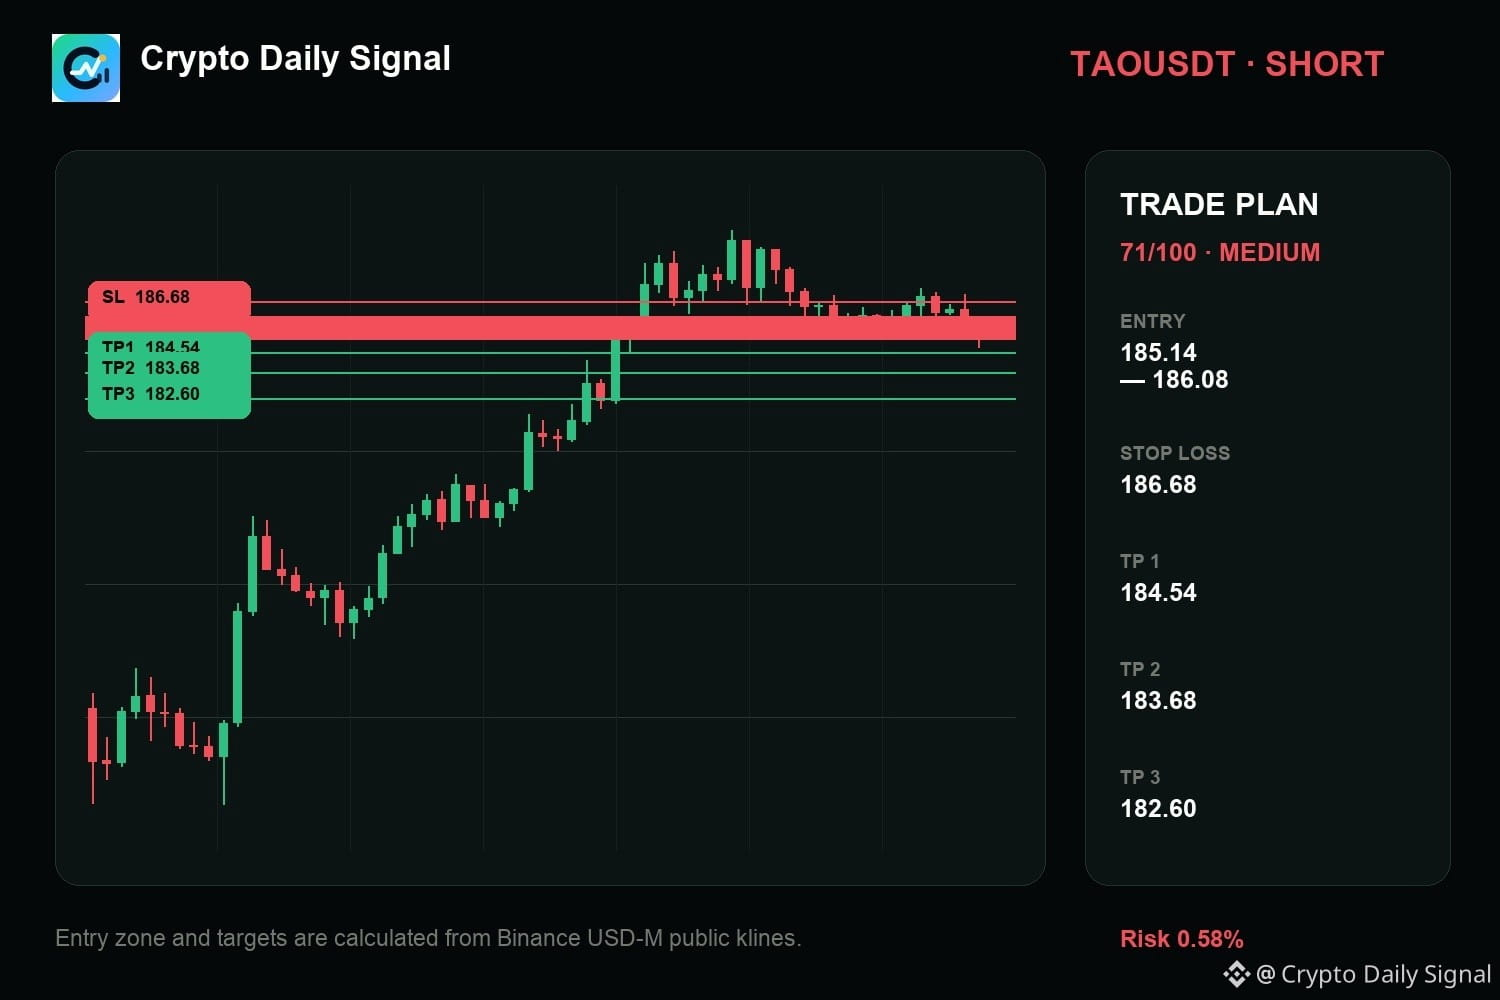
$TAO needs the sell-side reaction to confirm the downside, given the price action is trapped inside a tight range. Upper wicks show rejection at higher levels, aligning with the overall daily trend being bearish. A clear close below the range floor on a down candle would be the signal, though a break above that ceiling would negate the thesis.
Levels — TAOUSDT
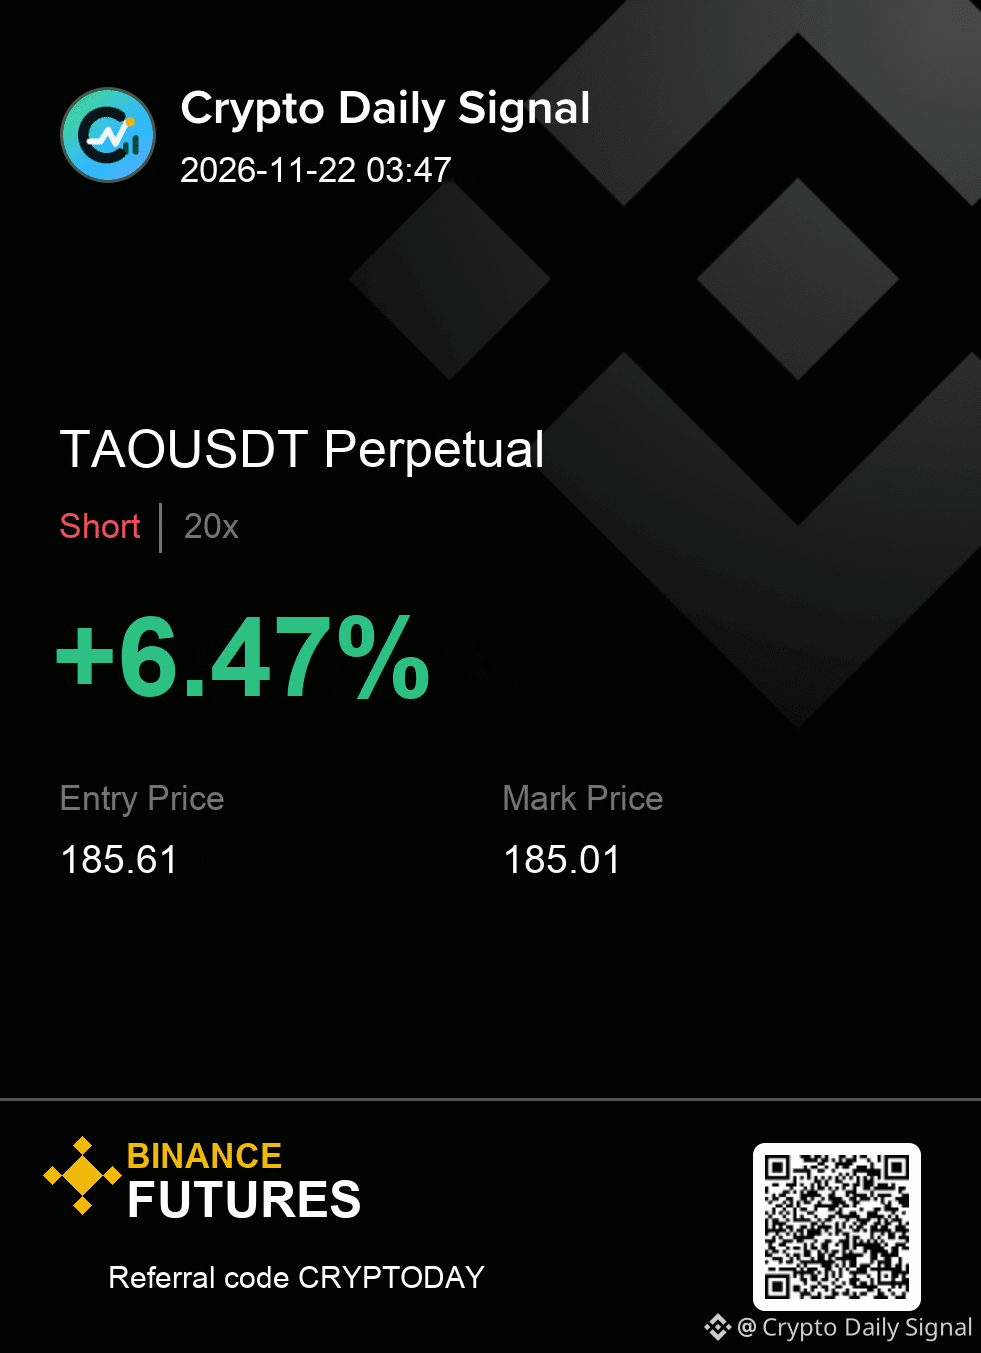
Zone: 185.14 - 186.08
Cut: 186.68
Scale: 184.54 | 183.68 | 182.60
#TradingSignal
{future}(TAOUSDT)
$TAO needs the sell-side reaction to confirm the downside, given the price action is trapped inside a tight range. Upper wicks show rejection at higher levels, aligning with the overall daily trend being bearish. A clear close below the range floor on a down candle would be the signal, though a break above that ceiling would negate the thesis.
Levels — TAOUSDT
Zone: 185.14 - 186.08
Cut: 186.68
Scale: 184.54 | 183.68 | 182.60
#TradingSignal
Levels — TAOUSDT
Zone: 185.14 - 186.08
Cut: 186.68
Scale: 184.54 | 183.68 | 182.60
#TradingSignal
8
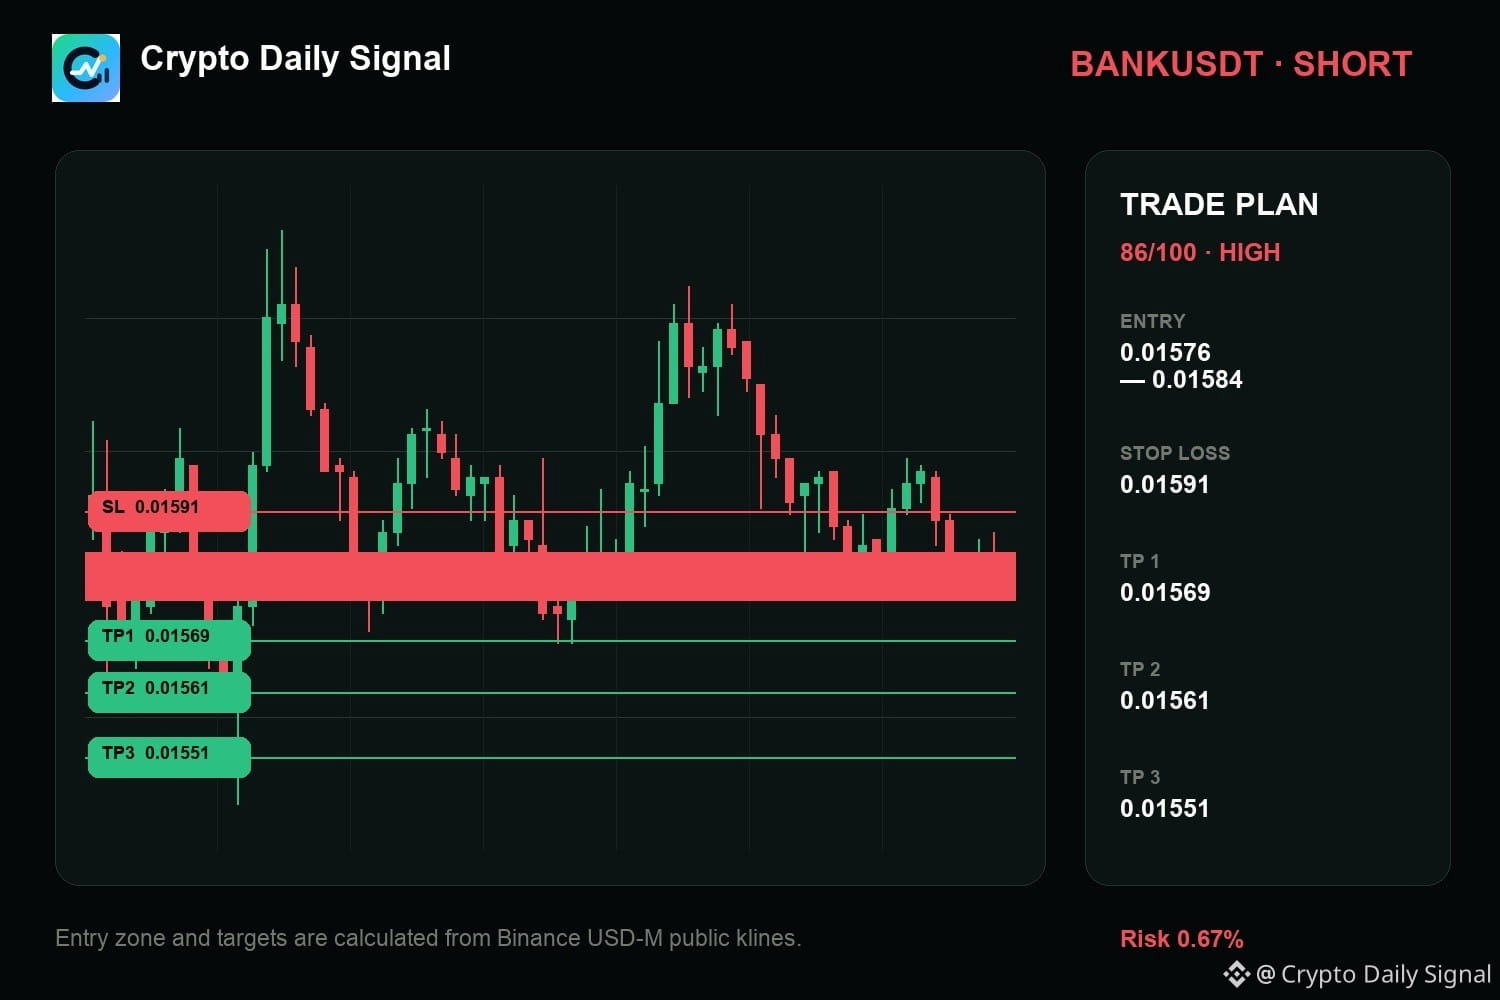
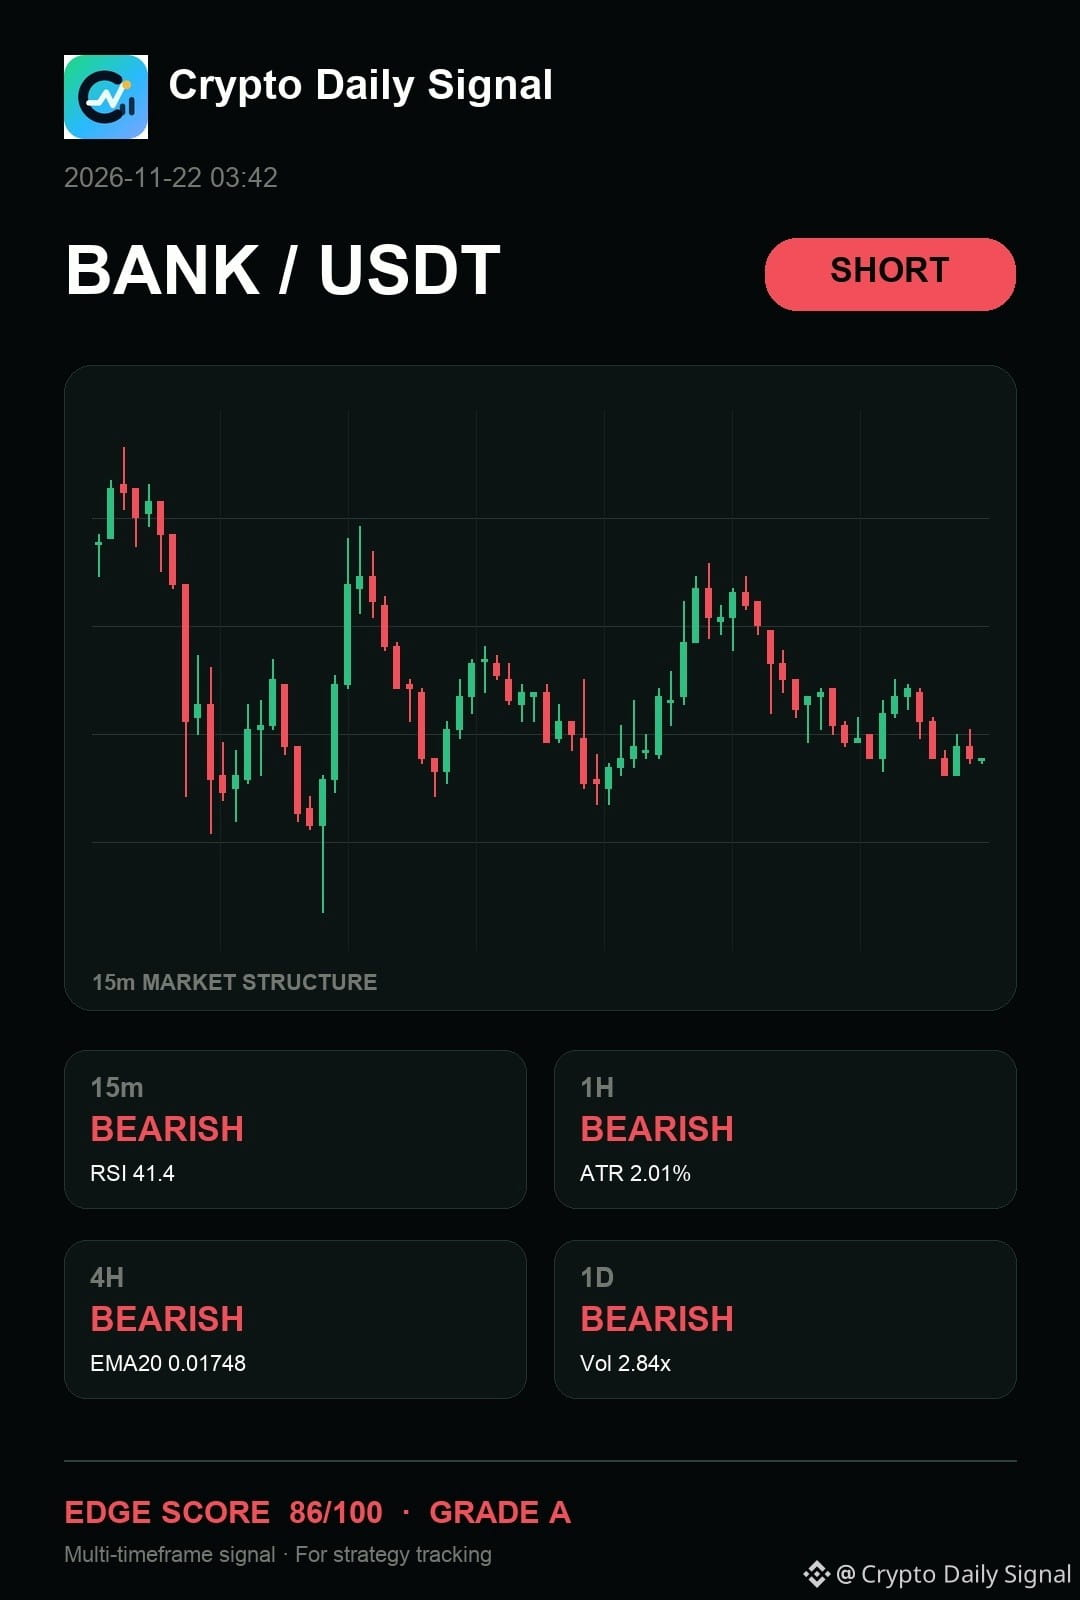
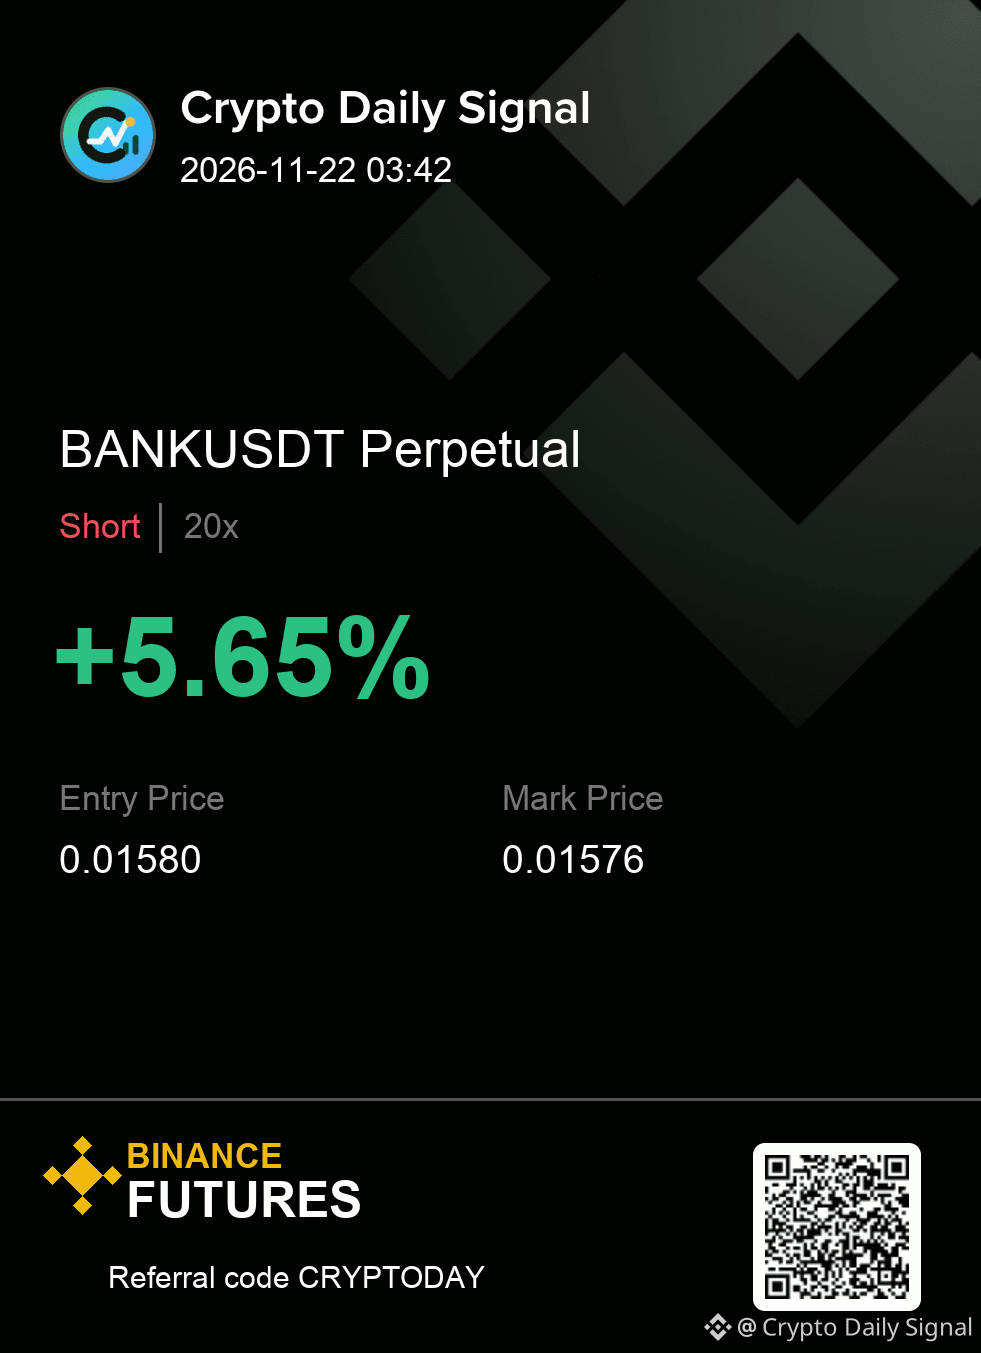
$BANK — okay, my read still says it keeps me focused on the downside response because the price action remains tucked inside a descending channel. This suggests continued selling pressure dominates the timeframe views. A decisive rejection below the range floor would strengthen this view, but a strong bounce above recent highs would make the short idea weaker.
BANKUSDT | SHORT
Entry 0.01576 - 0.01584
Invalidation 0.01591
Targets 0.01569 / 0.01561 / 0.01551
#TradingSignal
{future}(BANKUSDT)
$BANK — okay, my read still says it keeps me focused on the downside response because the price action remains tucked inside a descending channel. This suggests continued selling pressure dominates the timeframe views. A decisive rejection below the range floor would strengthen this view, but a strong bounce above recent highs would make the short idea weaker.
BANKUSDT | SHORT
Entry 0.01576 - 0.01584
Invalidation 0.01591
Targets 0.01569 / 0.01561 / 0.01551
#TradingSignal
BANKUSDT | SHORT
Entry 0.01576 - 0.01584
Invalidation 0.01591
Targets 0.01569 / 0.01561 / 0.01551
#TradingSignal
8
තවත් අන්තර්ගතයන් ගවේෂණය කිරීමට ඇතුල් වන්න
Binance චතුරශ්රය හි ගෝලීය ක්රිප්ටෝ පරිශීලකයින් හා එක්වන්න
⚡️ ක්රිප්ටෝ පිළිබඳ නවතම සහ ප්රයෝජනවත් තොරතුරු ලබා ගන්න.
💬 ලොව විශාලතම ක්රිප්ටෝ හුවමාරුව මගින් විශ්වාස කෙරේ.
👍 සත්යායනය කරන ලද නිර්මාණකරුවන්ගෙන් සැබෑ විදසුන් සොයා ගන්න.
විද්යුත් තැපෑල / දුරකථන අංකය
නැගී එන මාතෘකා
1
#NvidiaLoses$2.7TrillionInMonthAndAHalf
26,783 නැරඹීම්
151 සාකච්ඡා කරමින්
2
#CanBTCReboundAfterFallingBelow60K?
831,663 නැරඹීම්
3,107 සාකච්ඡා කරමින්
3
#GlobalStocksFaceLongestLosingStreakSince2023
309,960 නැරඹීම්
2,075 සාකච්ඡා කරමින්
4
#BlackRockIBITPostsRecord$541MSingleDayOutflow
38,827 නැරඹීම්
111 සාකච්ඡා කරමින්
5
#AnthropicPlungesTowardIPOPriceonDay2
158,750 නැරඹීම්
1,256 සාකච්ඡා කරමින්
6
#TwentyOneCapitalAdds172.25BTC
74,045 නැරඹීම්
702 සාකච්ඡා කරමින්
7
#HKBillWouldExcludeTokenizedDepositsFromVirtualAssets
10,348 නැරඹීම්
51 සාකච්ඡා කරමින්
8
#BNBDropsBelow540USDTWith8.46%DailyDecline
85,200 නැරඹීම්
677 සාකච්ඡා කරමින්
9
#HKBillProposesHK$100KFineForUnauthorizedCryptoTitles
2,899 නැරඹීම්
25 සාකච්ඡා කරමින්
10
#BitMineFaces$10.1BUnrealizedETHLoss
6,004 නැරඹීම්
29 සාකච්ඡා කරමින්