
#nearprotocol
nearprotocol
1.8M නැරඹීම්
5,627 සාකච්ඡා කරමින්
උණුසුම්
නවතම


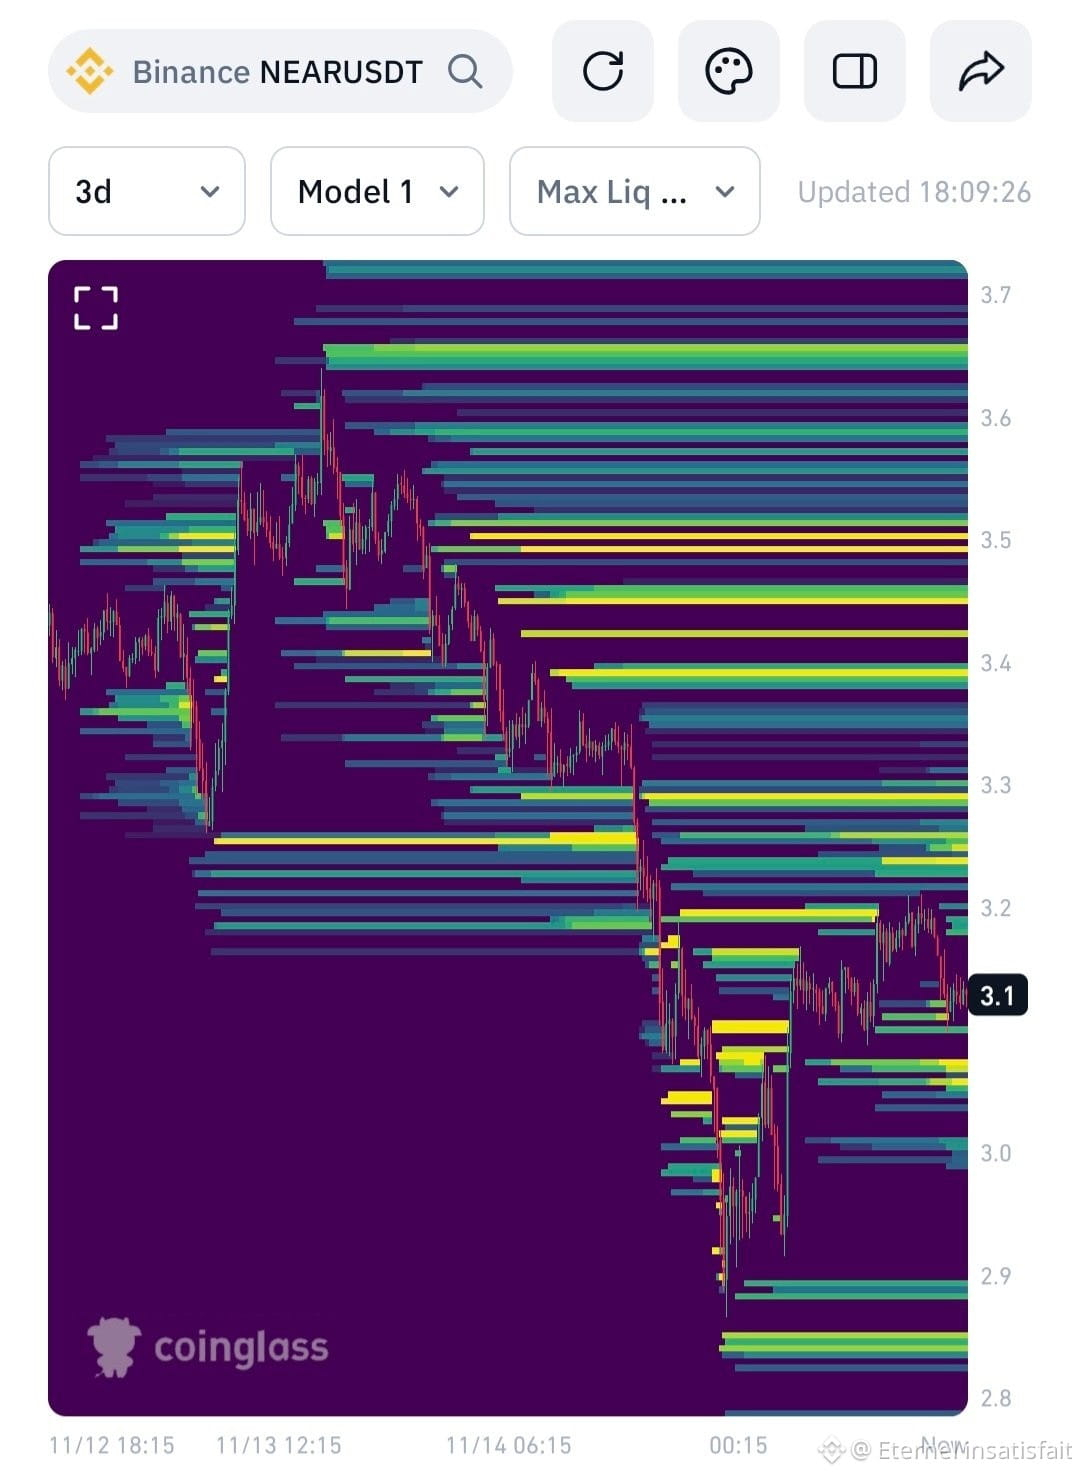
🎯 $NEAR heatmap: the biggest magnet is overhead
Four clusters line up at $3.2, $3.3, $3.4 and $3.5.
Under price, liquidity waits at $2.9 and $2.8.
My call: a squeeze toward $3.3 to $3.4 before any real drop.
A break of $2.8 cancels the plan.
Which side gets hunted first? ⬆️ or ⬇️
#NEAR #NEARProtocol #Liquidations #Crypto
🎯 $NEAR heatmap: the biggest magnet is overhead
Four clusters line up at $3.2, $3.3, $3.4 and $3.5.
Under price, liquidity waits at $2.9 and $2.8.
My call: a squeeze toward $3.3 to $3.4 before any real drop.
A break of $2.8 cancels the plan.
Which side gets hunted first? ⬆️ or ⬇️
#NEAR #NEARProtocol #Liquidations #Crypto
Four clusters line up at $3.2, $3.3, $3.4 and $3.5.
Under price, liquidity waits at $2.9 and $2.8.
My call: a squeeze toward $3.3 to $3.4 before any real drop.
A break of $2.8 cancels the plan.
Which side gets hunted first? ⬆️ or ⬇️
#NEAR #NEARProtocol #Liquidations #Crypto
4
3.1k

·
--
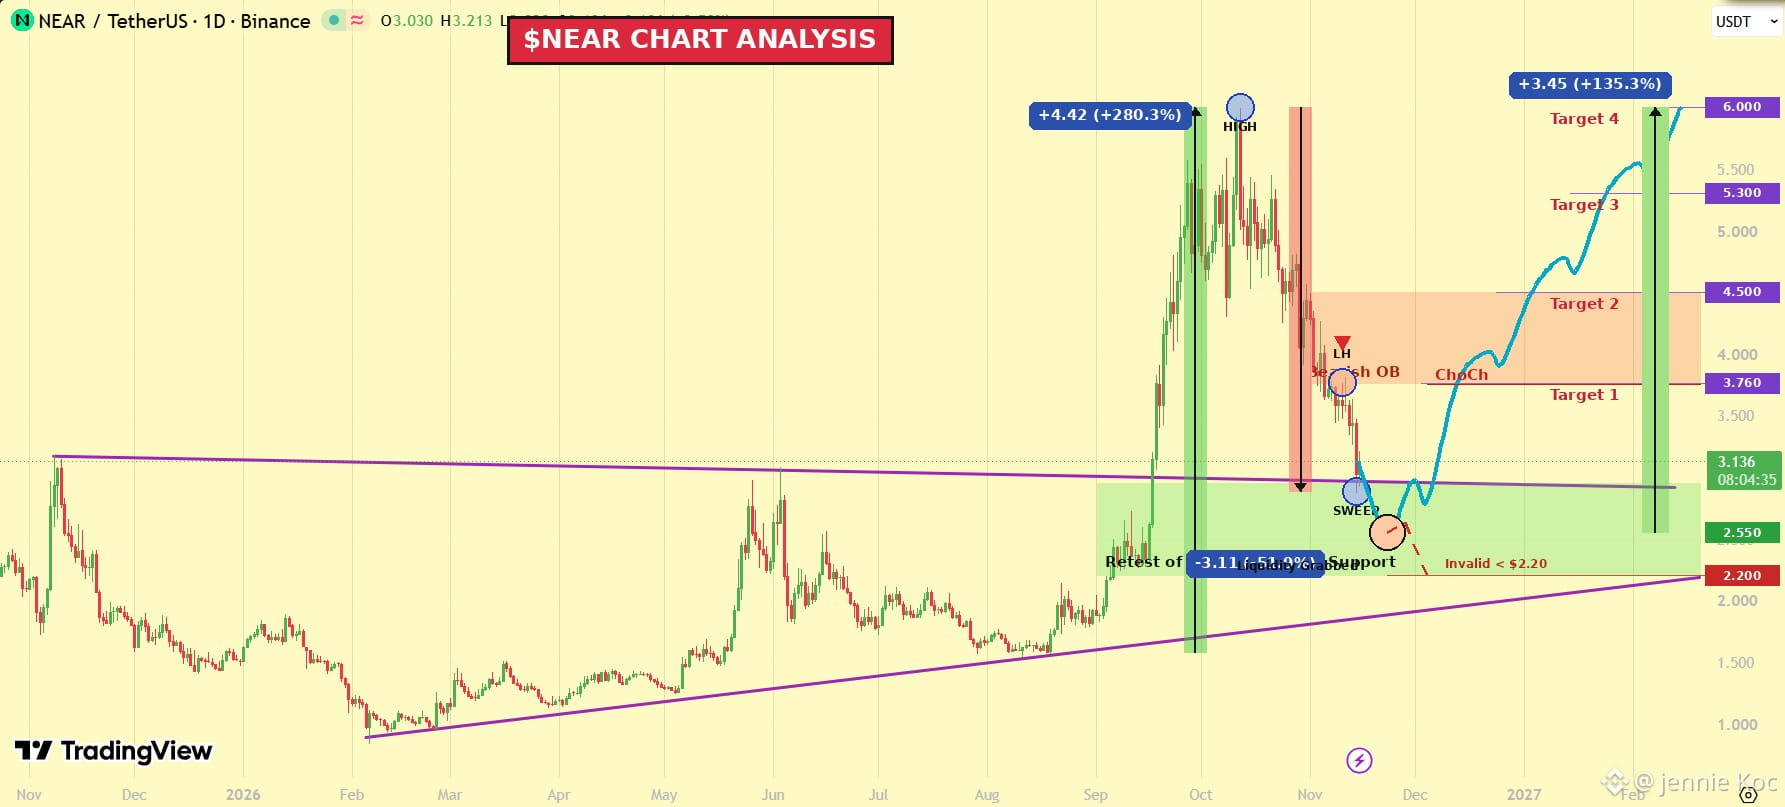
🚨 $NEAR is back at the exact line it broke out from, and this is the test
It ripped 280.3% from the September low, then gave back 51.9% from the top.
Price has now returned to the old breakout line and wicked below it.
My plan: one last sweep to $2.55, then a daily reclaim of $3.76.
Targets from the sweep: $3.76 (+47.5%), $4.50 (+76.5%), $5.30 (+107.8%) and $6.00 (+135.3%).
The $3.76 to $4.50 zone is the supply to beat first.
A daily close below $2.20, the rising trendline, kills the setup.
Does the breakout line hold, yes or no? 👇
#NEAR #NEARProtocol #TechnicalAnalysis #Crypto
{future}(NEARUSDT)
🚨 $NEAR is back at the exact line it broke out from, and this is the test
It ripped 280.3% from the September low, then gave back 51.9% from the top.
Price has now returned to the old breakout line and wicked below it.
My plan: one last sweep to $2.55, then a daily reclaim of $3.76.
Targets from the sweep: $3.76 (+47.5%), $4.50 (+76.5%), $5.30 (+107.8%) and $6.00 (+135.3%).
The $3.76 to $4.50 zone is the supply to beat first.
A daily close below $2.20, the rising trendline, kills the setup.
Does the breakout line hold, yes or no? 👇
#NEAR #NEARProtocol #TechnicalAnalysis #Crypto
It ripped 280.3% from the September low, then gave back 51.9% from the top.
Price has now returned to the old breakout line and wicked below it.
My plan: one last sweep to $2.55, then a daily reclaim of $3.76.
Targets from the sweep: $3.76 (+47.5%), $4.50 (+76.5%), $5.30 (+107.8%) and $6.00 (+135.3%).
The $3.76 to $4.50 zone is the supply to beat first.
A daily close below $2.20, the rising trendline, kills the setup.
Does the breakout line hold, yes or no? 👇
#NEAR #NEARProtocol #TechnicalAnalysis #Crypto
1
851

·
--
සත්යායනය කළ
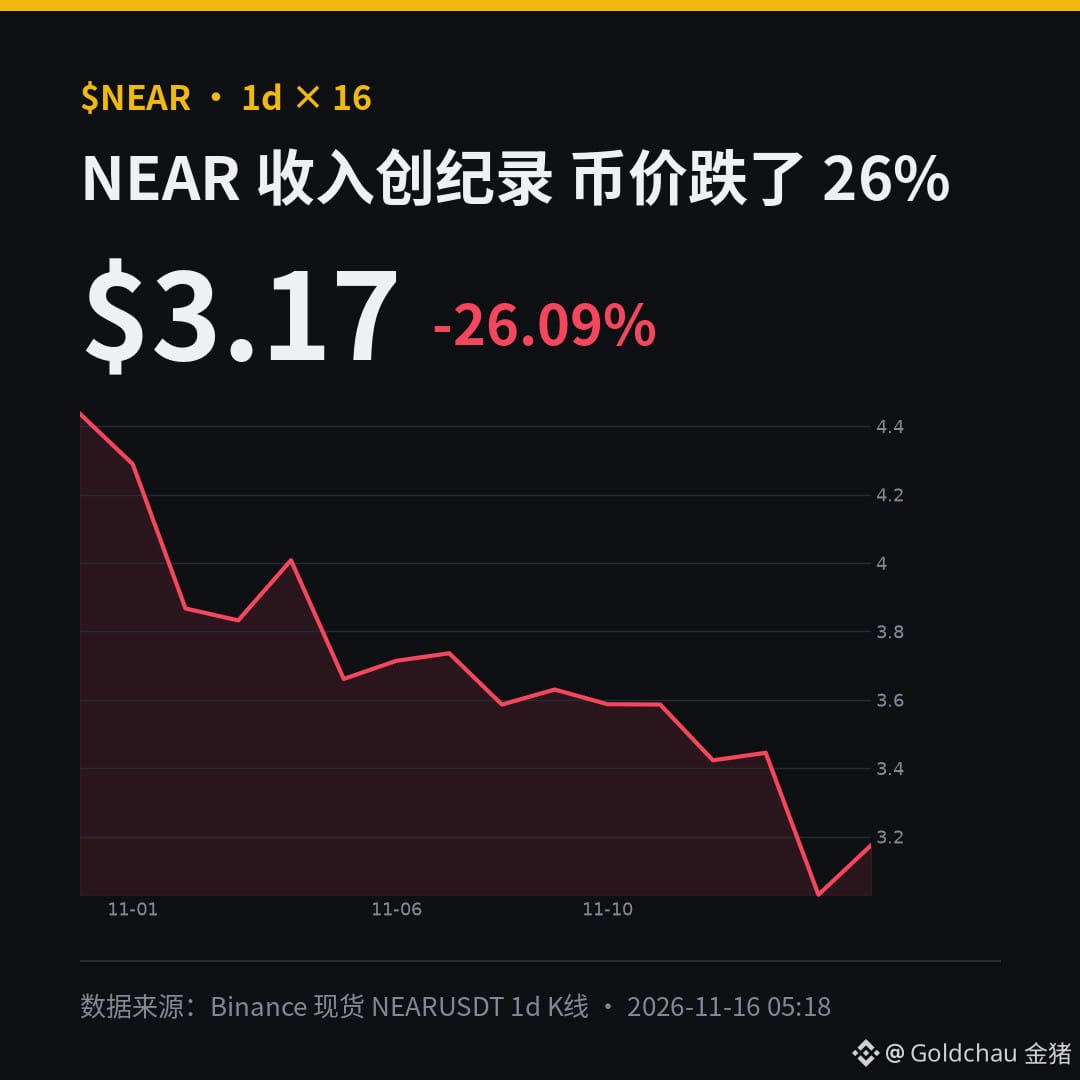
金猪判断:今天这波反弹里,我只挑有真实收入的币,$NEAR 是我会小仓偏多看的那个。
NEAR 官方说,10 月是 NEAR Intents 有史以来收入最高的一个月。DefiLlama 上 10 月收入约 219 万美元,也是它有记录以来最高的一个月。
但币价没跟上:从 10 月底的 4.3 一路跌到约 3.17,跌了约 26%。
今天反弹约 9%,是主流币里涨得最猛的之一。
我的理解是:生意在变好、价格在变便宜,这种错位才值得等。但反弹第一天不追满。
我的做法:3.1 附近小仓分批,破 11/14 低点 2.87 就走,日线站回 3.6 再加,杠杆压低。
反弹日你一般用什么标准来挑要上车的币?
#NEAR #NEARProtocol #行情分析 #山寨币 $NEAR
数据来源:NEAR 官方 X、DefiLlama、币安现货行情。仅个人观点,不构成投资建议,DYOR。
金猪判断:今天这波反弹里,我只挑有真实收入的币,$NEAR 是我会小仓偏多看的那个。
NEAR 官方说,10 月是 NEAR Intents 有史以来收入最高的一个月。DefiLlama 上 10 月收入约 219 万美元,也是它有记录以来最高的一个月。
但币价没跟上:从 10 月底的 4.3 一路跌到约 3.17,跌了约 26%。
今天反弹约 9%,是主流币里涨得最猛的之一。
我的理解是:生意在变好、价格在变便宜,这种错位才值得等。但反弹第一天不追满。
我的做法:3.1 附近小仓分批,破 11/14 低点 2.87 就走,日线站回 3.6 再加,杠杆压低。
反弹日你一般用什么标准来挑要上车的币?
#NEAR #NEARProtocol #行情分析 #山寨币 $NEAR
数据来源:NEAR 官方 X、DefiLlama、币安现货行情。仅个人观点,不构成投资建议,DYOR。
NEAR 官方说,10 月是 NEAR Intents 有史以来收入最高的一个月。DefiLlama 上 10 月收入约 219 万美元,也是它有记录以来最高的一个月。
但币价没跟上:从 10 月底的 4.3 一路跌到约 3.17,跌了约 26%。
今天反弹约 9%,是主流币里涨得最猛的之一。
我的理解是:生意在变好、价格在变便宜,这种错位才值得等。但反弹第一天不追满。
我的做法:3.1 附近小仓分批,破 11/14 低点 2.87 就走,日线站回 3.6 再加,杠杆压低。
反弹日你一般用什么标准来挑要上车的币?
#NEAR #NEARProtocol #行情分析 #山寨币 $NEAR
数据来源:NEAR 官方 X、DefiLlama、币安现货行情。仅个人观点,不构成投资建议,DYOR。
Ula Frances:
我会先看收入能不能传导到代币,不然项目吃肉,持币的闻香。NEAR 这波还得看量能续不续得上,一日猛男不算数。
2
1.3k

·
--
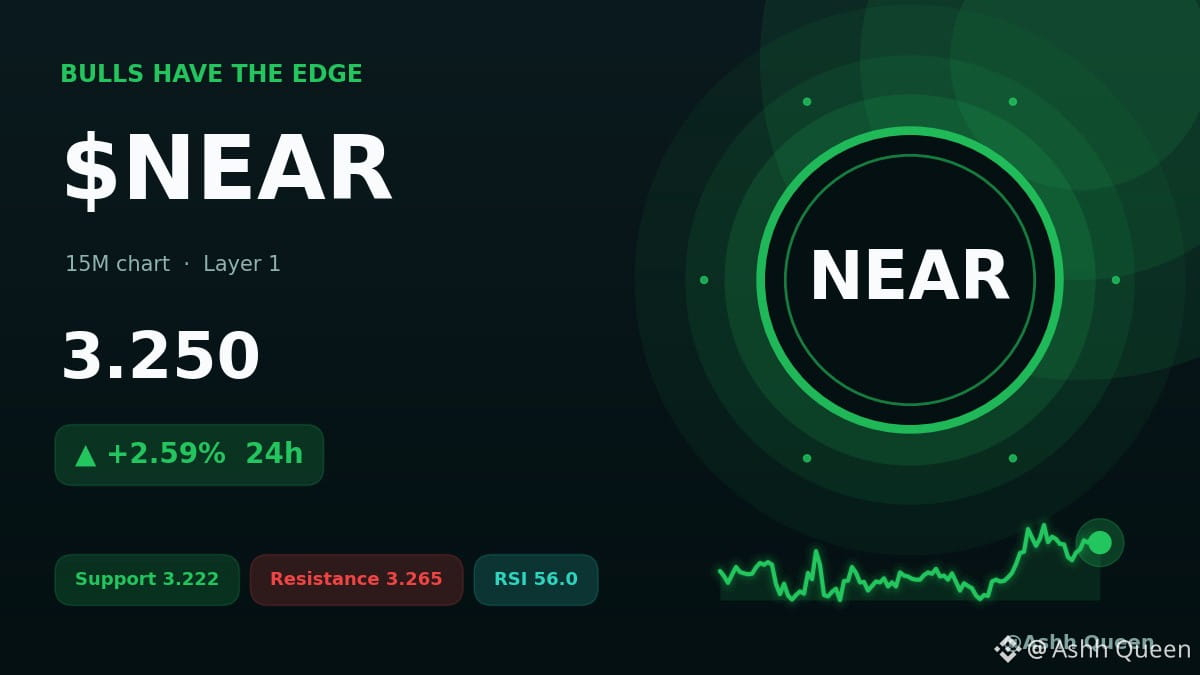
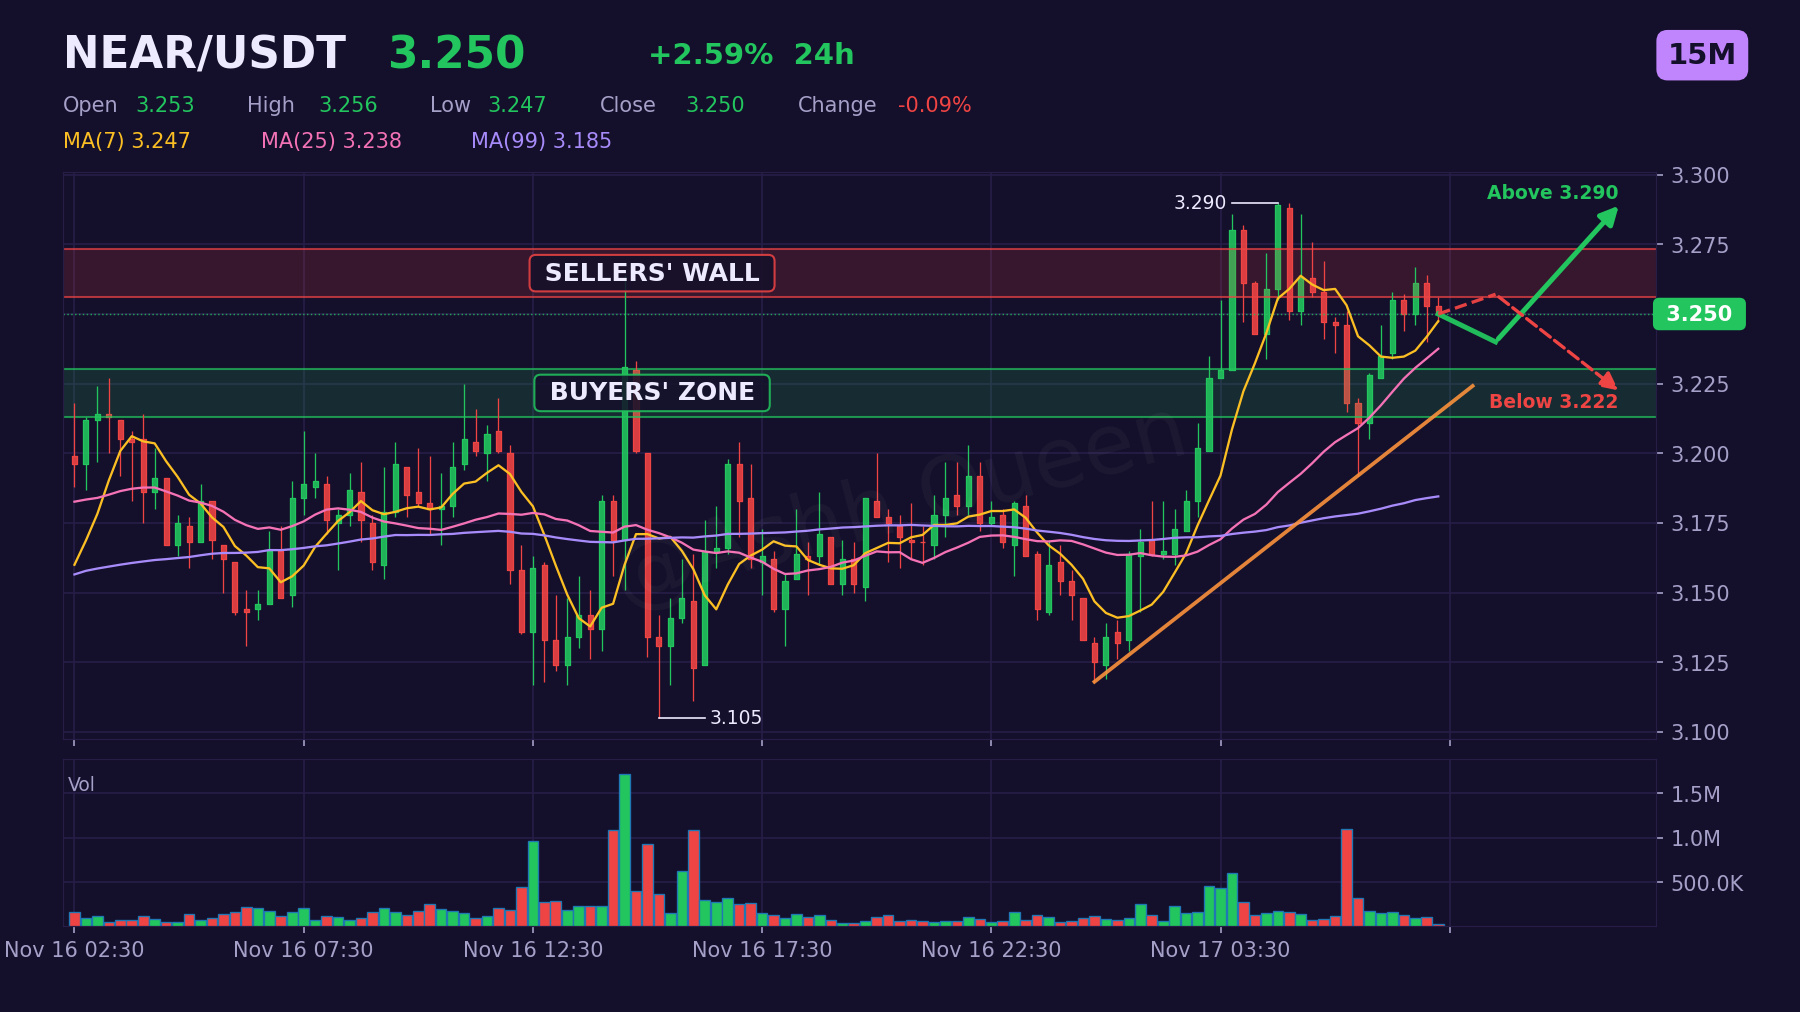
$NEAR is drifting higher, testing the patience of traders.
Bulls need a sustained push past resistance at 3.265. Bears are waiting for a dip below support at 3.222 to regain control. With RSI at 55.99, the momentum is leaning slightly positive. 🔥 ⚡
Is the current trend continuation or a trap?
#NEAR #NEARProtocol #Layer1
Personal market view, not advice. Always do your own research before any trade.
$NEAR is drifting higher, testing the patience of traders.
Bulls need a sustained push past resistance at 3.265. Bears are waiting for a dip below support at 3.222 to regain control. With RSI at 55.99, the momentum is leaning slightly positive. 🔥 ⚡
Is the current trend continuation or a trap?
#NEAR #NEARProtocol #Layer1
Personal market view, not advice. Always do your own research before any trade.
Bulls need a sustained push past resistance at 3.265. Bears are waiting for a dip below support at 3.222 to regain control. With RSI at 55.99, the momentum is leaning slightly positive. 🔥 ⚡
Is the current trend continuation or a trap?
#NEAR #NEARProtocol #Layer1
Personal market view, not advice. Always do your own research before any trade.
·
--
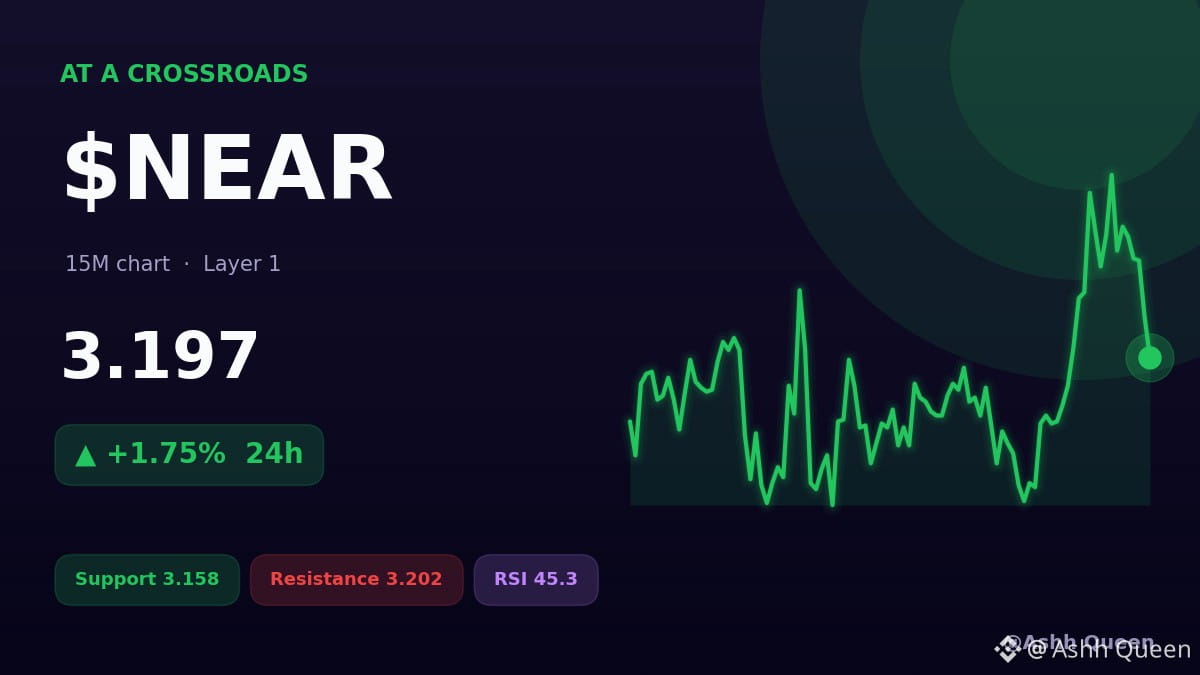
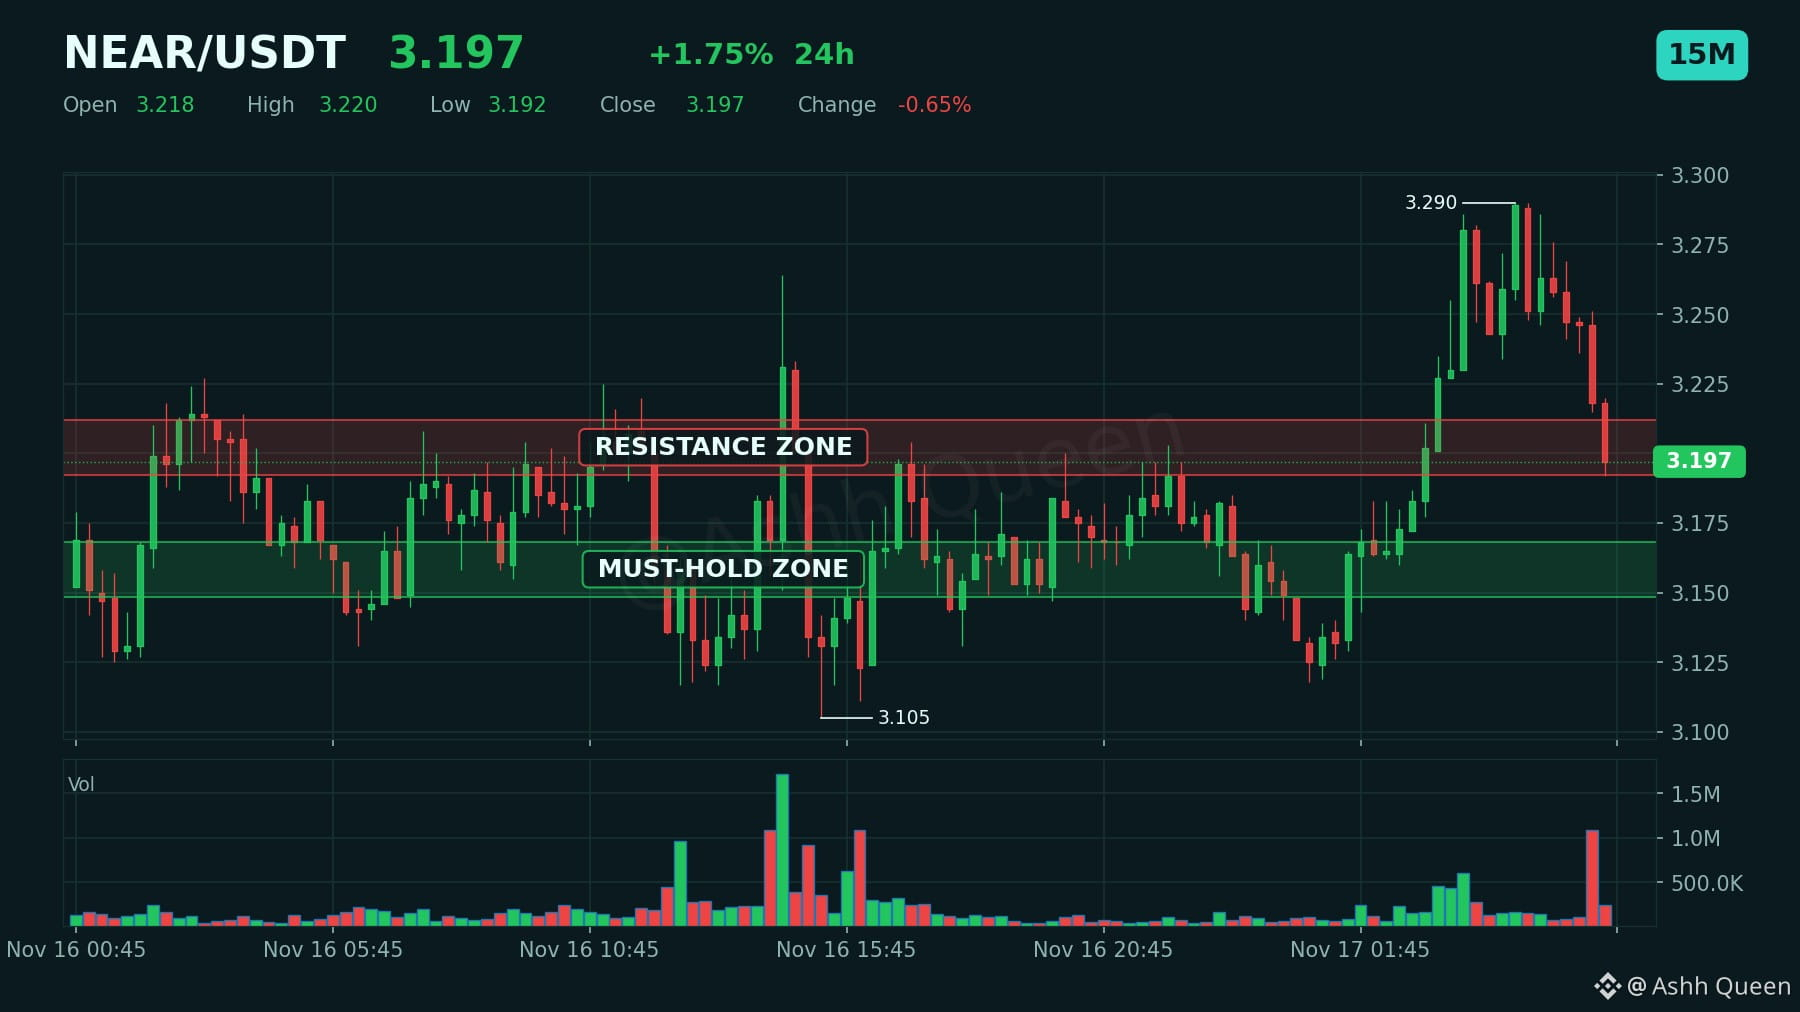
The market just shifted with a MOVE at -1.51% in the last hour for $NEAR. ⚡
Price is currently sitting at 3.197, testing the resilience of the EMA200 (3.192). With RSI at 45.33 and trading below VWAP at 3.220, the momentum leans toward caution.
If the price holds above support at 3.158, a test of resistance at 3.202 could follow. However, if that support breaks, we look toward 3.131 next. 🔥
Which of these levels are you watching on the $NEAR chart and why? 👇
#NEAR #NEARProtocol #Layer1
Not financial advice. Protect your capital first, the next setup always comes.
The market just shifted with a MOVE at -1.51% in the last hour for $NEAR . ⚡
Price is currently sitting at 3.197, testing the resilience of the EMA200 (3.192). With RSI at 45.33 and trading below VWAP at 3.220, the momentum leans toward caution.
If the price holds above support at 3.158, a test of resistance at 3.202 could follow. However, if that support breaks, we look toward 3.131 next. 🔥
Which of these levels are you watching on the $NEAR chart and why? 👇
#NEAR #NEARProtocol #Layer1
Not financial advice. Protect your capital first, the next setup always comes.
Price is currently sitting at 3.197, testing the resilience of the EMA200 (3.192). With RSI at 45.33 and trading below VWAP at 3.220, the momentum leans toward caution.
If the price holds above support at 3.158, a test of resistance at 3.202 could follow. However, if that support breaks, we look toward 3.131 next. 🔥
Which of these levels are you watching on the $NEAR chart and why? 👇
#NEAR #NEARProtocol #Layer1
Not financial advice. Protect your capital first, the next setup always comes.
2
·
--
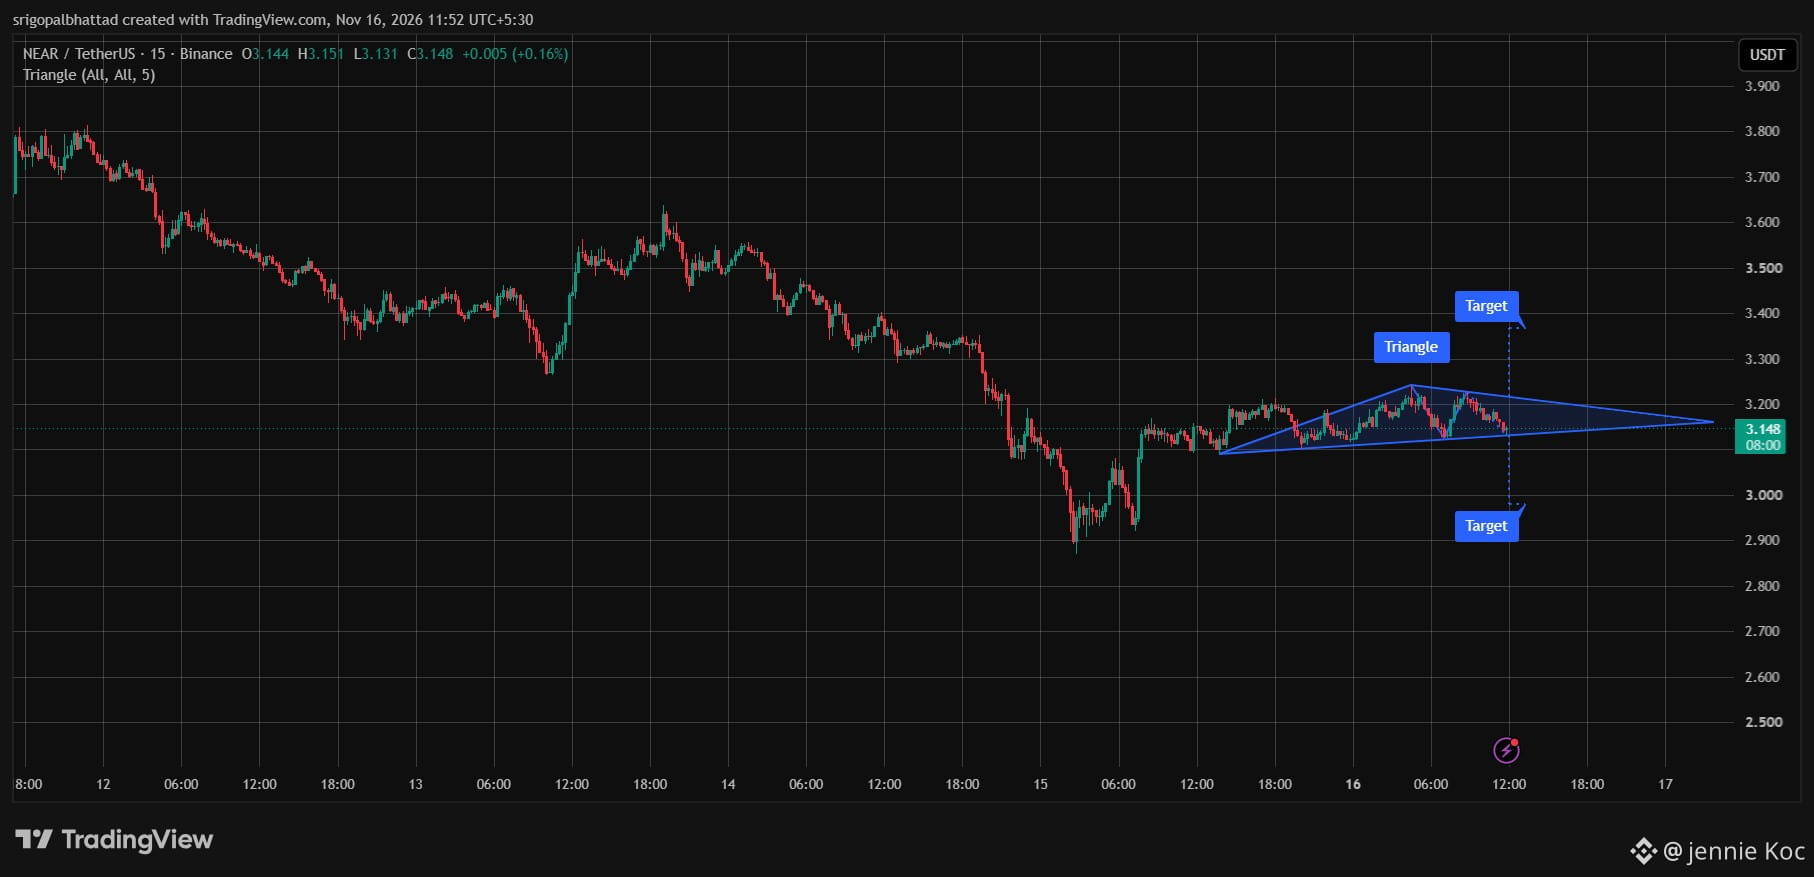
$NEAR / USDT – 15M 📈
NEAR Protocol is forming a Symmetrical Triangle pattern after bouncing from the $2.90 support zone 👀
Price is consolidating around $3.148 as resistance and support converge. A breakout above $3.25 could trigger an upside move towards the $3.40 zone, while a breakdown below $3.10 could invite further downside.
Volatility is tightening. A major move could be around the corner! ⚡
$NEAR #NEARProtocol #Crypto #Altcoins #tradingview信号源
$NEAR / USDT – 15M 📈
NEAR Protocol is forming a Symmetrical Triangle pattern after bouncing from the $2.90 support zone 👀
Price is consolidating around $3.148 as resistance and support converge. A breakout above $3.25 could trigger an upside move towards the $3.40 zone, while a breakdown below $3.10 could invite further downside.
Volatility is tightening. A major move could be around the corner! ⚡
$NEAR #NEARProtocol #Crypto #Altcoins #tradingview信号源
NEAR Protocol is forming a Symmetrical Triangle pattern after bouncing from the $2.90 support zone 👀
Price is consolidating around $3.148 as resistance and support converge. A breakout above $3.25 could trigger an upside move towards the $3.40 zone, while a breakdown below $3.10 could invite further downside.
Volatility is tightening. A major move could be around the corner! ⚡
$NEAR #NEARProtocol #Crypto #Altcoins #tradingview信号源
1
494

NEAR, UNI and ENA: Three Narratives, One Clear Lesson for the Market
The crypto market is not moving as one single story right now. NEAR, UNI, and ENA are showing three distinct structures that highlight where capital is becoming selective, where buyers are defending value, and where sellers still control the short term narrative. For traders and market observers, this is the type of environment where patience, liquidity, and confirmation matter more than excitement.
NEAR Protocol is trading around $3.176, up +0.16% from its 24 hour open of $3.171. During the same period, NEAR reached a high of $3.264 and a low of $3.105, producing a 5.12% trading range. The price is slightly above the open, which suggests that buyers are still present, but the move remains measured rather than explosive.
This is an important distinction. A token can trade positively without creating a full momentum breakout. NEAR is currently showing signs of balance, with buyers defending the lower part of the range while sellers remain active near the session high. That structure often reflects a market waiting for stronger direction from broader crypto sentiment, risk appetite, and volume expansion.
NEAR continues to attract attention because of its position in the Layer 1 ecosystem and its focus on scalable blockchain infrastructure. Market participants often watch assets like NEAR when the narrative around high performance networks, developer activity, artificial intelligence, and cross chain usability becomes more active. However, narrative strength alone is not enough to sustain price momentum. For NEAR, the key factor is whether demand can remain consistent when price tests the upper end of its current range.
Uniswap is trading around $5.161, up +0.47% from its 24 hour open of $5.137. UNI reached a high of $5.257 and a low of $5.033, creating a 4.45% daily range. Among the three assets, UNI is showing the strongest positive percentage performance in the latest session, although the difference remains modest.
UNI’s structure is relevant because it often reflects broader sentiment around decentralized finance. When market participants show growing confidence in onchain trading activity, liquidity protocols, and decentralized exchange usage, UNI can attract renewed attention. Its current position above the daily open indicates that buyers have maintained a slight advantage, but the market still needs more follow through to turn that strength into a more decisive trend.
The $5 area has remained an active zone in the latest session, with price holding above the daily low while attempting to maintain progress toward the high. This suggests that UNI is not simply moving on low liquidity. It is trading inside an area where both buyers and sellers are actively engaged. A healthy continuation would require sustained volume and an ability to hold gains rather than giving them back after short term rallies.
Ethena is trading around $0.1158, down -3.42% from its 24 hour open of $0.1199. ENA recorded a high of $0.1216 and a low of $0.1145, creating the widest range among the three assets at 6.20%. This makes ENA the most volatile asset in the group during the latest session.
ENA’s current structure shows that sellers have had the upper hand after price traded near the session high. The token is now closer to its daily low than its high, which indicates that the market has been unable to preserve early strength. This does not automatically define a long term direction, but it does show that short term sentiment is more fragile than it is for NEAR or UNI.
Ethena remains a closely watched DeFi asset because its ecosystem is connected to the fast growing conversation around synthetic dollars, stablecoin liquidity, yield mechanisms, and decentralized financial infrastructure. These narratives can drive strong attention when market conditions are favorable, but they can also increase volatility when liquidity becomes cautious. ENA’s wide daily range is a reminder that highly narrative driven assets can move rapidly in both directions.
The broader market message is clear. NEAR is showing stability with a modest positive bias. UNI is displaying slightly stronger relative momentum and holding above its daily open. ENA is experiencing more visible selling pressure and wider volatility. These are different market conditions, not a single unified trend.
For traders, the most useful approach is to monitor how each asset reacts around the edges of its current range. NEAR needs stronger participation to turn stability into momentum. UNI needs sustained demand to protect its positive move. ENA needs to demonstrate whether buyers can absorb the current selling pressure after a volatile session.
Strong markets are built through confirmation, not assumptions. Price action, volume, liquidity, and broader crypto sentiment will continue to shape the next phase for all three assets. Staying focused on the data can help traders avoid emotional decisions when volatility rises.
#NEARProtocol #Uniswap #Ethena #CryptoMarket #DeFi
$NEAR
{spot}(NEARUSDT)
$UNI
{spot}(UNIUSDT)
$ENA
{spot}(ENAUSDT)
NEAR, UNI and ENA: Three Narratives, One Clear Lesson for the Market
The crypto market is not moving as one single story right now. NEAR, UNI, and ENA are showing three distinct structures that highlight where capital is becoming selective, where buyers are defending value, and where sellers still control the short term narrative. For traders and market observers, this is the type of environment where patience, liquidity, and confirmation matter more than excitement.
NEAR Protocol is trading around $3.176, up +0.16% from its 24 hour open of $3.171. During the same period, NEAR reached a high of $3.264 and a low of $3.105, producing a 5.12% trading range. The price is slightly above the open, which suggests that buyers are still present, but the move remains measured rather than explosive.
This is an important distinction. A token can trade positively without creating a full momentum breakout. NEAR is currently showing signs of balance, with buyers defending the lower part of the range while sellers remain active near the session high. That structure often reflects a market waiting for stronger direction from broader crypto sentiment, risk appetite, and volume expansion.
NEAR continues to attract attention because of its position in the Layer 1 ecosystem and its focus on scalable blockchain infrastructure. Market participants often watch assets like NEAR when the narrative around high performance networks, developer activity, artificial intelligence, and cross chain usability becomes more active. However, narrative strength alone is not enough to sustain price momentum. For NEAR, the key factor is whether demand can remain consistent when price tests the upper end of its current range.
Uniswap is trading around $5.161, up +0.47% from its 24 hour open of $5.137. UNI reached a high of $5.257 and a low of $5.033, creating a 4.45% daily range. Among the three assets, UNI is showing the strongest positive percentage performance in the latest session, although the difference remains modest.
UNI’s structure is relevant because it often reflects broader sentiment around decentralized finance. When market participants show growing confidence in onchain trading activity, liquidity protocols, and decentralized exchange usage, UNI can attract renewed attention. Its current position above the daily open indicates that buyers have maintained a slight advantage, but the market still needs more follow through to turn that strength into a more decisive trend.
The $5 area has remained an active zone in the latest session, with price holding above the daily low while attempting to maintain progress toward the high. This suggests that UNI is not simply moving on low liquidity. It is trading inside an area where both buyers and sellers are actively engaged. A healthy continuation would require sustained volume and an ability to hold gains rather than giving them back after short term rallies.
Ethena is trading around $0.1158, down -3.42% from its 24 hour open of $0.1199. ENA recorded a high of $0.1216 and a low of $0.1145, creating the widest range among the three assets at 6.20%. This makes ENA the most volatile asset in the group during the latest session.
ENA’s current structure shows that sellers have had the upper hand after price traded near the session high. The token is now closer to its daily low than its high, which indicates that the market has been unable to preserve early strength. This does not automatically define a long term direction, but it does show that short term sentiment is more fragile than it is for NEAR or UNI.
Ethena remains a closely watched DeFi asset because its ecosystem is connected to the fast growing conversation around synthetic dollars, stablecoin liquidity, yield mechanisms, and decentralized financial infrastructure. These narratives can drive strong attention when market conditions are favorable, but they can also increase volatility when liquidity becomes cautious. ENA’s wide daily range is a reminder that highly narrative driven assets can move rapidly in both directions.
The broader market message is clear. NEAR is showing stability with a modest positive bias. UNI is displaying slightly stronger relative momentum and holding above its daily open. ENA is experiencing more visible selling pressure and wider volatility. These are different market conditions, not a single unified trend.
For traders, the most useful approach is to monitor how each asset reacts around the edges of its current range. NEAR needs stronger participation to turn stability into momentum. UNI needs sustained demand to protect its positive move. ENA needs to demonstrate whether buyers can absorb the current selling pressure after a volatile session.
Strong markets are built through confirmation, not assumptions. Price action, volume, liquidity, and broader crypto sentiment will continue to shape the next phase for all three assets. Staying focused on the data can help traders avoid emotional decisions when volatility rises.
#NEARProtocol #Uniswap #Ethena #CryptoMarket #DeFi
$NEAR
$UNI
$ENA
NEAR Protocol is trading around $3.176, up +0.16% from its 24 hour open of $3.171. During the same period, NEAR reached a high of $3.264 and a low of $3.105, producing a 5.12% trading range. The price is slightly above the open, which suggests that buyers are still present, but the move remains measured rather than explosive.
This is an important distinction. A token can trade positively without creating a full momentum breakout. NEAR is currently showing signs of balance, with buyers defending the lower part of the range while sellers remain active near the session high. That structure often reflects a market waiting for stronger direction from broader crypto sentiment, risk appetite, and volume expansion.
NEAR continues to attract attention because of its position in the Layer 1 ecosystem and its focus on scalable blockchain infrastructure. Market participants often watch assets like NEAR when the narrative around high performance networks, developer activity, artificial intelligence, and cross chain usability becomes more active. However, narrative strength alone is not enough to sustain price momentum. For NEAR, the key factor is whether demand can remain consistent when price tests the upper end of its current range.
Uniswap is trading around $5.161, up +0.47% from its 24 hour open of $5.137. UNI reached a high of $5.257 and a low of $5.033, creating a 4.45% daily range. Among the three assets, UNI is showing the strongest positive percentage performance in the latest session, although the difference remains modest.
UNI’s structure is relevant because it often reflects broader sentiment around decentralized finance. When market participants show growing confidence in onchain trading activity, liquidity protocols, and decentralized exchange usage, UNI can attract renewed attention. Its current position above the daily open indicates that buyers have maintained a slight advantage, but the market still needs more follow through to turn that strength into a more decisive trend.
The $5 area has remained an active zone in the latest session, with price holding above the daily low while attempting to maintain progress toward the high. This suggests that UNI is not simply moving on low liquidity. It is trading inside an area where both buyers and sellers are actively engaged. A healthy continuation would require sustained volume and an ability to hold gains rather than giving them back after short term rallies.
Ethena is trading around $0.1158, down -3.42% from its 24 hour open of $0.1199. ENA recorded a high of $0.1216 and a low of $0.1145, creating the widest range among the three assets at 6.20%. This makes ENA the most volatile asset in the group during the latest session.
ENA’s current structure shows that sellers have had the upper hand after price traded near the session high. The token is now closer to its daily low than its high, which indicates that the market has been unable to preserve early strength. This does not automatically define a long term direction, but it does show that short term sentiment is more fragile than it is for NEAR or UNI.
Ethena remains a closely watched DeFi asset because its ecosystem is connected to the fast growing conversation around synthetic dollars, stablecoin liquidity, yield mechanisms, and decentralized financial infrastructure. These narratives can drive strong attention when market conditions are favorable, but they can also increase volatility when liquidity becomes cautious. ENA’s wide daily range is a reminder that highly narrative driven assets can move rapidly in both directions.
The broader market message is clear. NEAR is showing stability with a modest positive bias. UNI is displaying slightly stronger relative momentum and holding above its daily open. ENA is experiencing more visible selling pressure and wider volatility. These are different market conditions, not a single unified trend.
For traders, the most useful approach is to monitor how each asset reacts around the edges of its current range. NEAR needs stronger participation to turn stability into momentum. UNI needs sustained demand to protect its positive move. ENA needs to demonstrate whether buyers can absorb the current selling pressure after a volatile session.
Strong markets are built through confirmation, not assumptions. Price action, volume, liquidity, and broader crypto sentiment will continue to shape the next phase for all three assets. Staying focused on the data can help traders avoid emotional decisions when volatility rises.
#NEARProtocol #Uniswap #Ethena #CryptoMarket #DeFi
$NEAR
$UNI
$ENA
1
18

·
--
සත්යායනය කළ
🔥 NEAR JUST APPROVED A MAJOR TOKEN SUPPLY CUT!
Latest verified updates:
- NEAR governance approved reducing maximum annual token issuance from 2.5% to 1.6%.
- The change is planned over 24 months.
- NEAR Intents also integrated with Talos, giving institutional clients access to cross-chain liquidity across 35+ networks.
- The supply change still needs further review and a validator upgrade.
Key takeaway: NEAR is advancing both token economics and institutional adoption.
$NEAR
{future}(NEARUSDT)
.
.
.
#NEAR #NEARProtocol #crypto
Not financial advice. DYOR.
🔥 NEAR JUST APPROVED A MAJOR TOKEN SUPPLY CUT!
Latest verified updates:
- NEAR governance approved reducing maximum annual token issuance from 2.5% to 1.6%.
- The change is planned over 24 months.
- NEAR Intents also integrated with Talos, giving institutional clients access to cross-chain liquidity across 35+ networks.
- The supply change still needs further review and a validator upgrade.
Key takeaway: NEAR is advancing both token economics and institutional adoption.
$NEAR
.
.
.
#NEAR #NEARProtocol #crypto
Not financial advice. DYOR.
Latest verified updates:
- NEAR governance approved reducing maximum annual token issuance from 2.5% to 1.6%.
- The change is planned over 24 months.
- NEAR Intents also integrated with Talos, giving institutional clients access to cross-chain liquidity across 35+ networks.
- The supply change still needs further review and a validator upgrade.
Key takeaway: NEAR is advancing both token economics and institutional adoption.
$NEAR
.
.
.
#NEAR #NEARProtocol #crypto
Not financial advice. DYOR.

Crypto Scientist Expert44:
i follows you sweet brothers and sisters please follows me back........plzzz follows me all sweet guyzzzz......❤️❤️😘😘🌹🌹
3
7
4.2k

·
--
NEAR/USDT — NEAR Protocol Technical Analysis
Binance Spot | 16 November 2026, 10:00 KSA
Current price: $3.165
24H change: +1.28%
24H range: $3.090–$3.242
Trend & Momentum:
NEAR retains a positive 24H performance, and its 4H recovery remains above the MA9 near $3.141. However, price is still below the 4H MA20 near $3.291. The 1H chart shows a pullback below its short-term moving averages after rejection at $3.242, leaving momentum mixed rather than decisively bullish.
Key Levels
Support: $3.152–$3.125; then $3.116–$3.090. Deeper support: $2.870.
Resistance: $3.190–$3.213; then $3.227–$3.242 and $3.291.
Bullish Scenario:
A sustained move above $3.213, followed by a breakout through $3.242, could extend the recovery toward $3.291.
Bearish Scenario:
Failure to regain $3.190–$3.213 and a breakdown below $3.125–$3.090 would weaken the recovery and increase the risk of a retest of $2.870.
Conclusion:
NEAR's 24H structure is constructive, but the latest pullback requires attention. Holding the $3.090–$3.125 support area is important to preserve the current recovery.
{spot}(NEARUSDT)
{spot}(BTCUSDT)
{spot}(ETHUSDT)
$NEAR $BTC $ETH
#NEAR #NEARProtocol #CryptoMarket #TechnicalAnalysis #TripsSam
Market analysis only; not financial advice.
NEAR/USDT — NEAR Protocol Technical Analysis
Binance Spot | 16 November 2026, 10:00 KSA
Current price: $3.165
24H change: +1.28%
24H range: $3.090–$3.242
Trend & Momentum:
NEAR retains a positive 24H performance, and its 4H recovery remains above the MA9 near $3.141. However, price is still below the 4H MA20 near $3.291. The 1H chart shows a pullback below its short-term moving averages after rejection at $3.242, leaving momentum mixed rather than decisively bullish.
Key Levels
Support: $3.152–$3.125; then $3.116–$3.090. Deeper support: $2.870.
Resistance: $3.190–$3.213; then $3.227–$3.242 and $3.291.
Bullish Scenario:
A sustained move above $3.213, followed by a breakout through $3.242, could extend the recovery toward $3.291.
Bearish Scenario:
Failure to regain $3.190–$3.213 and a breakdown below $3.125–$3.090 would weaken the recovery and increase the risk of a retest of $2.870.
Conclusion:
NEAR's 24H structure is constructive, but the latest pullback requires attention. Holding the $3.090–$3.125 support area is important to preserve the current recovery.
$NEAR $BTC $ETH
#NEAR #NEARProtocol #CryptoMarket #TechnicalAnalysis #TripsSam
Market analysis only; not financial advice.
Binance Spot | 16 November 2026, 10:00 KSA
Current price: $3.165
24H change: +1.28%
24H range: $3.090–$3.242
Trend & Momentum:
NEAR retains a positive 24H performance, and its 4H recovery remains above the MA9 near $3.141. However, price is still below the 4H MA20 near $3.291. The 1H chart shows a pullback below its short-term moving averages after rejection at $3.242, leaving momentum mixed rather than decisively bullish.
Key Levels
Support: $3.152–$3.125; then $3.116–$3.090. Deeper support: $2.870.
Resistance: $3.190–$3.213; then $3.227–$3.242 and $3.291.
Bullish Scenario:
A sustained move above $3.213, followed by a breakout through $3.242, could extend the recovery toward $3.291.
Bearish Scenario:
Failure to regain $3.190–$3.213 and a breakdown below $3.125–$3.090 would weaken the recovery and increase the risk of a retest of $2.870.
Conclusion:
NEAR's 24H structure is constructive, but the latest pullback requires attention. Holding the $3.090–$3.125 support area is important to preserve the current recovery.
$NEAR $BTC $ETH
#NEAR #NEARProtocol #CryptoMarket #TechnicalAnalysis #TripsSam
Market analysis only; not financial advice.
157
·
--
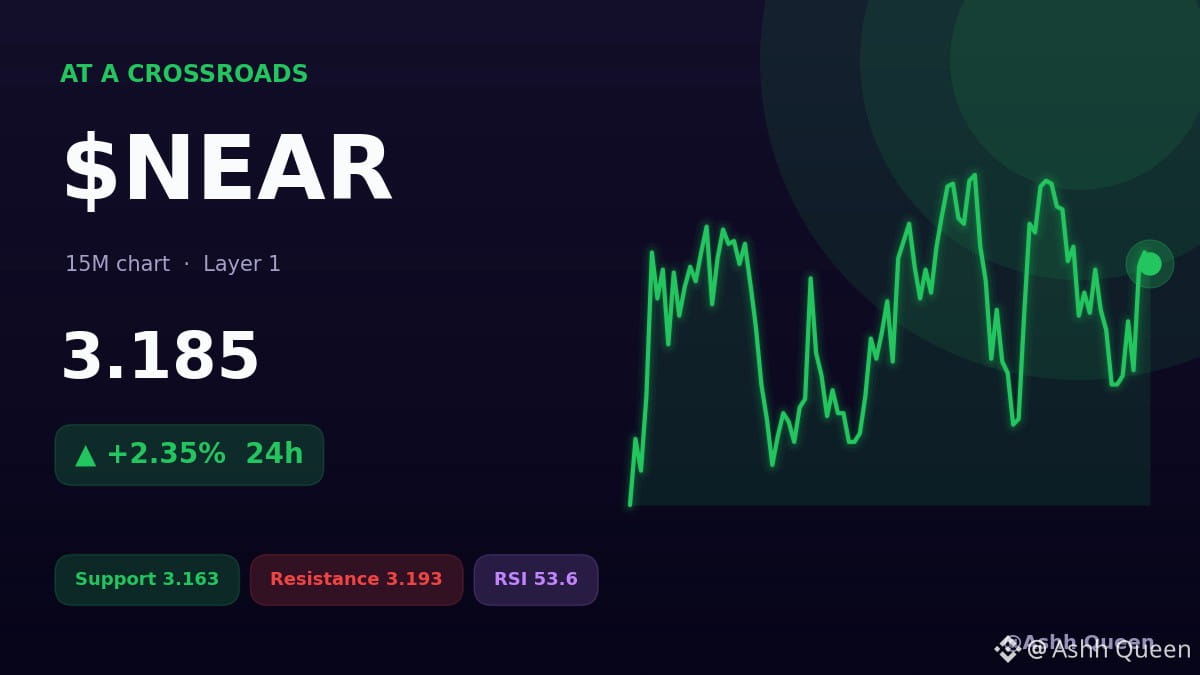
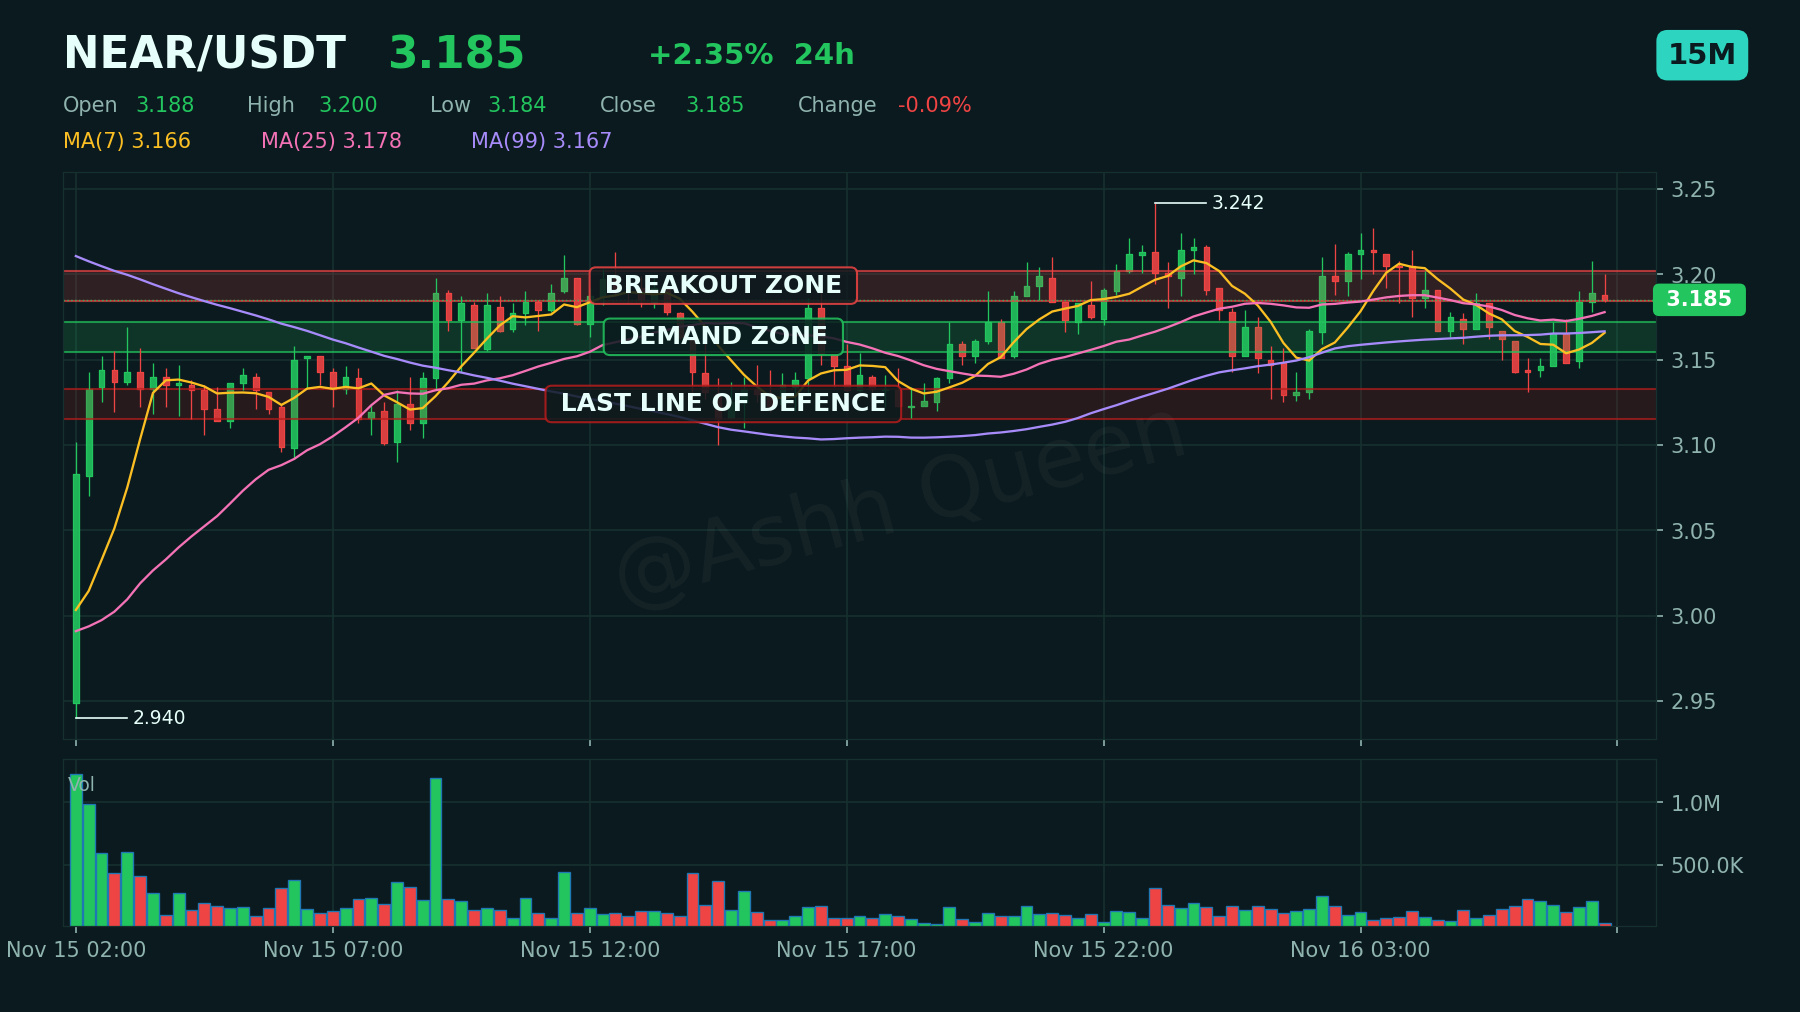
Is $NEAR trapped in a range or preparing to break? ⚡
Despite the positive MACD and price at 3.185 sitting above VWAP at 3.171, it remains below the EMA200 at 3.204.
With RSI at 53.64, the move stays moderate. If it clears resistance at 3.193, expect a shift. 🔥
What would change your mind about this current read?
#NEAR #NEARProtocol #Altcoins
DYOR. Size positions carefully and never trade with money you cannot afford to lose.
Is $NEAR trapped in a range or preparing to break? ⚡
Despite the positive MACD and price at 3.185 sitting above VWAP at 3.171, it remains below the EMA200 at 3.204.
With RSI at 53.64, the move stays moderate. If it clears resistance at 3.193, expect a shift. 🔥
What would change your mind about this current read?
#NEAR #NEARProtocol #Altcoins
DYOR. Size positions carefully and never trade with money you cannot afford to lose.
Despite the positive MACD and price at 3.185 sitting above VWAP at 3.171, it remains below the EMA200 at 3.204.
With RSI at 53.64, the move stays moderate. If it clears resistance at 3.193, expect a shift. 🔥
What would change your mind about this current read?
#NEAR #NEARProtocol #Altcoins
DYOR. Size positions carefully and never trade with money you cannot afford to lose.
28
·
--
ලිපිය
STOP its time to BULL Navigating the bearish momentum currently surrounding NEAR price action🤑🤑
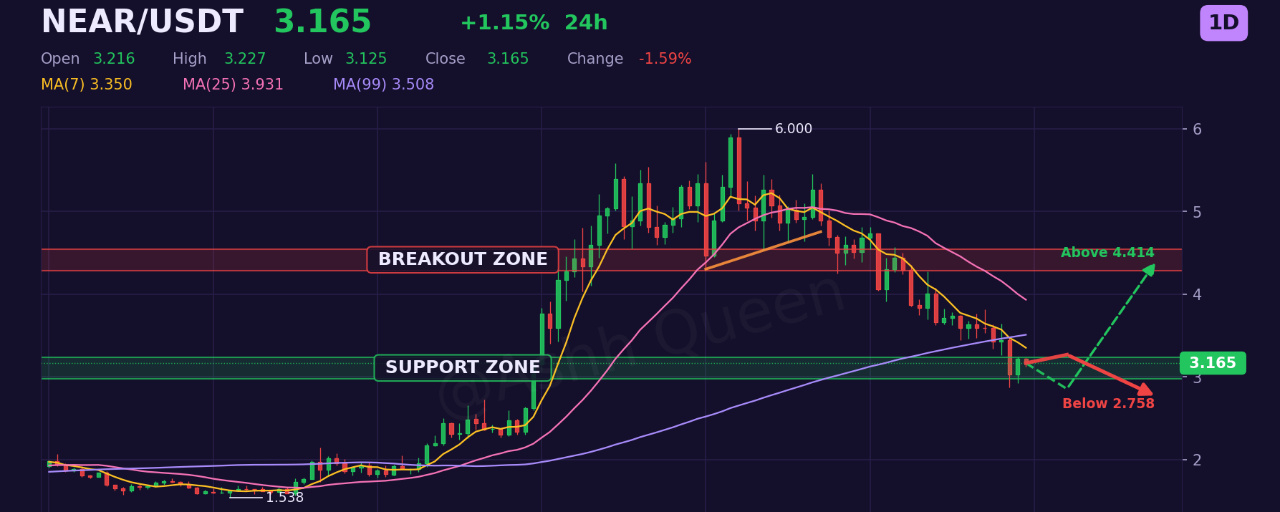
The current market environment for $NEAR is characterized by a delicate balancing act, as the asset trades at 3.165. With participants closely monitoring the interplay between recent technical benchmarks and broader sentiment, the price action reflects a period of consolidation where directionality remains a primary concern for the market. By examining the structural integrity of the chart across multiple timeframes, we can better understand the forces currently shaping the trajectory of NEAR.
On the daily timeframe, the asset currently sits above the daily EMA200 at 3.013, yet it remains constrained by the daily EMA50 at 3.960, maintaining a bearish bias that is mirrored by the daily RSI at 34.34. The four-hour chart, which presents a bearish bias with a four-hour RSI at 39.49, highlights the importance of the four-hour support at 2.343 in sustaining the current level. Meanwhile, the one-hour timeframe exhibits a neutral bias with a one-hour RSI at 49.03. Throughout this article, we will synthesize these technical indicators to evaluate potential scenarios, focusing on how NEAR behaves relative to key resistance levels like the one-hour resistance at 3.228 and established support zones.
📊 The Big Picture: NEAR on the Daily Chart
On the daily timeframe, the structure for NEAR reveals a persistent bearish bias as the price at 3.165 struggles to regain momentum against key structural hurdles. Most notably, the asset currently sits below the daily EMA50 at 3.960, signaling that the intermediate trend remains under downward pressure. While the price at 3.165 continues to hold above the daily EMA200 at 3.013, acting as a critical long-term floor, the overall technical posture is defined by a lack of sustained buying interest, further underscored by the current daily RSI at 34.34.
For patient market participants, the daily VWAP at 3.172 serves as an immediate point of interest. A failure to reclaim this level suggests that sellers maintain control over the current range. With the daily support at 3.107 nearby, the market is approaching a zone where historical volatility, measured by the daily ATR at 0.3646, often dictates the next directional shift. The current MACD status, which is not positive, reinforces the notion that the prevailing trend is still consolidating in a corrective phase. Traders often view this structure as a period of observation, waiting to see if NEAR can stabilize above the daily EMA200 at 3.013 or if the broader daily resistance at 4.414 will remain unreachable in the near term.
⏱️ Four-Hour Structure and Momentum
On the four-hour timeframe, NEAR displays a structure defined by a mild bearish bias, as the price at 3.165 continues to trade below significant dynamic barriers. The position relative to the moving averages is particularly telling, with the asset currently navigating beneath the four-hour EMA50 at 3.454 and the four-hour EMA200 at 3.996. Being situated below these indicators often suggests that sellers maintain a degree of control over the intermediate trend, as these levels frequently act as technical ceilings during periods of consolidation. Furthermore, the price remains below the four-hour VWAP at 3.184, reinforcing the current lack of immediate upward momentum.
When looking at volatility and oscillator behavior, the RSI at 39.49 sits in a neutral state, neither pointing toward extreme exhaustion nor immediate strength. This suggests a period of wait-and-see market sentiment. The Bollinger Bands, defined by the four-hour upper band at 3.597 and the four-hour lower band at 2.959, provide a range that the current price action is respecting. If the price were to deviate from these levels, it would indicate a shift in the current environment. For those monitoring structure, the four-hour resistance at 3.440 remains a key area to watch, while the four-hour support at 2.343 serves as a reference point for where the current bearish phase might encounter defensive interest. How these levels interact with the ongoing price movement will likely dictate the next phase of the four-hour cycle.
🧭 The One-Hour Map: Levels That Matter Today
On the one-hour timeframe, NEAR currently navigates a consolidation phase where market participants are closely monitoring the interaction between price and key liquidity markers. With the current one-hour price at 3.165, the asset finds itself hovering near the PIVOT at 3.126, which remains a critical junction for intraday directional shifts. Traders often look to the VWAP at 3.176 as a primary gauge of average value; since price is currently trading below this mark, it suggests that short-term sellers maintain a slight degree of control.
The technical landscape is further defined by the EMA50 at 3.207 and the more distant EMA200 at 3.457, both of which represent significant overhead hurdles that need to be reclaimed to alter the current neutral bias. Meanwhile, the RSI at 49.03 sits at a neutral level, indicating that momentum is neither overextended nor significantly oversold. Volatility, measured by the ATR at 0.0573, remains constrained, which often precedes a breakout attempt. If the asset finds stability, market watchers will likely look toward the RESISTANCE at 3.228 for signs of exhaustion, while any renewed weakness could bring the SUPPORT at 3.095 into focus as a potential area of interest for re-evaluating the prevailing sentiment.
📈 What the Derivatives Market Is Saying
When evaluating the current health of NEAR beyond raw price action, the derivatives market offers a nuanced perspective on participant sentiment. With the +1.15% move over the last day, we observe a market that remains cautious despite recent fluctuations. The current funding rate at +0.0075% suggests that market participants are maintaining a slightly optimistic stance, yet the overall structure keeps them grounded. Meanwhile, the open interest, currently standing at 50,496,456, indicates a notable level of engagement from traders who are actively positioning themselves around these levels.
This crowd positioning often reflects a wait-and-see approach, where the balance between long and short interest creates a steady environment. When open interest remains consistent while price tests critical zones, it often implies that traders are waiting for a definitive breakout or breakdown to confirm the next directional bias. While these metrics provide insight into leverage and sentiment, they should be viewed as one piece of a larger puzzle, as market dynamics can shift quickly based on broader liquidity flows. Observing how these figures evolve alongside the 4h and 1d support levels will be essential for those tracking the market's internal temperature.
🎯 Scenario Playbook: Bull, Base and Bear Cases
In navigating the current landscape for NEAR, we must evaluate three potential paths that depend on how price interacts with key liquidity zones.
The bull scenario assumes a reversal of the prevailing bearish sentiment. For this to materialize, NEAR must demonstrate strength by breaking above the one-hour resistance at 3.228 and reclaiming the four-hour VWAP at 3.184. A sustained move clearing the four-hour resistance at 3.440 would be a primary confirmation, suggesting that the RSI at 39.49 is recovering from its current state. This path remains invalidated if the asset fails to hold above the daily pivot at 3.126.
The base case suggests a period of consolidation. If the price remains trapped between the one-hour resistance at 3.228 and the one-hour support at 3.095, we likely see a continuation of range-bound movement. In this scenario, the market respects the daily EMA200 at 3.013 while failing to reclaim the daily VWAP at 3.172. This sideways action would likely persist as long as the one-hour RSI at 49.03 holds near neutral levels.
The bear scenario focuses on further downside exposure. Should the price fall through the one-hour support at 3.095 and test the daily support at 3.107, the bearish bias on the 1d timeframe gains weight. A breach below the daily EMA200 at 3.013 would signal deeper structural weakness, potentially opening the door toward the daily support at 2.758. This scenario is confirmed if the price fails to regain the daily pivot at 3.126, indicating that the current mild bearish intensity is intensifying across broader timeframes.
🛡️ Risk Management and Account Security
Navigating NEAR during periods of heightened uncertainty requires a disciplined approach to risk management that transcends simple price observation. Because the current four-hour volatility, as measured by the four-hour ATR at 0.1239, remains a significant factor in potential market swings, positioning must account for these wider fluctuations. Sizing positions conservatively is essential; by keeping exposure small relative to total capital, participants can absorb transient noise without compromising their broader account health. Before considering any market interaction, defining the point of invalidation is a standard practice that helps prevent emotional decision-making when the price, currently at 3.165, deviates from expectations. Avoiding the allure of leverage is equally critical, as leveraged positions often amplify the impact of standard market volatility, potentially leading to unintended outcomes.
Beyond market mechanics, securing one's account is the foundation of long-term participation. Always utilize multi-layered security measures, such as two-factor authentication, to protect against unauthorized access. Enable anti-phishing codes to verify that communications are authentic, and ensure that only official, verified applications are used for monitoring or managing assets. Most importantly, maintain complete control over your private keys and recovery phrases; these should never be shared with anyone under any circumstances, as they represent the sole access to your holdings. By combining rigorous position sizing with robust digital security practices, participants are better equipped to handle the complexities of the NEAR landscape.
✅ Final Take
The current market positioning of $NEAR reveals a complex intersection of technical factors. While the 1d timeframe maintains a constructive stance above the daily EMA200 at 3.013, the broader momentum remains cautious as the 3.165 struggles to clear the 4h VWAP at 3.184. With the 1h RSI at 49.03 showing a neutral state and the price hovering near 3.165, the immediate focus shifts to whether the asset can establish a firmer base above the 1h pivot at 3.126. Should the 4h bearish bias persist, monitoring the support levels, specifically the daily support at 3.107, becomes essential for gauging the depth of the current consolidation. Given the proximity of the 1h resistance at 3.228, how do you evaluate the likelihood of a sustained recovery versus a retest of the lower support zones?
#Near #nearprotocol #BinanceSquare
DYOR. Size positions carefully and never trade with money you cannot afford to lose.
STOP its time to BULL Navigating the bearish momentum currently surrounding NEAR price action
🤑🤑
The current market environment for $NEAR is characterized by a delicate balancing act, as the asset trades at 3.165. With participants closely monitoring the interplay between recent technical benchmarks and broader sentiment, the price action reflects a period of consolidation where directionality remains a primary concern for the market. By examining the structural integrity of the chart across multiple timeframes, we can better understand the forces currently shaping the trajectory of NEAR.
On the daily timeframe, the asset currently sits above the daily EMA200 at 3.013, yet it remains constrained by the daily EMA50 at 3.960, maintaining a bearish bias that is mirrored by the daily RSI at 34.34. The four-hour chart, which presents a bearish bias with a four-hour RSI at 39.49, highlights the importance of the four-hour support at 2.343 in sustaining the current level. Meanwhile, the one-hour timeframe exhibits a neutral bias with a one-hour RSI at 49.03. Throughout this article, we will synthesize these technical indicators to evaluate potential scenarios, focusing on how NEAR behaves relative to key resistance levels like the one-hour resistance at 3.228 and established support zones.
📊 The Big Picture: NEAR on the Daily Chart
On the daily timeframe, the structure for NEAR reveals a persistent bearish bias as the price at 3.165 struggles to regain momentum against key structural hurdles. Most notably, the asset currently sits below the daily EMA50 at 3.960, signaling that the intermediate trend remains under downward pressure. While the price at 3.165 continues to hold above the daily EMA200 at 3.013, acting as a critical long-term floor, the overall technical posture is defined by a lack of sustained buying interest, further underscored by the current daily RSI at 34.34.
For patient market participants, the daily VWAP at 3.172 serves as an immediate point of interest. A failure to reclaim this level suggests that sellers maintain control over the current range. With the daily support at 3.107 nearby, the market is approaching a zone where historical volatility, measured by the daily ATR at 0.3646, often dictates the next directional shift. The current MACD status, which is not positive, reinforces the notion that the prevailing trend is still consolidating in a corrective phase. Traders often view this structure as a period of observation, waiting to see if NEAR can stabilize above the daily EMA200 at 3.013 or if the broader daily resistance at 4.414 will remain unreachable in the near term.
⏱️ Four-Hour Structure and Momentum
On the four-hour timeframe, NEAR displays a structure defined by a mild bearish bias, as the price at 3.165 continues to trade below significant dynamic barriers. The position relative to the moving averages is particularly telling, with the asset currently navigating beneath the four-hour EMA50 at 3.454 and the four-hour EMA200 at 3.996. Being situated below these indicators often suggests that sellers maintain a degree of control over the intermediate trend, as these levels frequently act as technical ceilings during periods of consolidation. Furthermore, the price remains below the four-hour VWAP at 3.184, reinforcing the current lack of immediate upward momentum.
When looking at volatility and oscillator behavior, the RSI at 39.49 sits in a neutral state, neither pointing toward extreme exhaustion nor immediate strength. This suggests a period of wait-and-see market sentiment. The Bollinger Bands, defined by the four-hour upper band at 3.597 and the four-hour lower band at 2.959, provide a range that the current price action is respecting. If the price were to deviate from these levels, it would indicate a shift in the current environment. For those monitoring structure, the four-hour resistance at 3.440 remains a key area to watch, while the four-hour support at 2.343 serves as a reference point for where the current bearish phase might encounter defensive interest. How these levels interact with the ongoing price movement will likely dictate the next phase of the four-hour cycle.
🧭 The One-Hour Map: Levels That Matter Today
On the one-hour timeframe, NEAR currently navigates a consolidation phase where market participants are closely monitoring the interaction between price and key liquidity markers. With the current one-hour price at 3.165, the asset finds itself hovering near the PIVOT at 3.126, which remains a critical junction for intraday directional shifts. Traders often look to the VWAP at 3.176 as a primary gauge of average value; since price is currently trading below this mark, it suggests that short-term sellers maintain a slight degree of control.
The technical landscape is further defined by the EMA50 at 3.207 and the more distant EMA200 at 3.457, both of which represent significant overhead hurdles that need to be reclaimed to alter the current neutral bias. Meanwhile, the RSI at 49.03 sits at a neutral level, indicating that momentum is neither overextended nor significantly oversold. Volatility, measured by the ATR at 0.0573, remains constrained, which often precedes a breakout attempt. If the asset finds stability, market watchers will likely look toward the RESISTANCE at 3.228 for signs of exhaustion, while any renewed weakness could bring the SUPPORT at 3.095 into focus as a potential area of interest for re-evaluating the prevailing sentiment.
📈 What the Derivatives Market Is Saying
When evaluating the current health of NEAR beyond raw price action, the derivatives market offers a nuanced perspective on participant sentiment. With the +1.15% move over the last day, we observe a market that remains cautious despite recent fluctuations. The current funding rate at +0.0075% suggests that market participants are maintaining a slightly optimistic stance, yet the overall structure keeps them grounded. Meanwhile, the open interest, currently standing at 50,496,456, indicates a notable level of engagement from traders who are actively positioning themselves around these levels.
This crowd positioning often reflects a wait-and-see approach, where the balance between long and short interest creates a steady environment. When open interest remains consistent while price tests critical zones, it often implies that traders are waiting for a definitive breakout or breakdown to confirm the next directional bias. While these metrics provide insight into leverage and sentiment, they should be viewed as one piece of a larger puzzle, as market dynamics can shift quickly based on broader liquidity flows. Observing how these figures evolve alongside the 4h and 1d support levels will be essential for those tracking the market's internal temperature.
🎯 Scenario Playbook: Bull, Base and Bear Cases
In navigating the current landscape for NEAR, we must evaluate three potential paths that depend on how price interacts with key liquidity zones.
The bull scenario assumes a reversal of the prevailing bearish sentiment. For this to materialize, NEAR must demonstrate strength by breaking above the one-hour resistance at 3.228 and reclaiming the four-hour VWAP at 3.184. A sustained move clearing the four-hour resistance at 3.440 would be a primary confirmation, suggesting that the RSI at 39.49 is recovering from its current state. This path remains invalidated if the asset fails to hold above the daily pivot at 3.126.
The base case suggests a period of consolidation. If the price remains trapped between the one-hour resistance at 3.228 and the one-hour support at 3.095, we likely see a continuation of range-bound movement. In this scenario, the market respects the daily EMA200 at 3.013 while failing to reclaim the daily VWAP at 3.172. This sideways action would likely persist as long as the one-hour RSI at 49.03 holds near neutral levels.
The bear scenario focuses on further downside exposure. Should the price fall through the one-hour support at 3.095 and test the daily support at 3.107, the bearish bias on the 1d timeframe gains weight. A breach below the daily EMA200 at 3.013 would signal deeper structural weakness, potentially opening the door toward the daily support at 2.758. This scenario is confirmed if the price fails to regain the daily pivot at 3.126, indicating that the current mild bearish intensity is intensifying across broader timeframes.
🛡️ Risk Management and Account Security
Navigating NEAR during periods of heightened uncertainty requires a disciplined approach to risk management that transcends simple price observation. Because the current four-hour volatility, as measured by the four-hour ATR at 0.1239, remains a significant factor in potential market swings, positioning must account for these wider fluctuations. Sizing positions conservatively is essential; by keeping exposure small relative to total capital, participants can absorb transient noise without compromising their broader account health. Before considering any market interaction, defining the point of invalidation is a standard practice that helps prevent emotional decision-making when the price, currently at 3.165, deviates from expectations. Avoiding the allure of leverage is equally critical, as leveraged positions often amplify the impact of standard market volatility, potentially leading to unintended outcomes.
Beyond market mechanics, securing one's account is the foundation of long-term participation. Always utilize multi-layered security measures, such as two-factor authentication, to protect against unauthorized access. Enable anti-phishing codes to verify that communications are authentic, and ensure that only official, verified applications are used for monitoring or managing assets. Most importantly, maintain complete control over your private keys and recovery phrases; these should never be shared with anyone under any circumstances, as they represent the sole access to your holdings. By combining rigorous position sizing with robust digital security practices, participants are better equipped to handle the complexities of the NEAR landscape.
✅ Final Take
The current market positioning of $NEAR reveals a complex intersection of technical factors. While the 1d timeframe maintains a constructive stance above the daily EMA200 at 3.013, the broader momentum remains cautious as the 3.165 struggles to clear the 4h VWAP at 3.184. With the 1h RSI at 49.03 showing a neutral state and the price hovering near 3.165, the immediate focus shifts to whether the asset can establish a firmer base above the 1h pivot at 3.126. Should the 4h bearish bias persist, monitoring the support levels, specifically the daily support at 3.107, becomes essential for gauging the depth of the current consolidation. Given the proximity of the 1h resistance at 3.228, how do you evaluate the likelihood of a sustained recovery versus a retest of the lower support zones?
#Near #nearprotocol #BinanceSquare
DYOR. Size positions carefully and never trade with money you cannot afford to lose.
The current market environment for $NEAR is characterized by a delicate balancing act, as the asset trades at 3.165. With participants closely monitoring the interplay between recent technical benchmarks and broader sentiment, the price action reflects a period of consolidation where directionality remains a primary concern for the market. By examining the structural integrity of the chart across multiple timeframes, we can better understand the forces currently shaping the trajectory of NEAR.
On the daily timeframe, the asset currently sits above the daily EMA200 at 3.013, yet it remains constrained by the daily EMA50 at 3.960, maintaining a bearish bias that is mirrored by the daily RSI at 34.34. The four-hour chart, which presents a bearish bias with a four-hour RSI at 39.49, highlights the importance of the four-hour support at 2.343 in sustaining the current level. Meanwhile, the one-hour timeframe exhibits a neutral bias with a one-hour RSI at 49.03. Throughout this article, we will synthesize these technical indicators to evaluate potential scenarios, focusing on how NEAR behaves relative to key resistance levels like the one-hour resistance at 3.228 and established support zones.
📊 The Big Picture: NEAR on the Daily Chart
On the daily timeframe, the structure for NEAR reveals a persistent bearish bias as the price at 3.165 struggles to regain momentum against key structural hurdles. Most notably, the asset currently sits below the daily EMA50 at 3.960, signaling that the intermediate trend remains under downward pressure. While the price at 3.165 continues to hold above the daily EMA200 at 3.013, acting as a critical long-term floor, the overall technical posture is defined by a lack of sustained buying interest, further underscored by the current daily RSI at 34.34.
For patient market participants, the daily VWAP at 3.172 serves as an immediate point of interest. A failure to reclaim this level suggests that sellers maintain control over the current range. With the daily support at 3.107 nearby, the market is approaching a zone where historical volatility, measured by the daily ATR at 0.3646, often dictates the next directional shift. The current MACD status, which is not positive, reinforces the notion that the prevailing trend is still consolidating in a corrective phase. Traders often view this structure as a period of observation, waiting to see if NEAR can stabilize above the daily EMA200 at 3.013 or if the broader daily resistance at 4.414 will remain unreachable in the near term.
⏱️ Four-Hour Structure and Momentum
On the four-hour timeframe, NEAR displays a structure defined by a mild bearish bias, as the price at 3.165 continues to trade below significant dynamic barriers. The position relative to the moving averages is particularly telling, with the asset currently navigating beneath the four-hour EMA50 at 3.454 and the four-hour EMA200 at 3.996. Being situated below these indicators often suggests that sellers maintain a degree of control over the intermediate trend, as these levels frequently act as technical ceilings during periods of consolidation. Furthermore, the price remains below the four-hour VWAP at 3.184, reinforcing the current lack of immediate upward momentum.
When looking at volatility and oscillator behavior, the RSI at 39.49 sits in a neutral state, neither pointing toward extreme exhaustion nor immediate strength. This suggests a period of wait-and-see market sentiment. The Bollinger Bands, defined by the four-hour upper band at 3.597 and the four-hour lower band at 2.959, provide a range that the current price action is respecting. If the price were to deviate from these levels, it would indicate a shift in the current environment. For those monitoring structure, the four-hour resistance at 3.440 remains a key area to watch, while the four-hour support at 2.343 serves as a reference point for where the current bearish phase might encounter defensive interest. How these levels interact with the ongoing price movement will likely dictate the next phase of the four-hour cycle.
🧭 The One-Hour Map: Levels That Matter Today
On the one-hour timeframe, NEAR currently navigates a consolidation phase where market participants are closely monitoring the interaction between price and key liquidity markers. With the current one-hour price at 3.165, the asset finds itself hovering near the PIVOT at 3.126, which remains a critical junction for intraday directional shifts. Traders often look to the VWAP at 3.176 as a primary gauge of average value; since price is currently trading below this mark, it suggests that short-term sellers maintain a slight degree of control.
The technical landscape is further defined by the EMA50 at 3.207 and the more distant EMA200 at 3.457, both of which represent significant overhead hurdles that need to be reclaimed to alter the current neutral bias. Meanwhile, the RSI at 49.03 sits at a neutral level, indicating that momentum is neither overextended nor significantly oversold. Volatility, measured by the ATR at 0.0573, remains constrained, which often precedes a breakout attempt. If the asset finds stability, market watchers will likely look toward the RESISTANCE at 3.228 for signs of exhaustion, while any renewed weakness could bring the SUPPORT at 3.095 into focus as a potential area of interest for re-evaluating the prevailing sentiment.
📈 What the Derivatives Market Is Saying
When evaluating the current health of NEAR beyond raw price action, the derivatives market offers a nuanced perspective on participant sentiment. With the +1.15% move over the last day, we observe a market that remains cautious despite recent fluctuations. The current funding rate at +0.0075% suggests that market participants are maintaining a slightly optimistic stance, yet the overall structure keeps them grounded. Meanwhile, the open interest, currently standing at 50,496,456, indicates a notable level of engagement from traders who are actively positioning themselves around these levels.
This crowd positioning often reflects a wait-and-see approach, where the balance between long and short interest creates a steady environment. When open interest remains consistent while price tests critical zones, it often implies that traders are waiting for a definitive breakout or breakdown to confirm the next directional bias. While these metrics provide insight into leverage and sentiment, they should be viewed as one piece of a larger puzzle, as market dynamics can shift quickly based on broader liquidity flows. Observing how these figures evolve alongside the 4h and 1d support levels will be essential for those tracking the market's internal temperature.
🎯 Scenario Playbook: Bull, Base and Bear Cases
In navigating the current landscape for NEAR, we must evaluate three potential paths that depend on how price interacts with key liquidity zones.
The bull scenario assumes a reversal of the prevailing bearish sentiment. For this to materialize, NEAR must demonstrate strength by breaking above the one-hour resistance at 3.228 and reclaiming the four-hour VWAP at 3.184. A sustained move clearing the four-hour resistance at 3.440 would be a primary confirmation, suggesting that the RSI at 39.49 is recovering from its current state. This path remains invalidated if the asset fails to hold above the daily pivot at 3.126.
The base case suggests a period of consolidation. If the price remains trapped between the one-hour resistance at 3.228 and the one-hour support at 3.095, we likely see a continuation of range-bound movement. In this scenario, the market respects the daily EMA200 at 3.013 while failing to reclaim the daily VWAP at 3.172. This sideways action would likely persist as long as the one-hour RSI at 49.03 holds near neutral levels.
The bear scenario focuses on further downside exposure. Should the price fall through the one-hour support at 3.095 and test the daily support at 3.107, the bearish bias on the 1d timeframe gains weight. A breach below the daily EMA200 at 3.013 would signal deeper structural weakness, potentially opening the door toward the daily support at 2.758. This scenario is confirmed if the price fails to regain the daily pivot at 3.126, indicating that the current mild bearish intensity is intensifying across broader timeframes.
🛡️ Risk Management and Account Security
Navigating NEAR during periods of heightened uncertainty requires a disciplined approach to risk management that transcends simple price observation. Because the current four-hour volatility, as measured by the four-hour ATR at 0.1239, remains a significant factor in potential market swings, positioning must account for these wider fluctuations. Sizing positions conservatively is essential; by keeping exposure small relative to total capital, participants can absorb transient noise without compromising their broader account health. Before considering any market interaction, defining the point of invalidation is a standard practice that helps prevent emotional decision-making when the price, currently at 3.165, deviates from expectations. Avoiding the allure of leverage is equally critical, as leveraged positions often amplify the impact of standard market volatility, potentially leading to unintended outcomes.
Beyond market mechanics, securing one's account is the foundation of long-term participation. Always utilize multi-layered security measures, such as two-factor authentication, to protect against unauthorized access. Enable anti-phishing codes to verify that communications are authentic, and ensure that only official, verified applications are used for monitoring or managing assets. Most importantly, maintain complete control over your private keys and recovery phrases; these should never be shared with anyone under any circumstances, as they represent the sole access to your holdings. By combining rigorous position sizing with robust digital security practices, participants are better equipped to handle the complexities of the NEAR landscape.
✅ Final Take
The current market positioning of $NEAR reveals a complex intersection of technical factors. While the 1d timeframe maintains a constructive stance above the daily EMA200 at 3.013, the broader momentum remains cautious as the 3.165 struggles to clear the 4h VWAP at 3.184. With the 1h RSI at 49.03 showing a neutral state and the price hovering near 3.165, the immediate focus shifts to whether the asset can establish a firmer base above the 1h pivot at 3.126. Should the 4h bearish bias persist, monitoring the support levels, specifically the daily support at 3.107, becomes essential for gauging the depth of the current consolidation. Given the proximity of the 1h resistance at 3.228, how do you evaluate the likelihood of a sustained recovery versus a retest of the lower support zones?
#Near #nearprotocol #BinanceSquare
DYOR. Size positions carefully and never trade with money you cannot afford to lose.
1
29
·
--
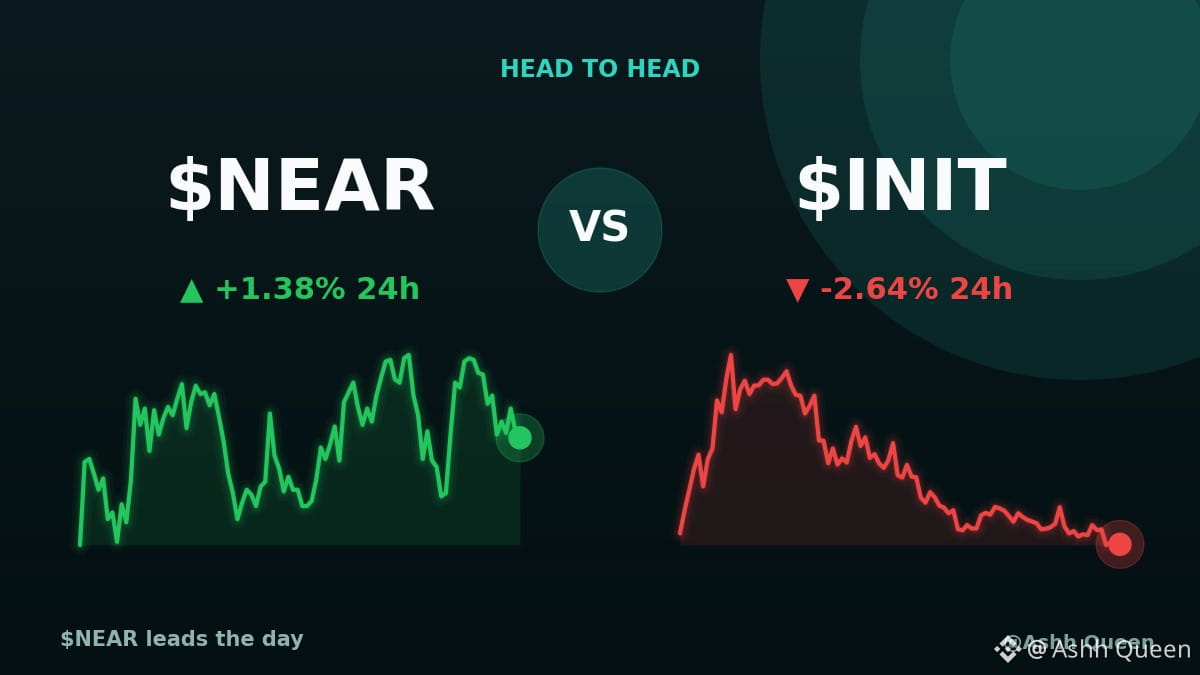
$NEAR is leading $INIT currently.
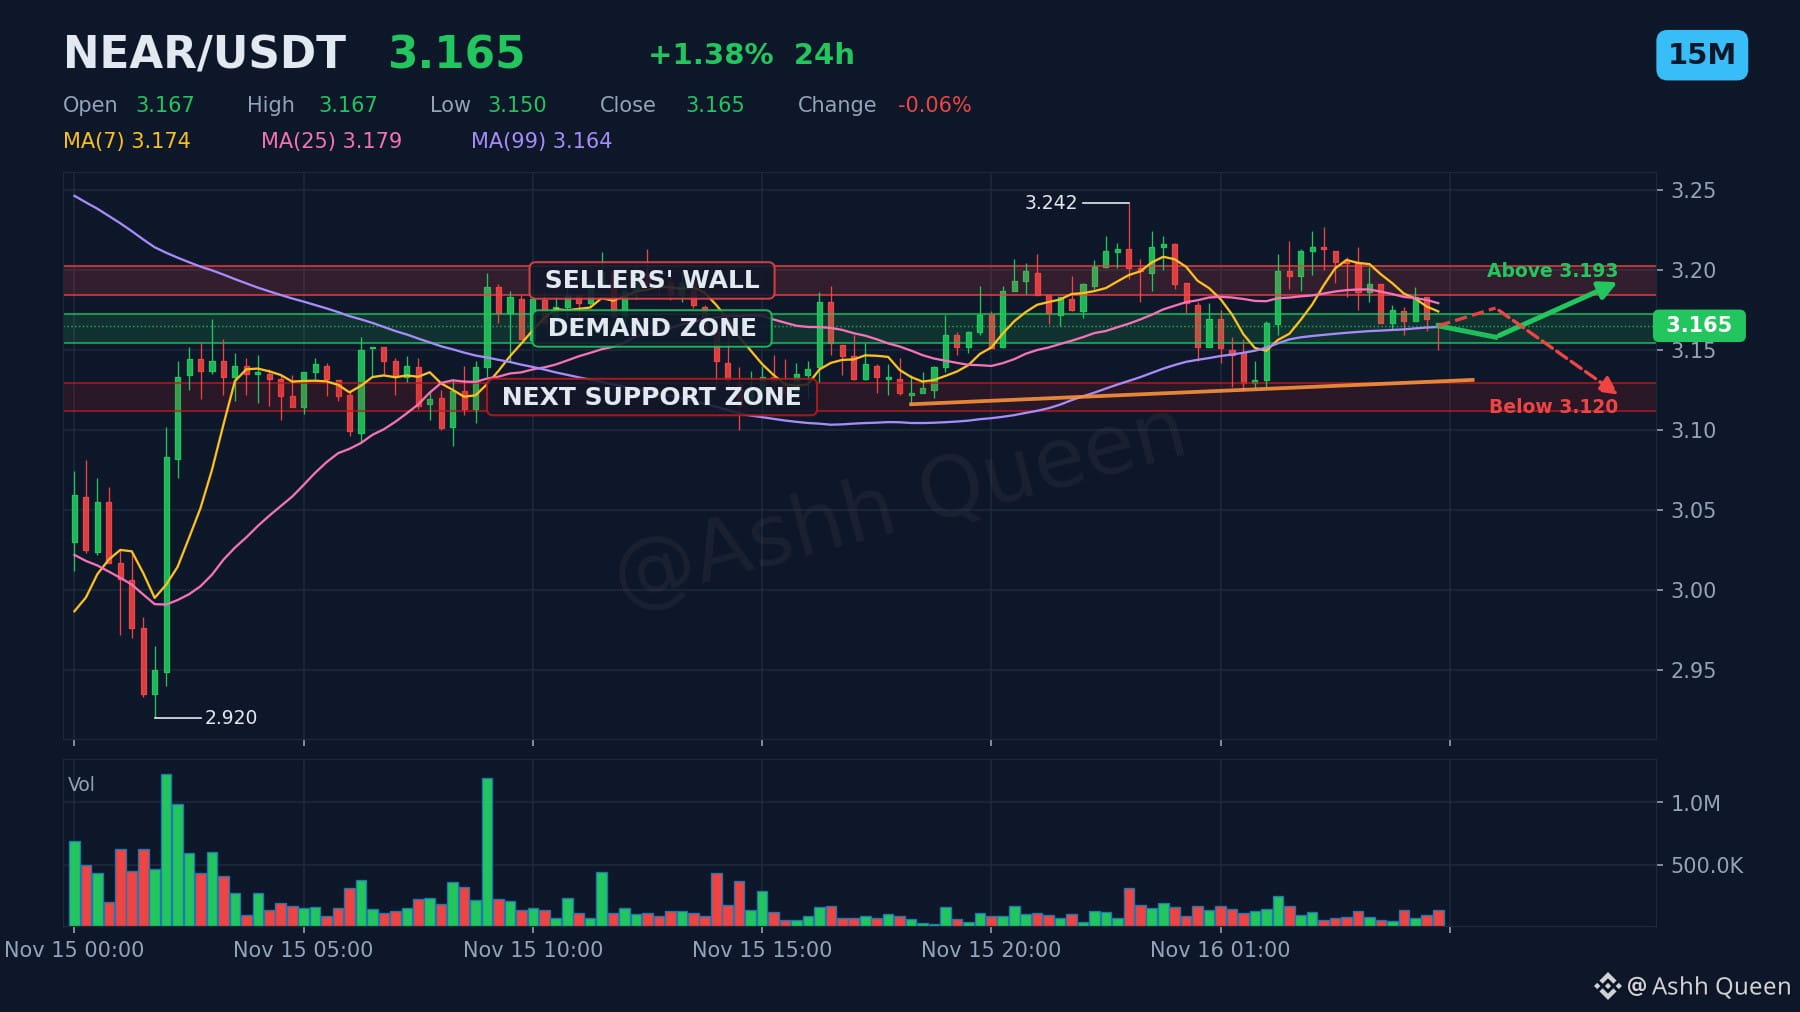
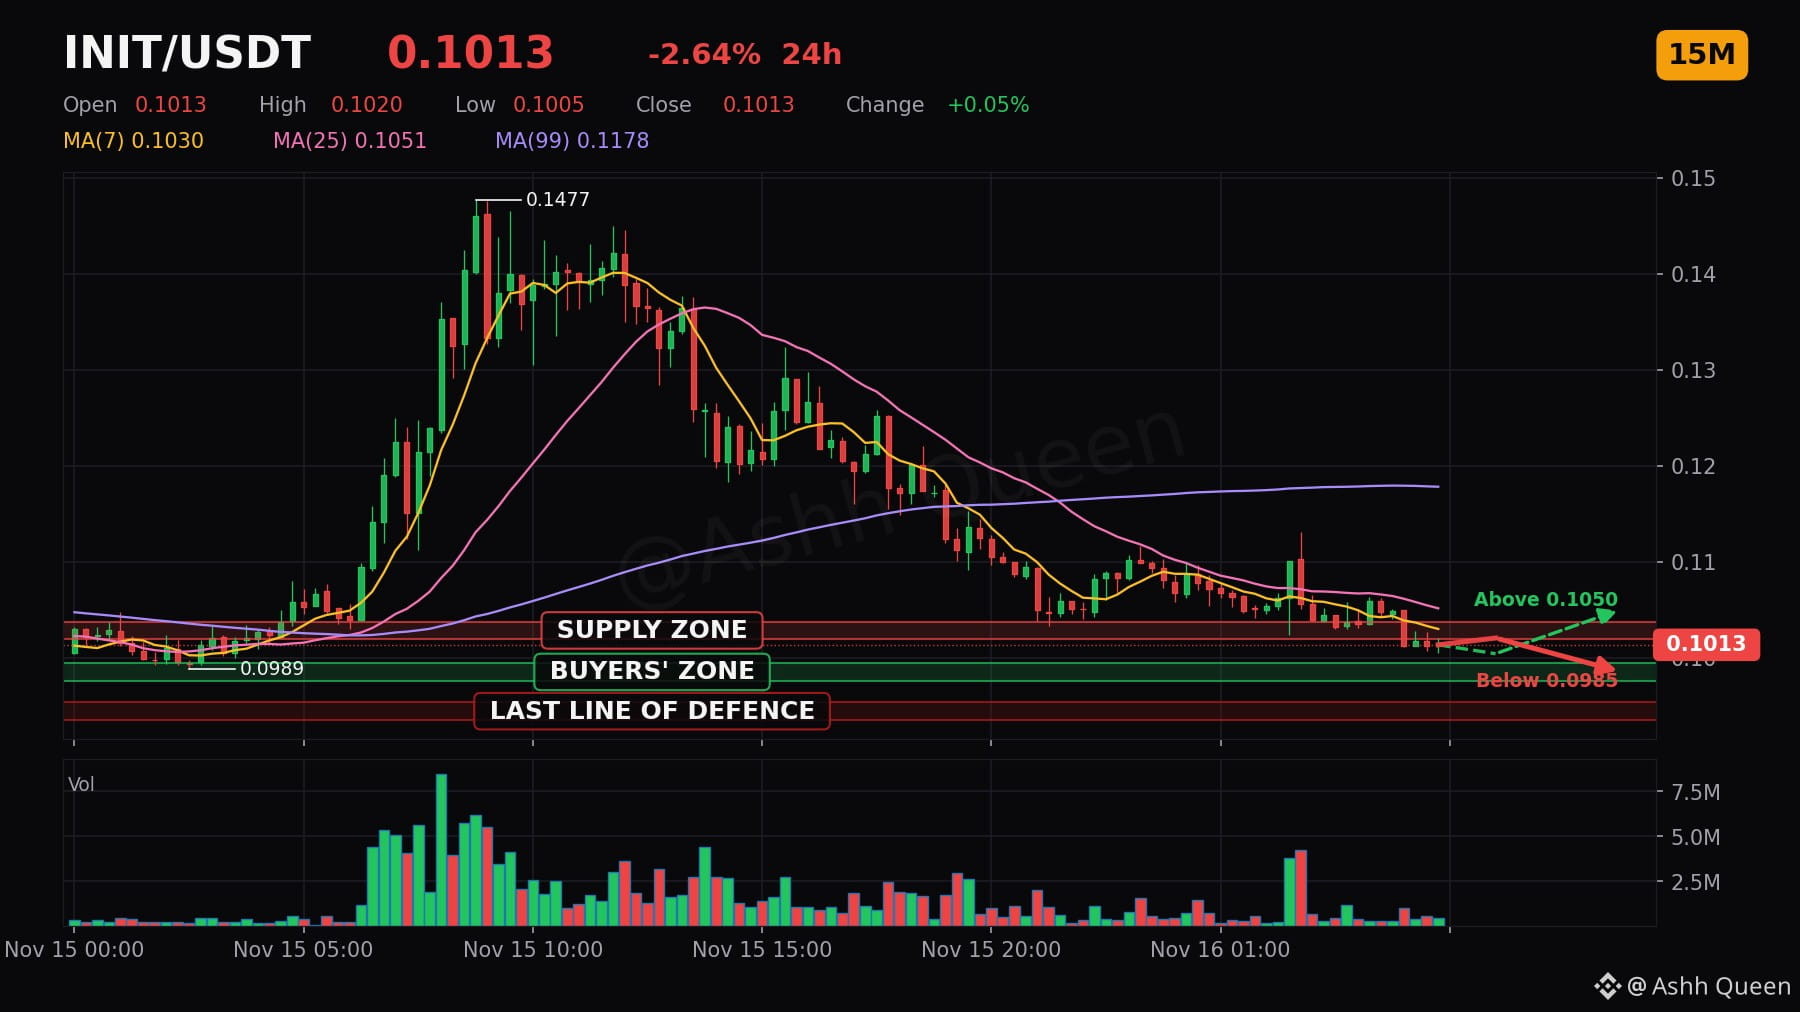
The +4.02% performance gap highlights the divergence on the 15m chart. $NEAR leans neutral at 3.165, while $INIT remains bearish at 0.1013. 📈
$NEAR flips sentiment above EMA50 (3.175), while $INIT needs to clear resistance at 0.1028. 📊
Which trend holds? Share your read and the reason why.
#NEAR #INIT #NEARProtocol #Altcoins
Not financial advice. Protect your capital first, the next setup always comes.
$NEAR is leading $INIT currently.
The +4.02% performance gap highlights the divergence on the 15m chart. $NEAR leans neutral at 3.165, while $INIT remains bearish at 0.1013. 📈
$NEAR flips sentiment above EMA50 (3.175), while $INIT needs to clear resistance at 0.1028. 📊
Which trend holds? Share your read and the reason why.
#NEAR #INIT #NEARProtocol #Altcoins
Not financial advice. Protect your capital first, the next setup always comes.
The +4.02% performance gap highlights the divergence on the 15m chart. $NEAR leans neutral at 3.165, while $INIT remains bearish at 0.1013. 📈
$NEAR flips sentiment above EMA50 (3.175), while $INIT needs to clear resistance at 0.1028. 📊
Which trend holds? Share your read and the reason why.
#NEAR #INIT #NEARProtocol #Altcoins
Not financial advice. Protect your capital first, the next setup always comes.
279

·
--
$NEAR is up 9.08% and nobody's talking about the weird part.
$69.06M traded, but that's only 0.7x its 20d average. Quiet volume. 👀
The 4h still pushed +6.2% with RSI at 42, while price sits below both the 20d and 50d MAs. That's a squeeze waking up inside a bearish chart.
Funding is already +0.010%, so longs are paying for the bounce. $XRP had this kind of quiet strength before attention arrived, but NEAR needs $3.50. I'd take some risk off there, not chase it. ⚠️
#NEARProtocol
#Layer1
$NEAR is up 9.08% and nobody's talking about the weird part.
$69.06M traded, but that's only 0.7x its 20d average. Quiet volume. 👀
The 4h still pushed +6.2% with RSI at 42, while price sits below both the 20d and 50d MAs. That's a squeeze waking up inside a bearish chart.
Funding is already +0.010%, so longs are paying for the bounce. $XRP had this kind of quiet strength before attention arrived, but NEAR needs $3.50. I'd take some risk off there, not chase it. ⚠️
#NEARProtocol
#Layer1
$69.06M traded, but that's only 0.7x its 20d average. Quiet volume. 👀
The 4h still pushed +6.2% with RSI at 42, while price sits below both the 20d and 50d MAs. That's a squeeze waking up inside a bearish chart.
Funding is already +0.010%, so longs are paying for the bounce. $XRP had this kind of quiet strength before attention arrived, but NEAR needs $3.50. I'd take some risk off there, not chase it. ⚠️
#NEARProtocol
#Layer1
10

·
--
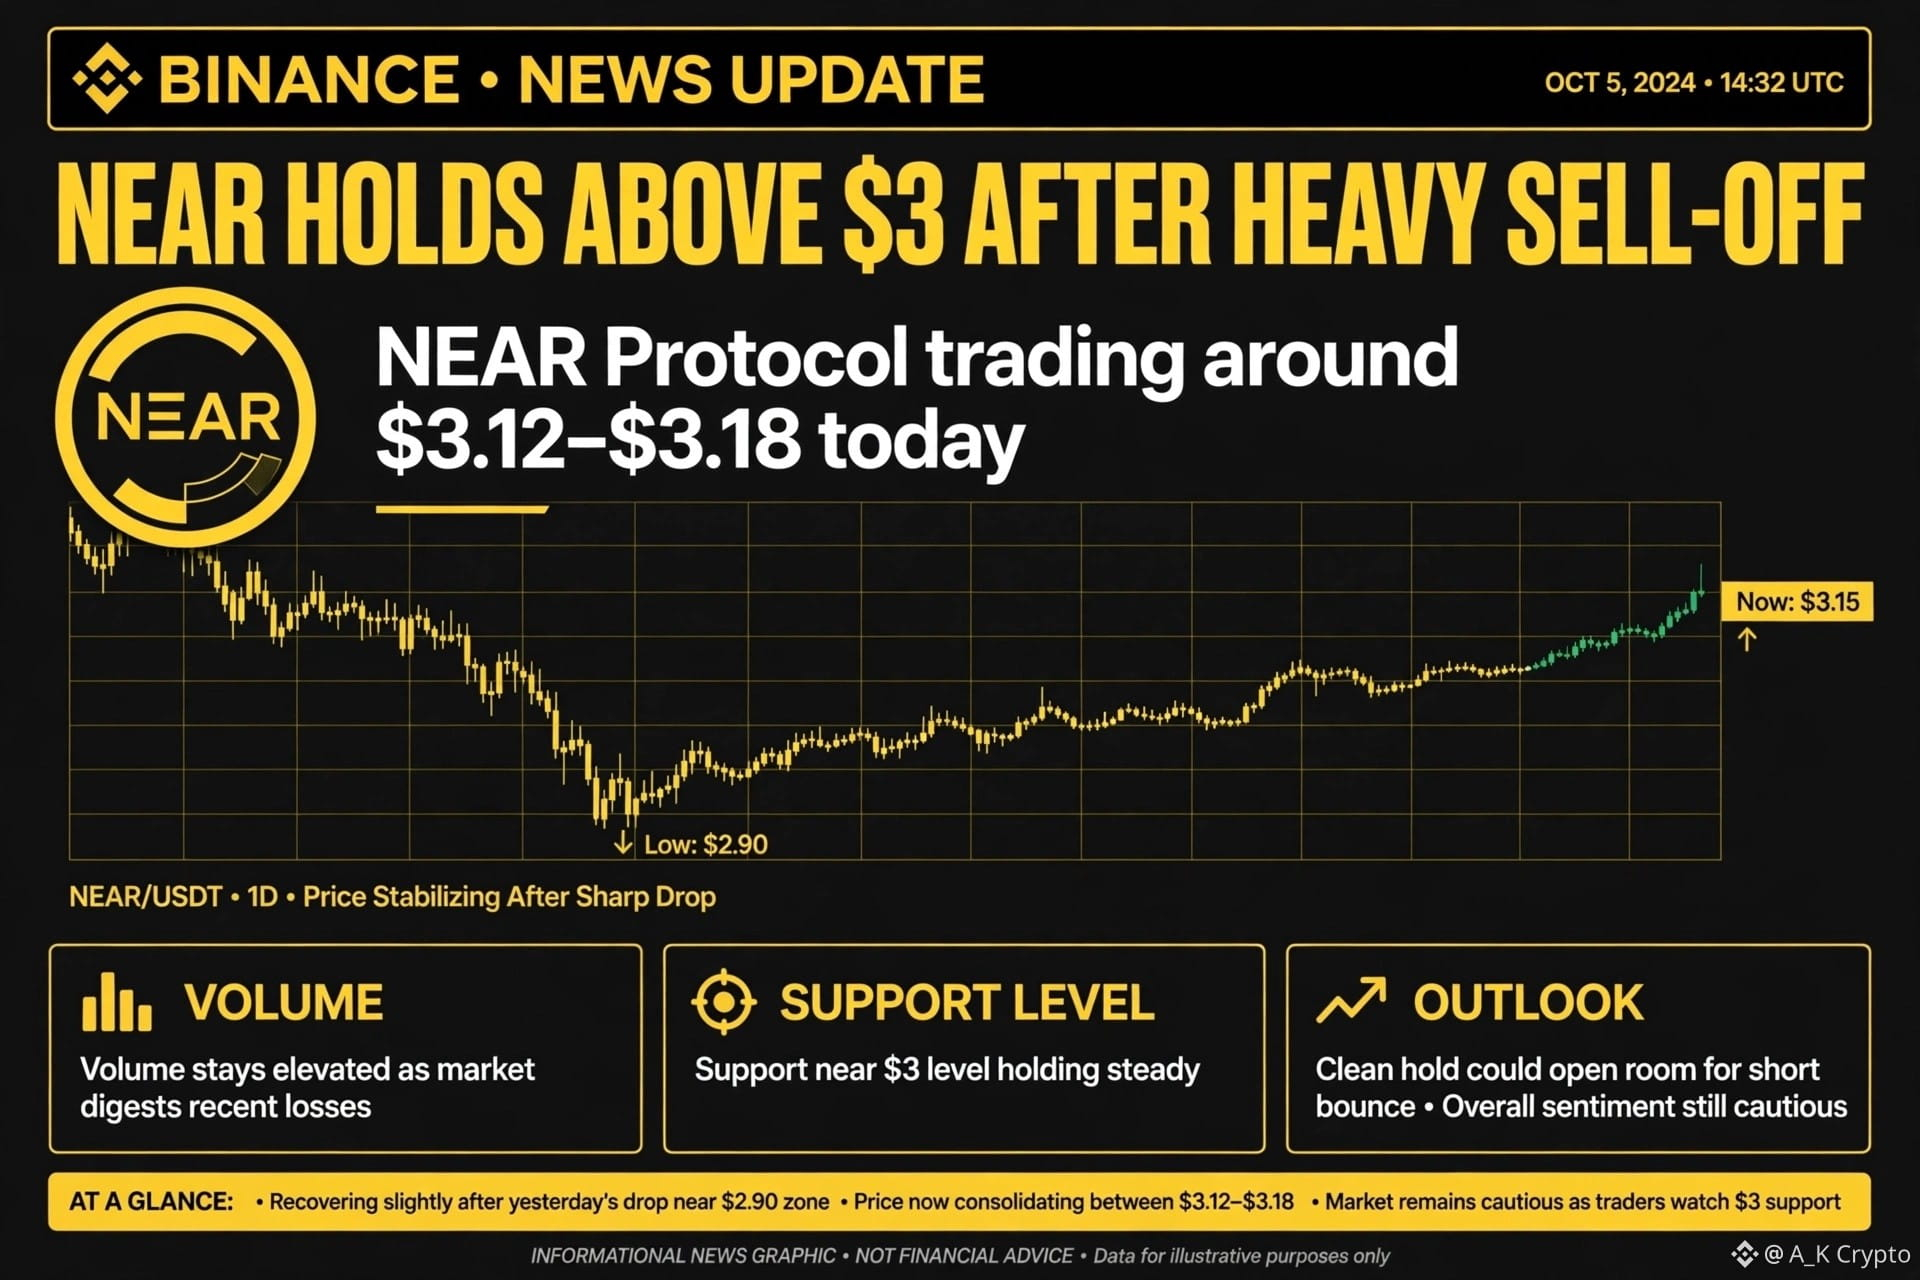
$NEAR Holds Above $3 After Heavy Sell-Off**
$NEAR Protocol is trading around $3.12–$3.18 today. After a sharp drop yesterday that pushed it near the $2.90 zone, the price is trying to stabilize and recover a little.
Volume stays elevated as the market digests the recent losses.
NEAR took a solid hit with the broader market but is finding some support near the $3 level. I’m watching this area closely. A clean hold here could open room for a short bounce, but the overall sentiment still feels cautious. Staying patient and waiting for clearer signs of strength before making any moves.
Not financial advice. Always DYOR.
$NEAR
Are you holding NEAR through this dip or looking for better entries? Drop your thoughts below.
#NEAR #NEARProtocol #CryptoMarket #BinanceSquare
{spot}(NEARUSDT)
$NEAR Holds Above $3 After Heavy Sell-Off**
$NEAR Protocol is trading around $3.12–$3.18 today. After a sharp drop yesterday that pushed it near the $2.90 zone, the price is trying to stabilize and recover a little.
Volume stays elevated as the market digests the recent losses.
NEAR took a solid hit with the broader market but is finding some support near the $3 level. I’m watching this area closely. A clean hold here could open room for a short bounce, but the overall sentiment still feels cautious. Staying patient and waiting for clearer signs of strength before making any moves.
Not financial advice. Always DYOR.
$NEAR
Are you holding NEAR through this dip or looking for better entries? Drop your thoughts below.
#NEAR #NEARProtocol #CryptoMarket #BinanceSquare
$NEAR Protocol is trading around $3.12–$3.18 today. After a sharp drop yesterday that pushed it near the $2.90 zone, the price is trying to stabilize and recover a little.
Volume stays elevated as the market digests the recent losses.
NEAR took a solid hit with the broader market but is finding some support near the $3 level. I’m watching this area closely. A clean hold here could open room for a short bounce, but the overall sentiment still feels cautious. Staying patient and waiting for clearer signs of strength before making any moves.
Not financial advice. Always DYOR.
$NEAR
Are you holding NEAR through this dip or looking for better entries? Drop your thoughts below.
#NEAR #NEARProtocol #CryptoMarket #BinanceSquare
83

·
--
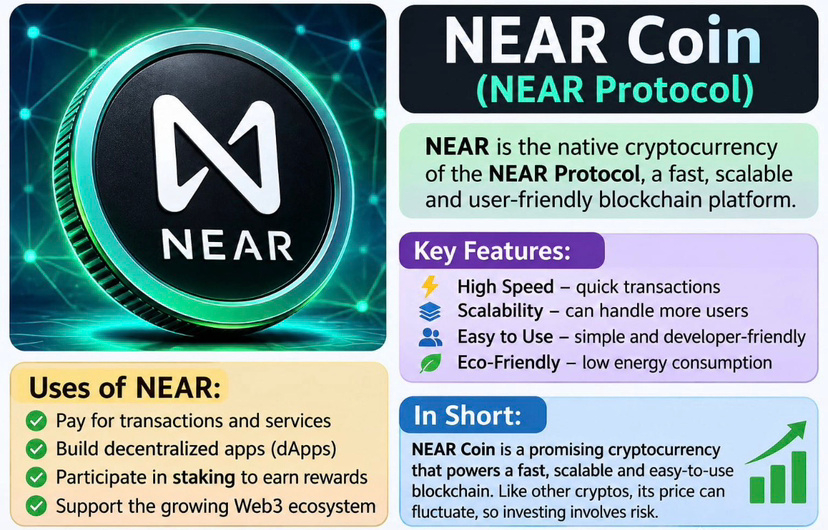
NEAR Protocol is building an exciting future for blockchain technology and the Web3 ecosystem. 🚀 With its focus on scalability, fast transactions, developer-friendly infrastructure, and energy efficiency, NEAR aims to make decentralized applications more accessible and practical. Its ecosystem supports smart contracts, staking, and innovative Web3 solutions, creating opportunities for developers and users alike. As blockchain adoption continues to evolve, NEAR is a project worth keeping on the radar. Can NEAR become a major player in the next generation of decentralized technology? What is your long-term outlook on $NEAR? Share your thoughts! 🌐
#nearprotocol #DeFi
NEAR Protocol is building an exciting future for blockchain technology and the Web3 ecosystem. 🚀 With its focus on scalability, fast transactions, developer-friendly infrastructure, and energy efficiency, NEAR aims to make decentralized applications more accessible and practical. Its ecosystem supports smart contracts, staking, and innovative Web3 solutions, creating opportunities for developers and users alike. As blockchain adoption continues to evolve, NEAR is a project worth keeping on the radar. Can NEAR become a major player in the next generation of decentralized technology? What is your long-term outlook on $NEAR? Share your thoughts! 🌐
#nearprotocol #DeFi
#nearprotocol #DeFi
1
83
NEAR, UNI and ENA: Oversold Bounces Are Emerging, but the Market Still Demands Confirmation
The current market environment is separating speculative noise from projects with real narratives, liquidity and ecosystem relevance. NEAR, UNI and ENA are all showing signs of a short term recovery attempt after heavy downside pressure, but the bigger question is whether buyers can turn these rebounds into sustained momentum.
NEAR is currently trading near $3.20, down 3.62% over the latest 24 hour spot session. Despite that spot session weakness, the daily structure shows a rebound from the recent low near $2.87. NEAR has recovered around 5.48% versus the previous daily close, which suggests that buyers are becoming more active around discounted levels.
The technical setup remains mixed. NEAR’s RSI is near 29.41, placing it in oversold territory. This means selling pressure has been intense, but it also creates conditions where a relief bounce can develop if market sentiment stabilizes. NEAR remains below its short, medium and long term moving average structure, while the SuperTrend remains bearish. The MACD is also still negative, showing that momentum has not fully shifted back in favor of buyers.
However, NEAR continues to stand out because it is more than just a short term trading token. Its long term relevance is linked to its Layer 1 ecosystem, developer activity, artificial intelligence narrative and efforts to improve blockchain usability. During risk on conditions, this type of infrastructure narrative can attract attention quickly. For now, the market needs to see stronger volume and more consistent demand before treating the current rebound as a durable recovery.
UNI is trading around $5.17, down 5.69% over the latest 24 hour spot session. The token has experienced significant volatility, but it has also bounced from the recent low near $4.62. UNI’s daily recovery of about 5.85% from the previous close shows that buyers reacted quickly after the selloff, although the broader trend still remains fragile.
UNI’s RSI is near 25.47, which also reflects deeply oversold conditions. This tells us that the market has already priced in substantial fear, but oversold readings alone are not enough to confirm a reversal. UNI remains below its key moving averages, the MACD remains bearish and the SuperTrend continues to point down. The short term rebound is visible, but the chart still needs stronger follow through before momentum can be described as constructive.
What makes UNI important is its connection to the broader decentralized finance sector. Uniswap remains one of the most recognized decentralized exchange ecosystems, and UNI often becomes a major focus when onchain trading volumes, DeFi participation and Ethereum ecosystem activity improve. Its price action can be highly sensitive to risk appetite, regulatory headlines and changes in decentralized trading activity. If DeFi interest returns, UNI has the liquidity and brand recognition to attract strong market attention. Until then, traders will likely watch whether recent buyers can defend the recovery phase.
ENA is trading near $0.1210, down 4.27% over the latest 24 hour spot session. ENA has faced the sharpest broad correction among these three assets, but it is also showing a short term recovery from the recent low around $0.1100. The daily move from the previous close is approximately 5.21%, highlighting how fast sentiment can shift when sellers become exhausted.
ENA’s RSI is near 22.56, indicating an oversold market condition. This is one of the lowest momentum readings among the three assets and suggests that the market has experienced aggressive downside pressure. Still, ENA remains below its 7 day, 25 day and 99 day moving averages. The MACD remains bearish, and the SuperTrend continues to show a downward trend. The rebound is real, but the broader structure remains vulnerable to renewed volatility.
Ethena’s narrative is closely linked to the growth of synthetic dollar products, stablecoin liquidity and DeFi yield markets. That gives ENA a different profile from NEAR and UNI. NEAR is driven by Layer 1 adoption and technology narratives. UNI is linked to decentralized exchange activity and the broader DeFi cycle. ENA is more directly exposed to stablecoin demand, protocol economics and the appetite for onchain yield strategies.
The common signal across all three assets is clear. NEAR, UNI and ENA are attempting to stabilize after substantial declines. Their RSI readings are oversold, and each asset has bounced from recent lows. At the same time, all three remain under bearish trend conditions, with negative MACD structures and downward SuperTrend signals.
This is a market where patience matters more than excitement. A one day rebound can attract attention, but sustained recovery requires stronger volume, improving capital flows and a wider improvement in crypto market sentiment. NEAR, UNI and ENA each have credible narratives, but narrative strength alone does not remove market risk.
The market is watching whether this oversold bounce becomes the beginning of accumulation or only a pause before another volatility cycle. That distinction will likely be shaped by liquidity, Bitcoin’s direction and confidence across the wider altcoin market.
#NEARProtocol #Uniswap #Ethena #CryptoMarket #DeFi
$NEAR
{spot}(NEARUSDT)
$UNI
{spot}(UNIUSDT)
$ENA
{spot}(ENAUSDT)
NEAR, UNI and ENA: Oversold Bounces Are Emerging, but the Market Still Demands Confirmation
The current market environment is separating speculative noise from projects with real narratives, liquidity and ecosystem relevance. NEAR, UNI and ENA are all showing signs of a short term recovery attempt after heavy downside pressure, but the bigger question is whether buyers can turn these rebounds into sustained momentum.
NEAR is currently trading near $3.20, down 3.62% over the latest 24 hour spot session. Despite that spot session weakness, the daily structure shows a rebound from the recent low near $2.87. NEAR has recovered around 5.48% versus the previous daily close, which suggests that buyers are becoming more active around discounted levels.
The technical setup remains mixed. NEAR’s RSI is near 29.41, placing it in oversold territory. This means selling pressure has been intense, but it also creates conditions where a relief bounce can develop if market sentiment stabilizes. NEAR remains below its short, medium and long term moving average structure, while the SuperTrend remains bearish. The MACD is also still negative, showing that momentum has not fully shifted back in favor of buyers.
However, NEAR continues to stand out because it is more than just a short term trading token. Its long term relevance is linked to its Layer 1 ecosystem, developer activity, artificial intelligence narrative and efforts to improve blockchain usability. During risk on conditions, this type of infrastructure narrative can attract attention quickly. For now, the market needs to see stronger volume and more consistent demand before treating the current rebound as a durable recovery.
UNI is trading around $5.17, down 5.69% over the latest 24 hour spot session. The token has experienced significant volatility, but it has also bounced from the recent low near $4.62. UNI’s daily recovery of about 5.85% from the previous close shows that buyers reacted quickly after the selloff, although the broader trend still remains fragile.
UNI’s RSI is near 25.47, which also reflects deeply oversold conditions. This tells us that the market has already priced in substantial fear, but oversold readings alone are not enough to confirm a reversal. UNI remains below its key moving averages, the MACD remains bearish and the SuperTrend continues to point down. The short term rebound is visible, but the chart still needs stronger follow through before momentum can be described as constructive.
What makes UNI important is its connection to the broader decentralized finance sector. Uniswap remains one of the most recognized decentralized exchange ecosystems, and UNI often becomes a major focus when onchain trading volumes, DeFi participation and Ethereum ecosystem activity improve. Its price action can be highly sensitive to risk appetite, regulatory headlines and changes in decentralized trading activity. If DeFi interest returns, UNI has the liquidity and brand recognition to attract strong market attention. Until then, traders will likely watch whether recent buyers can defend the recovery phase.
ENA is trading near $0.1210, down 4.27% over the latest 24 hour spot session. ENA has faced the sharpest broad correction among these three assets, but it is also showing a short term recovery from the recent low around $0.1100. The daily move from the previous close is approximately 5.21%, highlighting how fast sentiment can shift when sellers become exhausted.
ENA’s RSI is near 22.56, indicating an oversold market condition. This is one of the lowest momentum readings among the three assets and suggests that the market has experienced aggressive downside pressure. Still, ENA remains below its 7 day, 25 day and 99 day moving averages. The MACD remains bearish, and the SuperTrend continues to show a downward trend. The rebound is real, but the broader structure remains vulnerable to renewed volatility.
Ethena’s narrative is closely linked to the growth of synthetic dollar products, stablecoin liquidity and DeFi yield markets. That gives ENA a different profile from NEAR and UNI. NEAR is driven by Layer 1 adoption and technology narratives. UNI is linked to decentralized exchange activity and the broader DeFi cycle. ENA is more directly exposed to stablecoin demand, protocol economics and the appetite for onchain yield strategies.
The common signal across all three assets is clear. NEAR, UNI and ENA are attempting to stabilize after substantial declines. Their RSI readings are oversold, and each asset has bounced from recent lows. At the same time, all three remain under bearish trend conditions, with negative MACD structures and downward SuperTrend signals.
This is a market where patience matters more than excitement. A one day rebound can attract attention, but sustained recovery requires stronger volume, improving capital flows and a wider improvement in crypto market sentiment. NEAR, UNI and ENA each have credible narratives, but narrative strength alone does not remove market risk.
The market is watching whether this oversold bounce becomes the beginning of accumulation or only a pause before another volatility cycle. That distinction will likely be shaped by liquidity, Bitcoin’s direction and confidence across the wider altcoin market.
#NEARProtocol #Uniswap #Ethena #CryptoMarket #DeFi
$NEAR
$UNI
$ENA
NEAR is currently trading near $3.20, down 3.62% over the latest 24 hour spot session. Despite that spot session weakness, the daily structure shows a rebound from the recent low near $2.87. NEAR has recovered around 5.48% versus the previous daily close, which suggests that buyers are becoming more active around discounted levels.
The technical setup remains mixed. NEAR’s RSI is near 29.41, placing it in oversold territory. This means selling pressure has been intense, but it also creates conditions where a relief bounce can develop if market sentiment stabilizes. NEAR remains below its short, medium and long term moving average structure, while the SuperTrend remains bearish. The MACD is also still negative, showing that momentum has not fully shifted back in favor of buyers.
However, NEAR continues to stand out because it is more than just a short term trading token. Its long term relevance is linked to its Layer 1 ecosystem, developer activity, artificial intelligence narrative and efforts to improve blockchain usability. During risk on conditions, this type of infrastructure narrative can attract attention quickly. For now, the market needs to see stronger volume and more consistent demand before treating the current rebound as a durable recovery.
UNI is trading around $5.17, down 5.69% over the latest 24 hour spot session. The token has experienced significant volatility, but it has also bounced from the recent low near $4.62. UNI’s daily recovery of about 5.85% from the previous close shows that buyers reacted quickly after the selloff, although the broader trend still remains fragile.
UNI’s RSI is near 25.47, which also reflects deeply oversold conditions. This tells us that the market has already priced in substantial fear, but oversold readings alone are not enough to confirm a reversal. UNI remains below its key moving averages, the MACD remains bearish and the SuperTrend continues to point down. The short term rebound is visible, but the chart still needs stronger follow through before momentum can be described as constructive.
What makes UNI important is its connection to the broader decentralized finance sector. Uniswap remains one of the most recognized decentralized exchange ecosystems, and UNI often becomes a major focus when onchain trading volumes, DeFi participation and Ethereum ecosystem activity improve. Its price action can be highly sensitive to risk appetite, regulatory headlines and changes in decentralized trading activity. If DeFi interest returns, UNI has the liquidity and brand recognition to attract strong market attention. Until then, traders will likely watch whether recent buyers can defend the recovery phase.
ENA is trading near $0.1210, down 4.27% over the latest 24 hour spot session. ENA has faced the sharpest broad correction among these three assets, but it is also showing a short term recovery from the recent low around $0.1100. The daily move from the previous close is approximately 5.21%, highlighting how fast sentiment can shift when sellers become exhausted.
ENA’s RSI is near 22.56, indicating an oversold market condition. This is one of the lowest momentum readings among the three assets and suggests that the market has experienced aggressive downside pressure. Still, ENA remains below its 7 day, 25 day and 99 day moving averages. The MACD remains bearish, and the SuperTrend continues to show a downward trend. The rebound is real, but the broader structure remains vulnerable to renewed volatility.
Ethena’s narrative is closely linked to the growth of synthetic dollar products, stablecoin liquidity and DeFi yield markets. That gives ENA a different profile from NEAR and UNI. NEAR is driven by Layer 1 adoption and technology narratives. UNI is linked to decentralized exchange activity and the broader DeFi cycle. ENA is more directly exposed to stablecoin demand, protocol economics and the appetite for onchain yield strategies.
The common signal across all three assets is clear. NEAR, UNI and ENA are attempting to stabilize after substantial declines. Their RSI readings are oversold, and each asset has bounced from recent lows. At the same time, all three remain under bearish trend conditions, with negative MACD structures and downward SuperTrend signals.
This is a market where patience matters more than excitement. A one day rebound can attract attention, but sustained recovery requires stronger volume, improving capital flows and a wider improvement in crypto market sentiment. NEAR, UNI and ENA each have credible narratives, but narrative strength alone does not remove market risk.
The market is watching whether this oversold bounce becomes the beginning of accumulation or only a pause before another volatility cycle. That distinction will likely be shaped by liquidity, Bitcoin’s direction and confidence across the wider altcoin market.
#NEARProtocol #Uniswap #Ethena #CryptoMarket #DeFi
$NEAR
$UNI
$ENA
16

·
--
උසබ තත්ත්වය
සත්යායනය කළ
NEAR Is Expanding Beyond Layer-1… But Where Is the Real Value? 🫰🎀
✅
NEAR Protocol is positioning itself at the intersection of chain abstraction, institutional finance, and AI agents. NEAR Intents aims to simplify cross-chain transactions, while integrations like Talos could bring institutional users closer to its ecosystem.
✅
The key numbers matter: NEAR’s annual issuance ceiling is being reduced from 2.5% under HSP-029. Intents has reportedly processed tens of billions in cumulative volume, but transaction volume alone doesn’t reveal how much value flows back to the token.
✅
The reality: NEAR has strong technological catalysts, but sustainable price growth depends on actual fee generation, token demand, and adoption—not just partnerships or AI hype.
#NearProtocol #NearToken $NEAR
{spot}(NEARUSDT)
NEAR Is Expanding Beyond Layer-1… But Where Is the Real Value? 🫰🎀
✅
NEAR Protocol is positioning itself at the intersection of chain abstraction, institutional finance, and AI agents. NEAR Intents aims to simplify cross-chain transactions, while integrations like Talos could bring institutional users closer to its ecosystem.
✅
The key numbers matter: NEAR’s annual issuance ceiling is being reduced from 2.5% under HSP-029. Intents has reportedly processed tens of billions in cumulative volume, but transaction volume alone doesn’t reveal how much value flows back to the token.
✅
The reality: NEAR has strong technological catalysts, but sustainable price growth depends on actual fee generation, token demand, and adoption—not just partnerships or AI hype.
#NearProtocol #NearToken $NEAR
✅
NEAR Protocol is positioning itself at the intersection of chain abstraction, institutional finance, and AI agents. NEAR Intents aims to simplify cross-chain transactions, while integrations like Talos could bring institutional users closer to its ecosystem.
✅
The key numbers matter: NEAR’s annual issuance ceiling is being reduced from 2.5% under HSP-029. Intents has reportedly processed tens of billions in cumulative volume, but transaction volume alone doesn’t reveal how much value flows back to the token.
✅
The reality: NEAR has strong technological catalysts, but sustainable price growth depends on actual fee generation, token demand, and adoption—not just partnerships or AI hype.
#NearProtocol #NearToken $NEAR

2
1.5k

·
--
🚨 NEAR Crashes Over 11% — $3.00 Support Now Under Heavy Pressure
$NEAR Protocol is getting hammered today, sliding to around $3.09–$3.10 after dropping more than 11% in 24 hours.
Selling pressure remains intense. The daily chart is clearly bearish, with little sign of strong buying interest so far. Broader market weakness is amplifying the move as risk appetite stays low across crypto.
Key Levels to Watch:
If $3.00 fails to hold, the next leg down could accelerate quickly. Buyers need to step in with conviction to prevent further downside.
Quick Levels (NFA):
• Support: $3.00 – $3.05
• Stronger support: $2.80 – $2.85
• Resistance: $3.30 – $3.40
• Idea: Short bias while below $3.30 | TP $2.90 region | SL above $3.40
Bears are firmly in control for now. Chasing longs here carries elevated risk until we see clear signs of stabilization or a reclaim of higher levels.
Is this just another high-beta flush in a weak market, or the start of a deeper correction for NEAR? Are you staying patient or looking for entries?
Drop your bias below 👇
$NEAR
#NEAR #NEARProtocol #CryptoMarkets
🚨 NEAR Crashes Over 11% — $3.00 Support Now Under Heavy Pressure
$NEAR Protocol is getting hammered today, sliding to around $3.09–$3.10 after dropping more than 11% in 24 hours.
Selling pressure remains intense. The daily chart is clearly bearish, with little sign of strong buying interest so far. Broader market weakness is amplifying the move as risk appetite stays low across crypto.
Key Levels to Watch:
If $3.00 fails to hold, the next leg down could accelerate quickly. Buyers need to step in with conviction to prevent further downside.
Quick Levels (NFA):
• Support: $3.00 – $3.05
• Stronger support: $2.80 – $2.85
• Resistance: $3.30 – $3.40
• Idea: Short bias while below $3.30 | TP $2.90 region | SL above $3.40
Bears are firmly in control for now. Chasing longs here carries elevated risk until we see clear signs of stabilization or a reclaim of higher levels.
Is this just another high-beta flush in a weak market, or the start of a deeper correction for NEAR? Are you staying patient or looking for entries?
Drop your bias below 👇
$NEAR
#NEAR #NEARProtocol #CryptoMarkets
$NEAR Protocol is getting hammered today, sliding to around $3.09–$3.10 after dropping more than 11% in 24 hours.
Selling pressure remains intense. The daily chart is clearly bearish, with little sign of strong buying interest so far. Broader market weakness is amplifying the move as risk appetite stays low across crypto.
Key Levels to Watch:
If $3.00 fails to hold, the next leg down could accelerate quickly. Buyers need to step in with conviction to prevent further downside.
Quick Levels (NFA):
• Support: $3.00 – $3.05
• Stronger support: $2.80 – $2.85
• Resistance: $3.30 – $3.40
• Idea: Short bias while below $3.30 | TP $2.90 region | SL above $3.40
Bears are firmly in control for now. Chasing longs here carries elevated risk until we see clear signs of stabilization or a reclaim of higher levels.
Is this just another high-beta flush in a weak market, or the start of a deeper correction for NEAR? Are you staying patient or looking for entries?
Drop your bias below 👇
$NEAR
#NEAR #NEARProtocol #CryptoMarkets
3
942
·
--
$NEAR Slips Toward $3.10 as Market Pressure Continues
$NEAR Protocol is trading around $3.10–$3.20 today, down roughly 8–11% over the last 24 hours. It continues to follow the broader market lower with elevated volume and some long liquidations.
Sellers remain in control for now.
NEAR is feeling the full weight of this risk-off move. The $3.00–$3.20 zone is an important area to watch. I’m staying patient and not rushing any decisions while the overall market stays weak. Better opportunities usually come after the selling calms down.
Not financial advice. Always DYOR.
Holding NEAR through this dip or waiting for stronger support? Share your thoughts below.
$NEAR
#NEAR #NEARProtocol #CryptoMarket #BinanceSquare
{spot}(NEARUSDT)
$NEAR Slips Toward $3.10 as Market Pressure Continues
$NEAR Protocol is trading around $3.10–$3.20 today, down roughly 8–11% over the last 24 hours. It continues to follow the broader market lower with elevated volume and some long liquidations.
Sellers remain in control for now.
NEAR is feeling the full weight of this risk-off move. The $3.00–$3.20 zone is an important area to watch. I’m staying patient and not rushing any decisions while the overall market stays weak. Better opportunities usually come after the selling calms down.
Not financial advice. Always DYOR.
Holding NEAR through this dip or waiting for stronger support? Share your thoughts below.
$NEAR
#NEAR #NEARProtocol #CryptoMarket #BinanceSquare
$NEAR Protocol is trading around $3.10–$3.20 today, down roughly 8–11% over the last 24 hours. It continues to follow the broader market lower with elevated volume and some long liquidations.
Sellers remain in control for now.
NEAR is feeling the full weight of this risk-off move. The $3.00–$3.20 zone is an important area to watch. I’m staying patient and not rushing any decisions while the overall market stays weak. Better opportunities usually come after the selling calms down.
Not financial advice. Always DYOR.
Holding NEAR through this dip or waiting for stronger support? Share your thoughts below.
$NEAR
#NEAR #NEARProtocol #CryptoMarket #BinanceSquare
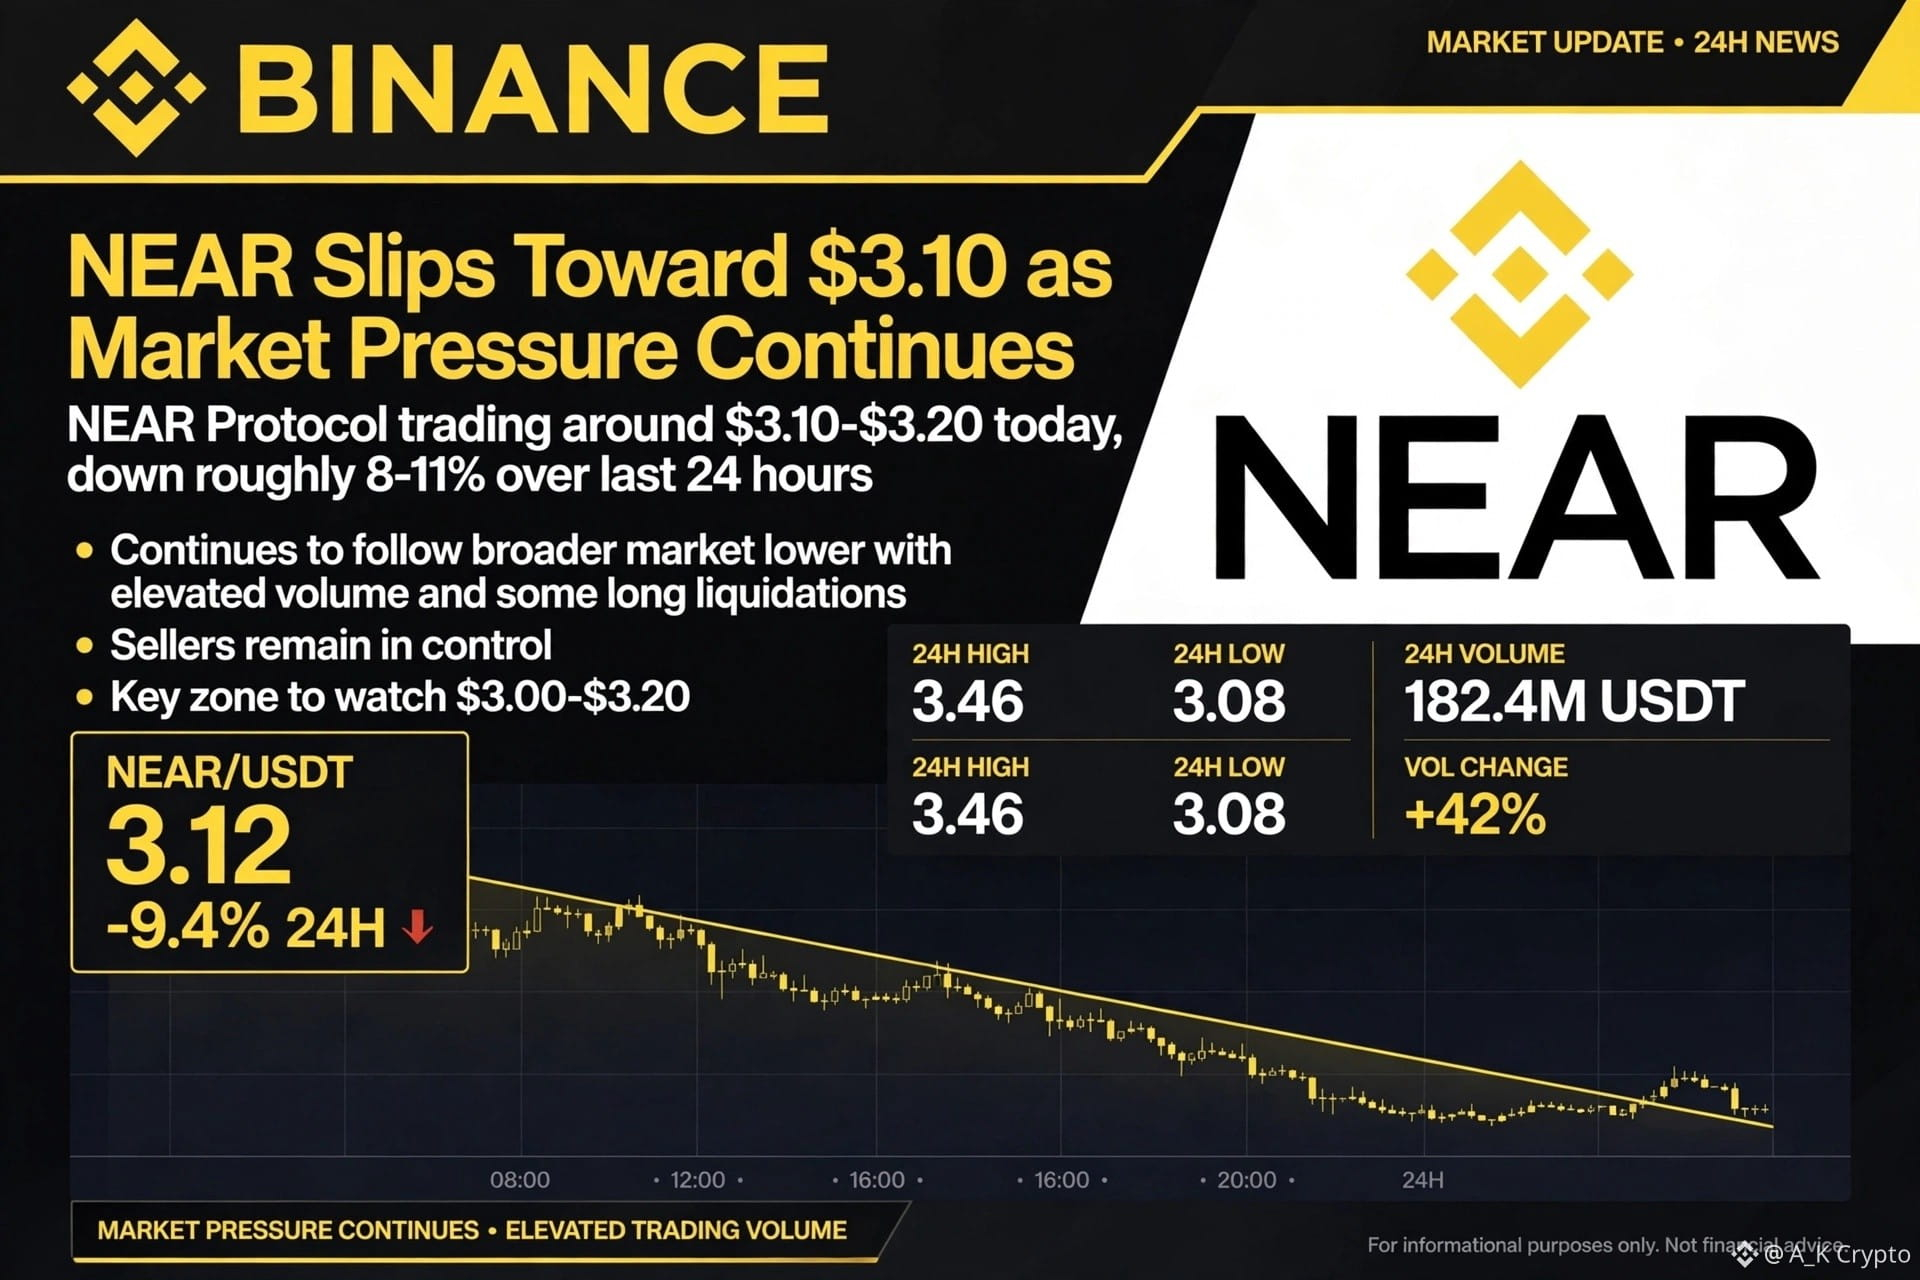
1
182

·
--
උසබ තත්ත්වය
NEAR Protocol is working on scalable blockchain infrastructure with growing interest in AI and Web3 applications.
I prefer accumulating during market dips instead of buying after big green candles.
Stay patient and think long term.
#NEAR #NEARProtocol #BuyTheDip #Mr_SPONDY_13
$NEAR
{spot}(NEARUSDT)
NEAR Protocol is working on scalable blockchain infrastructure with growing interest in AI and Web3 applications.
I prefer accumulating during market dips instead of buying after big green candles.
Stay patient and think long term.
#NEAR #NEARProtocol #BuyTheDip #Mr_SPONDY_13
$NEAR
I prefer accumulating during market dips instead of buying after big green candles.
Stay patient and think long term.
#NEAR #NEARProtocol #BuyTheDip #Mr_SPONDY_13
$NEAR

3
449
තවත් අන්තර්ගතයන් ගවේෂණය කිරීමට ඇතුල් වන්න
Binance චතුරශ්රය හි ගෝලීය ක්රිප්ටෝ පරිශීලකයින් හා එක්වන්න
⚡️ ක්රිප්ටෝ පිළිබඳ නවතම සහ ප්රයෝජනවත් තොරතුරු ලබා ගන්න.
💬 ලොව විශාලතම ක්රිප්ටෝ හුවමාරුව මගින් විශ්වාස කෙරේ.
👍 සත්යායනය කරන ලද නිර්මාණකරුවන්ගෙන් සැබෑ විදසුන් සොයා ගන්න.
විද්යුත් තැපෑල / දුරකථන අංකය
නැගී එන මාතෘකා
1
#NvidiaEarningsTonight:AIStocks’NextMove?
769 නැරඹීම්
58 සාකච්ඡා කරමින්
2
#A Packed Week of Earnings and Data Tests Markets
89,599 නැරඹීම්
502 සාකච්ඡා කරමින්
3
#AnthropicIPOTestsInvestorAppetiteForAI
180,757 නැරඹීම්
1,895 සාකච්ඡා කරමින්
4
#NvidiaBoardNotConsideringHuang’sReturnasCEO
26,348 නැරඹීම්
337 සාකච්ඡා කරමින්
5
#WhatInvestmentSignalsDo13FFilingsReveal?
15,315 නැරඹීම්
240 සාකච්ඡා කරමින්
6
#GoldmanSachsAndMillenniumEachHeldOver$1.2BInBitcoinETFs
591 නැරඹීම්
7 සාකච්ඡා කරමින්
7
#InvescoStablecoinReservesFundLaunchesOnEthereum
7,842 නැරඹීම්
148 සාකච්ඡා කරමින්
8
#CypherpunkReports$306MQ3NetProfit
1,192 නැරඹීම්
17 සාකච්ඡා කරමින්
9
#OPTIMJACKAttackInfectsAtLeast186Websites
13,297 නැරඹීම්
182 සාකච්ඡා කරමින්
10
#StrategySells2.09MMSTRSharesFor$244.7M
2,780 නැරඹීම්
20 සාකච්ඡා කරමින්