
#goldusdt
goldusdt
891 නැරඹීම්
15 සාකච්ඡා කරමින්
උණුසුම්
නවතම


·
--
ලිපිය
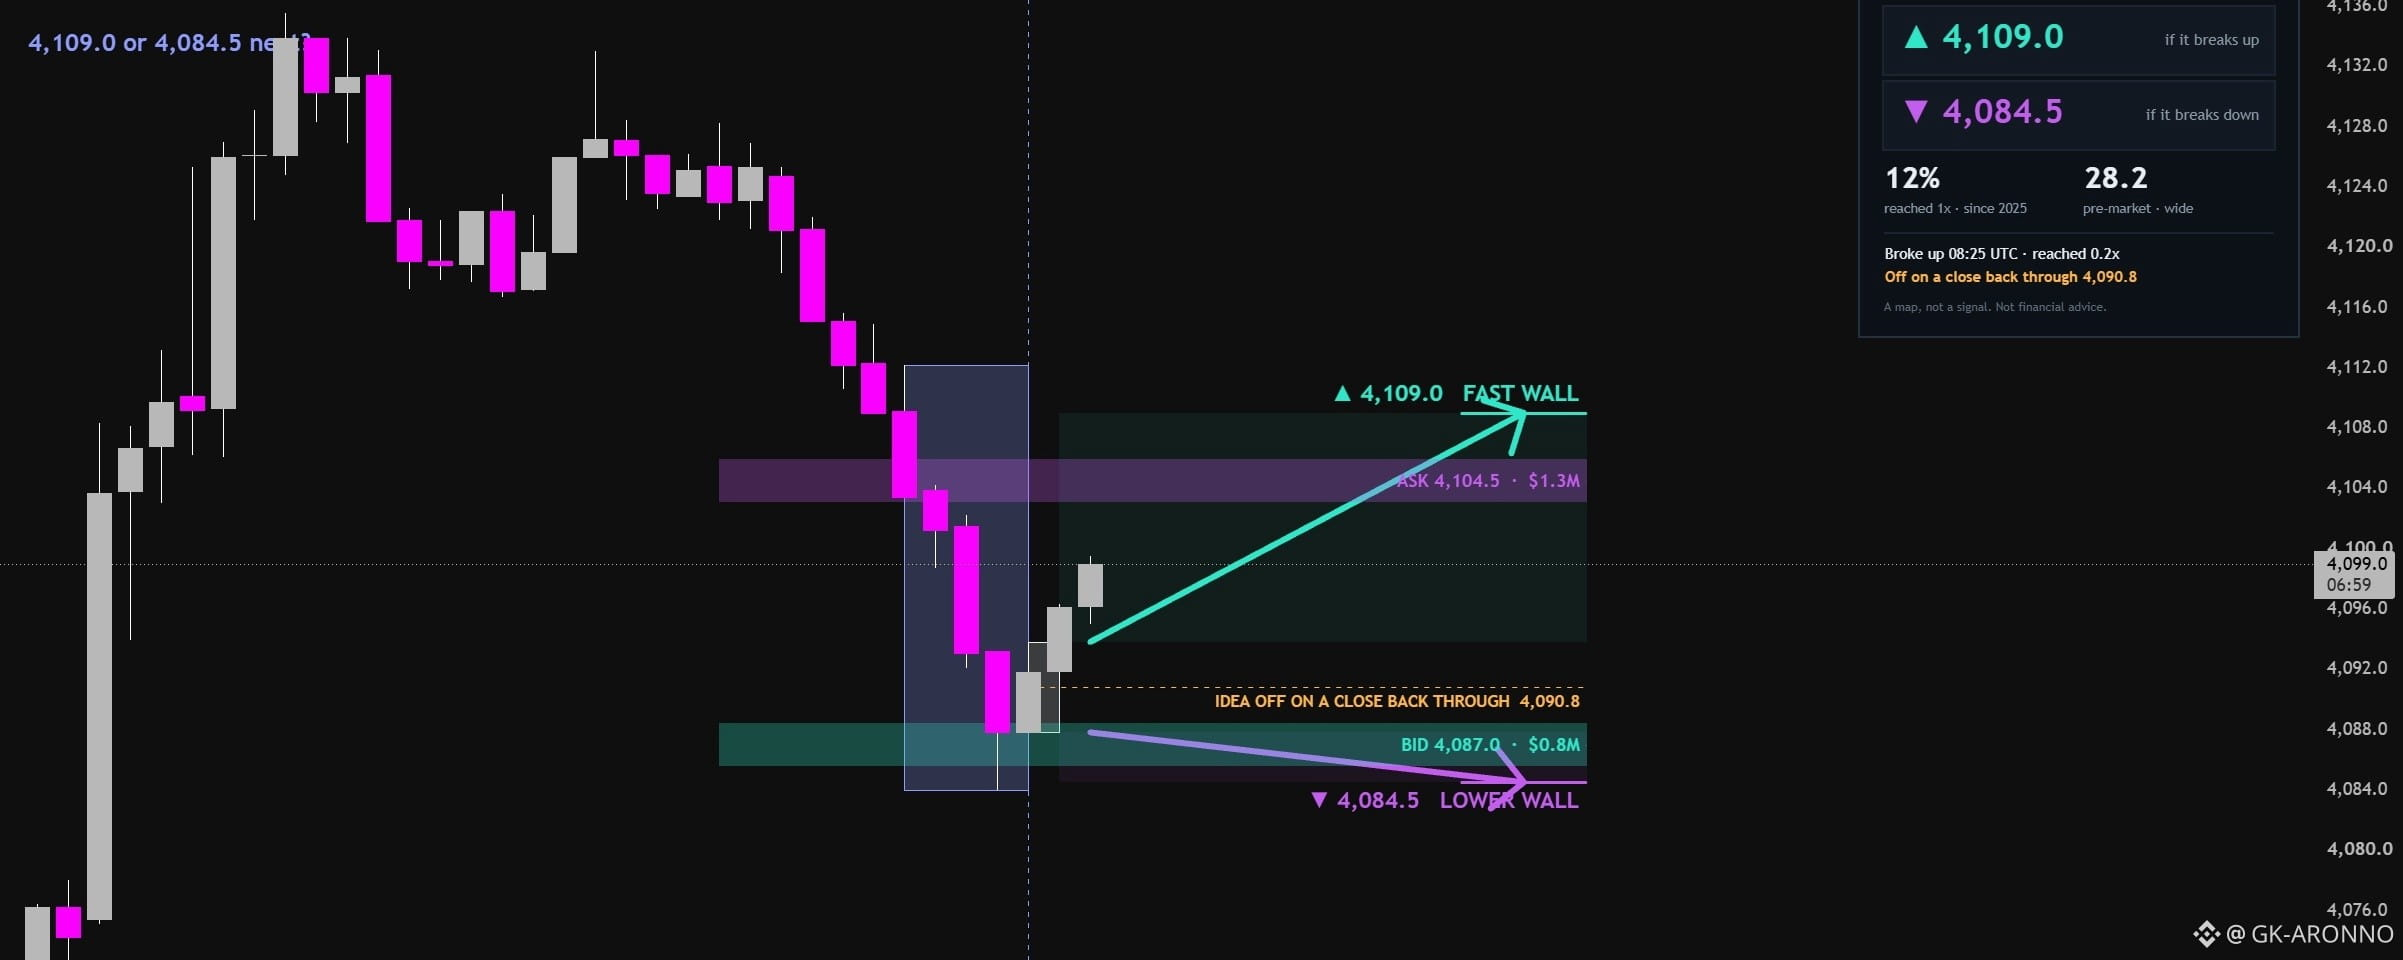
Gold London open: 4,109.0 or 4,084.5 next?✨🎊Gold heads into the London session at 4,099.2. This is the map for the session: where it starts, the next level on the map in each direction, and how often breaks at this open have travelled that far.
THE SETUP
- Pre-market (the hour before the London open): 4,084.0 to 4,112.2, 28.2 wide - wide: over 133 % of its usual width (12.3 over the last 20 sessions).
- Opening range (first 15 minutes): 4,087.8 to 4,093.8. The middle, 4,090.8, is where the idea ends.
THE MAP
- If it breaks up: next on the map 4,109.0 (Fast wall, VWAP (day)), then 4,424.0 (Short liquidations $15M, Upper wall).
- If it breaks down: next on the map 4,084.5 (Lower wall, Flip), then 4,072.6 (Yesterday's POC, Yesterday's VAH).
- The idea is over on a 1-minute close back through the middle of the opening range.
WHERE PRICE STANDS
- Price is above yesterday's value area (VAH 4,072.0, VAL 4,058.2): it has left balance.
- Price is above the weekly open (4,057.2) and above the daily open (4,057.2).
- Daily trend: price below the 50-day (4,113.4) and below the 200-day (4,332.5) average.
- Over 24 hours price is +0.82 % and open interest -1.4 %: the move up is mostly shorts covering.
- Funding is +0.0 % a year across the market: normal.
- The 14-day average daily range is 67.79 (1.7 %).
- Within 2 %: under $0.1M of longs below and $0.48M of shorts above would be liquidated.
THE ORDER BOOK
- Largest resting sell orders above: 4,104.5 ($1.3M, +0.13 %); 4,166.2 ($974k, +1.64 %); 4,170.5 ($973k, +1.74 %).
- Largest resting buy orders below: 4,073.5 ($1.6M, -0.63 %); 4,040.0 ($874k, -1.44 %); 4,036.0 ($884k, -1.54 %).
- Resting orders can be pulled before price gets there; they show where size is waiting now, not where it will stay.
POSITIONING AND LIQUIDATIONS
- Within 1 % of price: $0k of long liquidations below and $0k of short liquidations above.
- Within 2 % of price: $42k of long liquidations below and $475k of short liquidations above.
- Within 5 % of price: $1.1M of long liquidations below and $747k of short liquidations above.
- Largest short-liquidation cluster: $15M at 4,422.5 (+7.9 %).
WHAT HAS HAPPENED BEFORE
- At the London open since 2025 with a wide pre-market, breaks of the first 15 minutes reached 1x the pre-market width beyond the range 12% of the time and 2x 9%.
- 87% of breaks closed back through the middle of the range before the session ended.
- Trading these breaks mechanically has not paid after costs in our three-year test, so read this as a map of where the session is likely to be decided, not as an entry.
SO FAR
- Broke up at 08:25 UTC, reached 0.2x the pre-market width.
HOW TO READ THE CHART
The teal and violet arrows run from the opening range to the next level on the map if price breaks up or down. The small boxes are the pre-market hour and the first 15 minutes; the dashed amber line is where the idea ends. Thick violet and teal bands are resting sell and buy orders with their size, pink bands are clusters of liquidation prices, and dotted amber lines are the options call and put walls.
A map for the session, not a trade signal. Not financial advice.
$GOLD.US
{stock_us}(GOLD.US)
#GOLDUSDT
Gold London open: 4,109.0 or 4,084.5 next?✨🎊
Gold heads into the London session at 4,099.2. This is the map for the session: where it starts, the next level on the map in each direction, and how often breaks at this open have travelled that far.
THE SETUP
- Pre-market (the hour before the London open): 4,084.0 to 4,112.2, 28.2 wide - wide: over 133 % of its usual width (12.3 over the last 20 sessions).
- Opening range (first 15 minutes): 4,087.8 to 4,093.8. The middle, 4,090.8, is where the idea ends.
THE MAP
- If it breaks up: next on the map 4,109.0 (Fast wall, VWAP (day)), then 4,424.0 (Short liquidations $15M, Upper wall).
- If it breaks down: next on the map 4,084.5 (Lower wall, Flip), then 4,072.6 (Yesterday's POC, Yesterday's VAH).
- The idea is over on a 1-minute close back through the middle of the opening range.
WHERE PRICE STANDS
- Price is above yesterday's value area (VAH 4,072.0, VAL 4,058.2): it has left balance.
- Price is above the weekly open (4,057.2) and above the daily open (4,057.2).
- Daily trend: price below the 50-day (4,113.4) and below the 200-day (4,332.5) average.
- Over 24 hours price is +0.82 % and open interest -1.4 %: the move up is mostly shorts covering.
- Funding is +0.0 % a year across the market: normal.
- The 14-day average daily range is 67.79 (1.7 %).
- Within 2 %: under $0.1M of longs below and $0.48M of shorts above would be liquidated.
THE ORDER BOOK
- Largest resting sell orders above: 4,104.5 ($1.3M, +0.13 %); 4,166.2 ($974k, +1.64 %); 4,170.5 ($973k, +1.74 %).
- Largest resting buy orders below: 4,073.5 ($1.6M, -0.63 %); 4,040.0 ($874k, -1.44 %); 4,036.0 ($884k, -1.54 %).
- Resting orders can be pulled before price gets there; they show where size is waiting now, not where it will stay.
POSITIONING AND LIQUIDATIONS
- Within 1 % of price: $0k of long liquidations below and $0k of short liquidations above.
- Within 2 % of price: $42k of long liquidations below and $475k of short liquidations above.
- Within 5 % of price: $1.1M of long liquidations below and $747k of short liquidations above.
- Largest short-liquidation cluster: $15M at 4,422.5 (+7.9 %).
WHAT HAS HAPPENED BEFORE
- At the London open since 2025 with a wide pre-market, breaks of the first 15 minutes reached 1x the pre-market width beyond the range 12% of the time and 2x 9%.
- 87% of breaks closed back through the middle of the range before the session ended.
- Trading these breaks mechanically has not paid after costs in our three-year test, so read this as a map of where the session is likely to be decided, not as an entry.
SO FAR
- Broke up at 08:25 UTC, reached 0.2x the pre-market width.
HOW TO READ THE CHART
The teal and violet arrows run from the opening range to the next level on the map if price breaks up or down. The small boxes are the pre-market hour and the first 15 minutes; the dashed amber line is where the idea ends. Thick violet and teal bands are resting sell and buy orders with their size, pink bands are clusters of liquidation prices, and dotted amber lines are the options call and put walls.
A map for the session, not a trade signal. Not financial advice.
$GOLD.US
#GOLDUSDT
THE SETUP
- Pre-market (the hour before the London open): 4,084.0 to 4,112.2, 28.2 wide - wide: over 133 % of its usual width (12.3 over the last 20 sessions).
- Opening range (first 15 minutes): 4,087.8 to 4,093.8. The middle, 4,090.8, is where the idea ends.
THE MAP
- If it breaks up: next on the map 4,109.0 (Fast wall, VWAP (day)), then 4,424.0 (Short liquidations $15M, Upper wall).
- If it breaks down: next on the map 4,084.5 (Lower wall, Flip), then 4,072.6 (Yesterday's POC, Yesterday's VAH).
- The idea is over on a 1-minute close back through the middle of the opening range.
WHERE PRICE STANDS
- Price is above yesterday's value area (VAH 4,072.0, VAL 4,058.2): it has left balance.
- Price is above the weekly open (4,057.2) and above the daily open (4,057.2).
- Daily trend: price below the 50-day (4,113.4) and below the 200-day (4,332.5) average.
- Over 24 hours price is +0.82 % and open interest -1.4 %: the move up is mostly shorts covering.
- Funding is +0.0 % a year across the market: normal.
- The 14-day average daily range is 67.79 (1.7 %).
- Within 2 %: under $0.1M of longs below and $0.48M of shorts above would be liquidated.
THE ORDER BOOK
- Largest resting sell orders above: 4,104.5 ($1.3M, +0.13 %); 4,166.2 ($974k, +1.64 %); 4,170.5 ($973k, +1.74 %).
- Largest resting buy orders below: 4,073.5 ($1.6M, -0.63 %); 4,040.0 ($874k, -1.44 %); 4,036.0 ($884k, -1.54 %).
- Resting orders can be pulled before price gets there; they show where size is waiting now, not where it will stay.
POSITIONING AND LIQUIDATIONS
- Within 1 % of price: $0k of long liquidations below and $0k of short liquidations above.
- Within 2 % of price: $42k of long liquidations below and $475k of short liquidations above.
- Within 5 % of price: $1.1M of long liquidations below and $747k of short liquidations above.
- Largest short-liquidation cluster: $15M at 4,422.5 (+7.9 %).
WHAT HAS HAPPENED BEFORE
- At the London open since 2025 with a wide pre-market, breaks of the first 15 minutes reached 1x the pre-market width beyond the range 12% of the time and 2x 9%.
- 87% of breaks closed back through the middle of the range before the session ended.
- Trading these breaks mechanically has not paid after costs in our three-year test, so read this as a map of where the session is likely to be decided, not as an entry.
SO FAR
- Broke up at 08:25 UTC, reached 0.2x the pre-market width.
HOW TO READ THE CHART
The teal and violet arrows run from the opening range to the next level on the map if price breaks up or down. The small boxes are the pre-market hour and the first 15 minutes; the dashed amber line is where the idea ends. Thick violet and teal bands are resting sell and buy orders with their size, pink bands are clusters of liquidation prices, and dotted amber lines are the options call and put walls.
A map for the session, not a trade signal. Not financial advice.
$GOLD.US
#GOLDUSDT
83

·
--
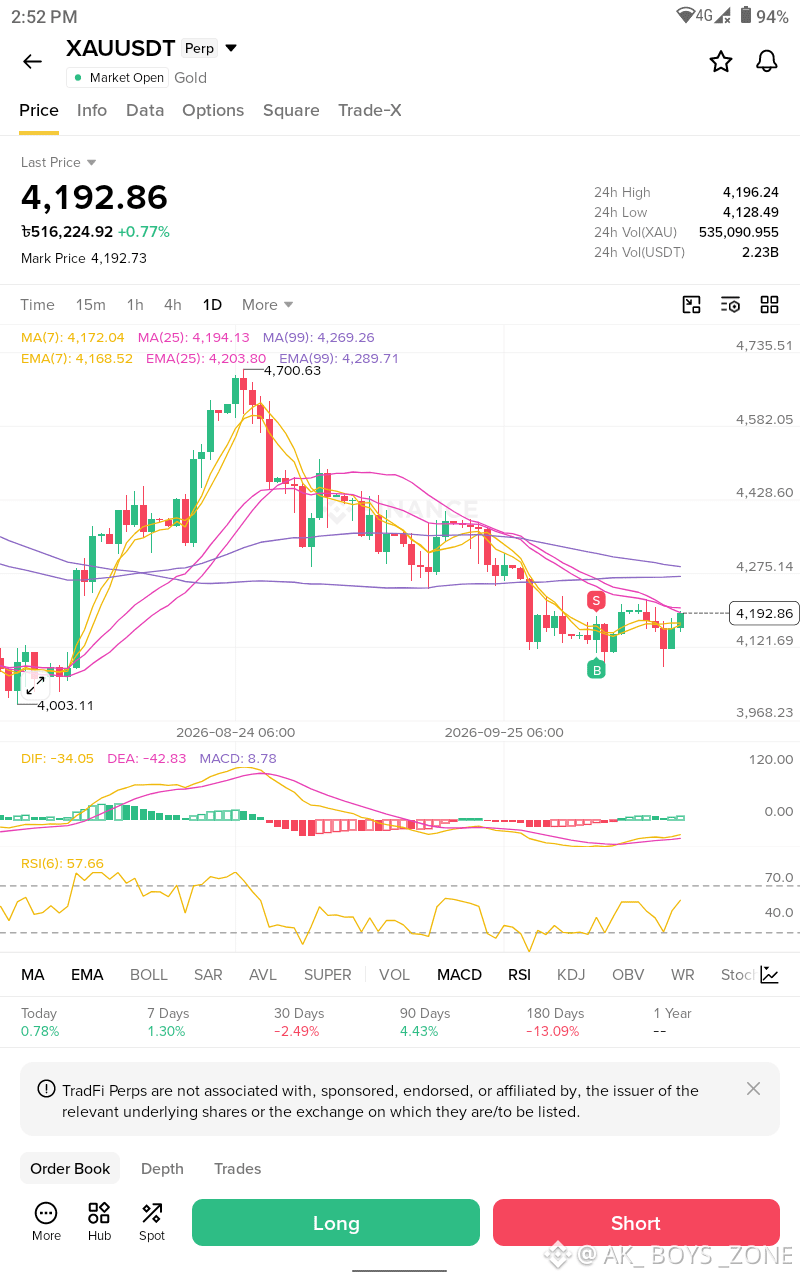
$XAU $USDT Perp — Trade-X Update | 2026-10-01
Last: $4,183.49 (Rs 11.5 Lakh)
24H Range: $4,144.55 - $4,226.82
Setup:
Price dumped to $4,179 and wicked back with 1.13M $USDT candle. Now holding above MA60.
My Bias: Bullish above $4,182.83.
Invalidation: Close below $4,179.
No financial advice. Just sharing my chart.
#XAUUSDT #GOLDUSDT
{future}(XAUTUSDT)
$XAU $USDT Perp — Trade-X Update | 2026-10-01
Last: $4,183.49 (Rs 11.5 Lakh)
24H Range: $4,144.55 - $4,226.82
Setup:
Price dumped to $4,179 and wicked back with 1.13M $USDT candle. Now holding above MA60.
My Bias: Bullish above $4,182.83.
Invalidation: Close below $4,179.
No financial advice. Just sharing my chart.
#XAUUSDT #GOLDUSDT
Last: $4,183.49 (Rs 11.5 Lakh)
24H Range: $4,144.55 - $4,226.82
Setup:
Price dumped to $4,179 and wicked back with 1.13M $USDT candle. Now holding above MA60.
My Bias: Bullish above $4,182.83.
Invalidation: Close below $4,179.
No financial advice. Just sharing my chart.
#XAUUSDT #GOLDUSDT
176

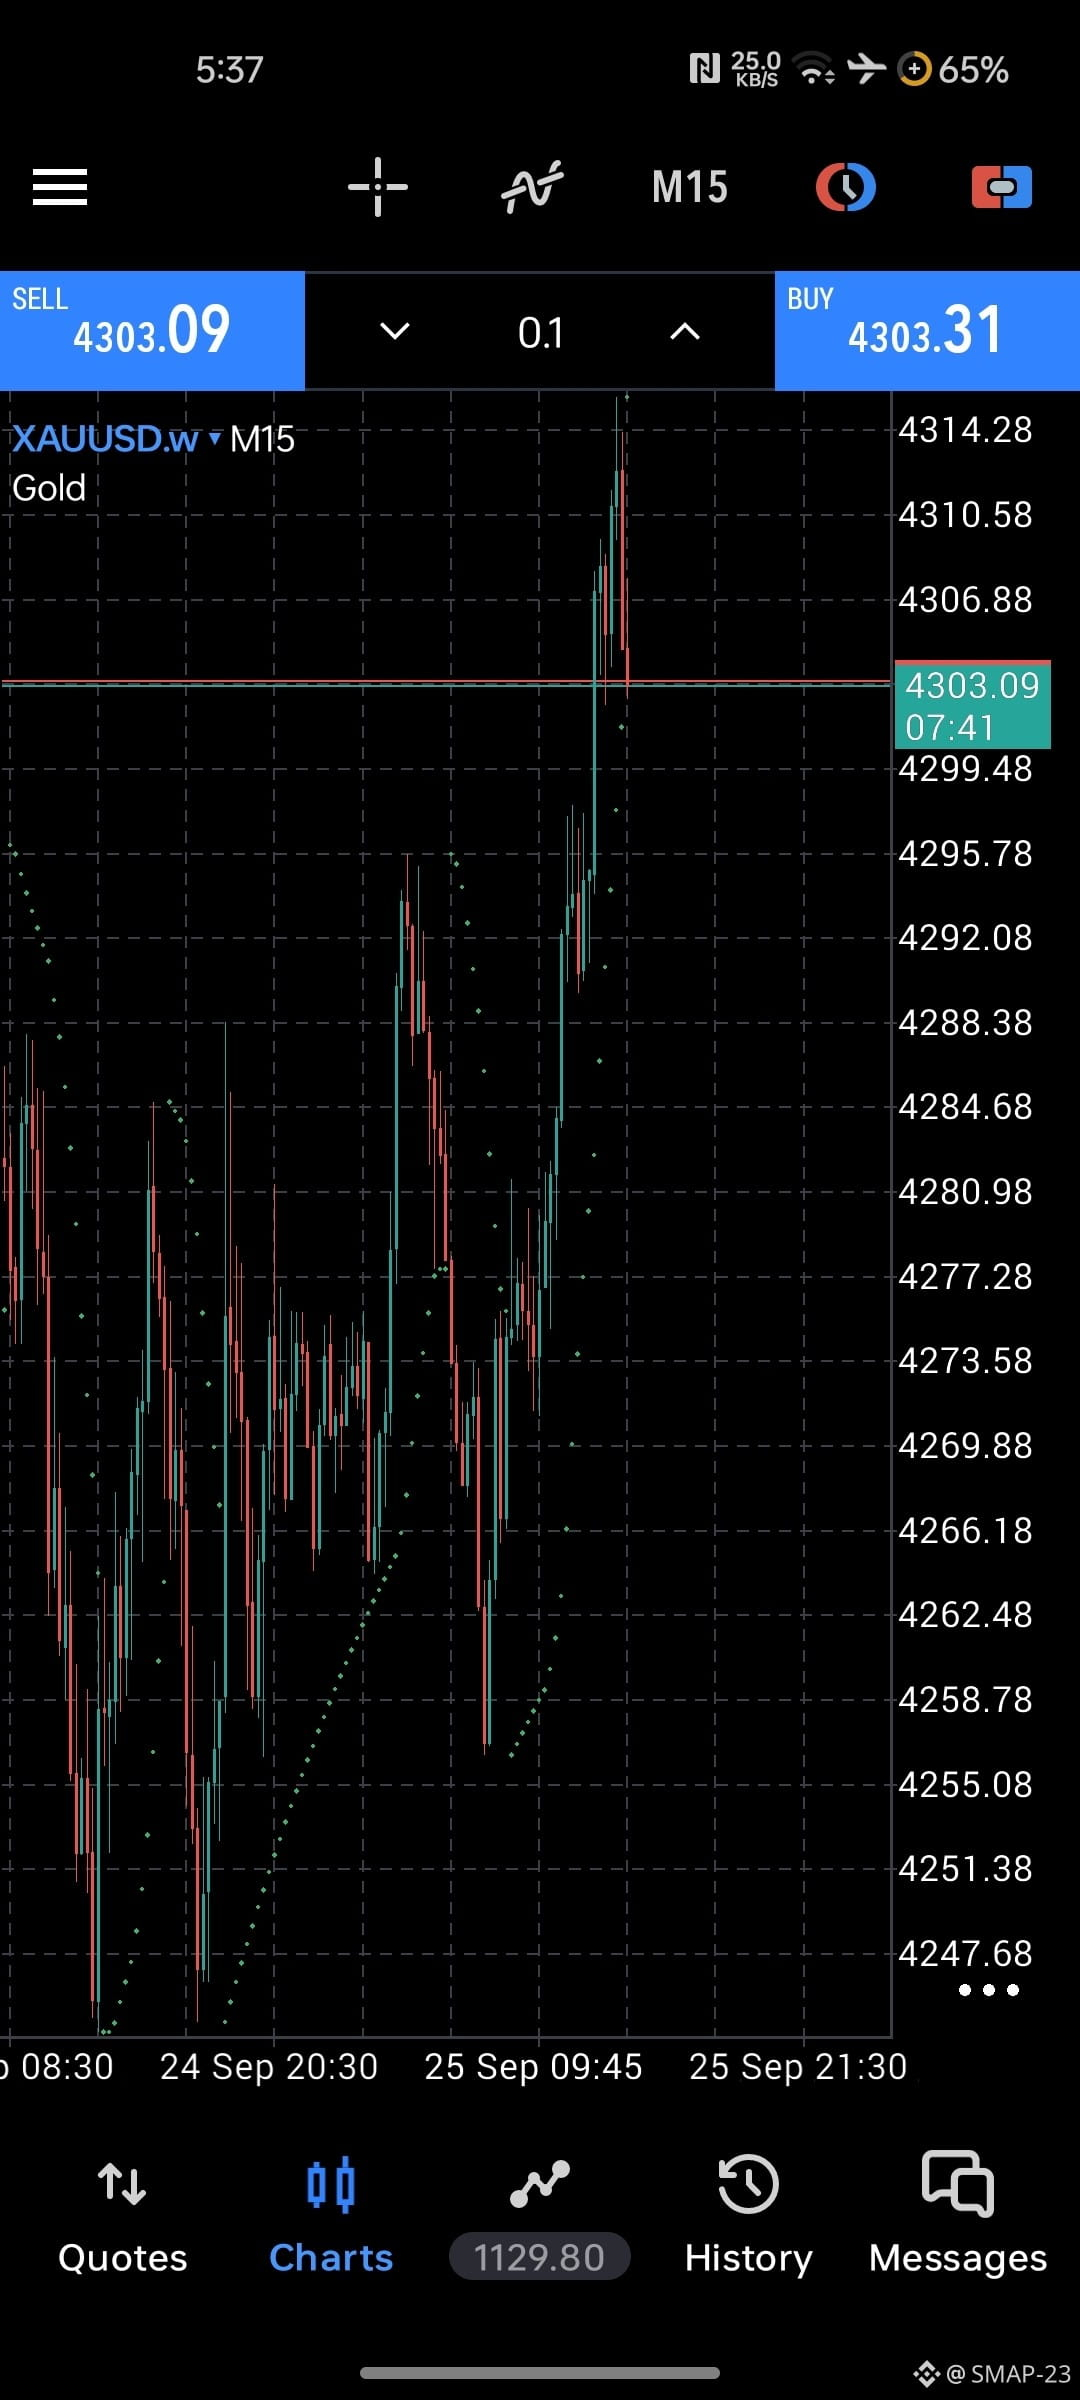
#goldusdt Buy Buy Buy This Candle is Bullish Market and Buyer Control. Every one Short time is buy $GOLD.US
#goldusdt Buy Buy Buy This Candle is Bullish Market and Buyer Control. Every one Short time is buy $GOLD.US
XAU-0.15%
GOLDUS+2.04%
245

·
--

1
160

·
--
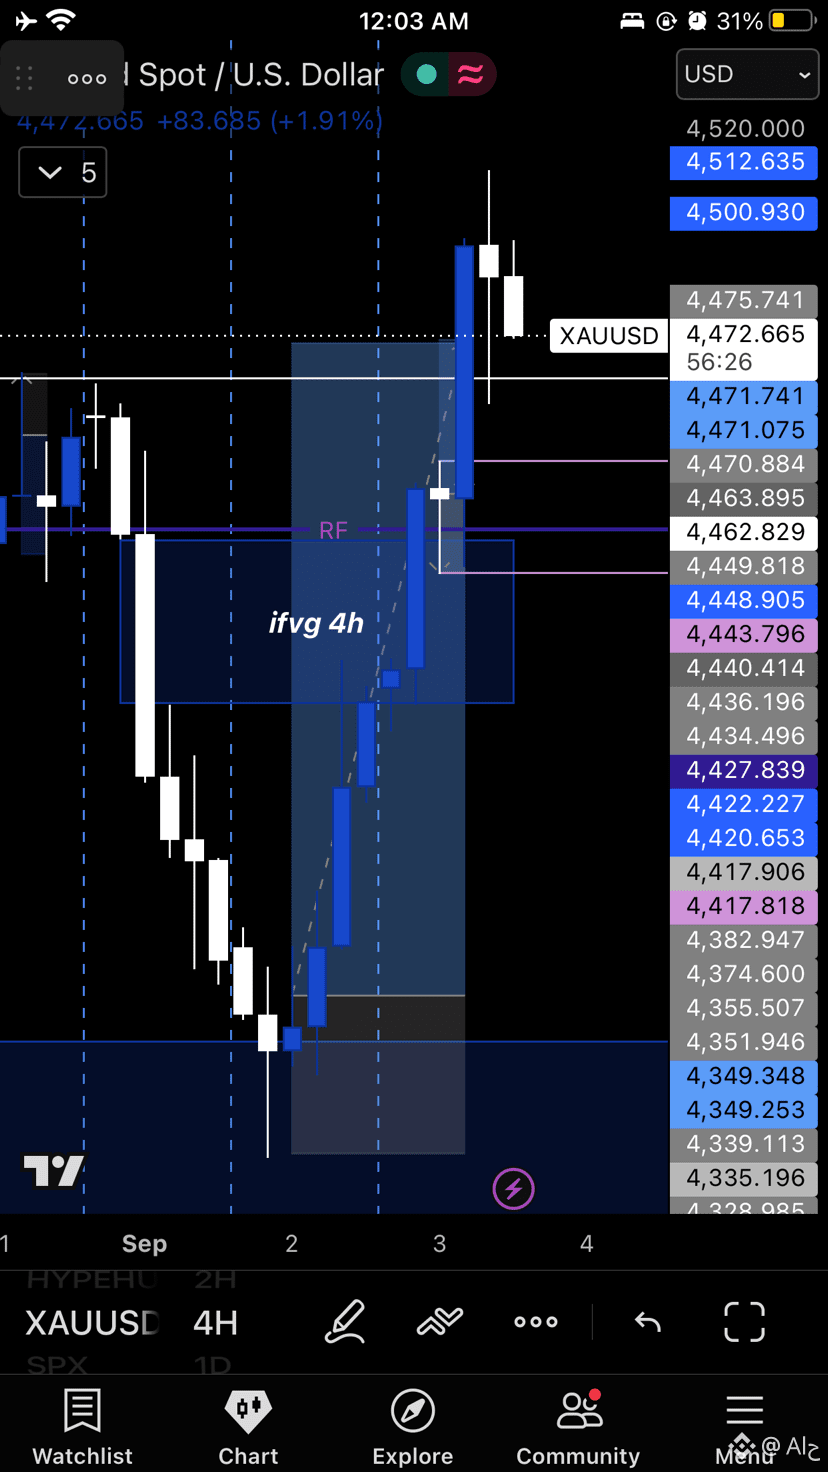
Took this trade on XAU/USD
I was bullish from yeaterday held this trade all tje way to TP.
Behind the scenes i was nerveous but i had to hold it because i knew im right and im doubting myself , what ill say to begginer or any level of trader you are especially wjen starting out DO NOT FEAR ATALL WHAT EVER HAPPENS WILL HAPPEN so do not fear and execute fearlessly if your setup has formed press the button and yeah not blindly obviosly with proper risk managemnet
#gold #XAUUSD #forex #crypto #goldusdt $GOLD.US
Took this trade on XAU/USD
I was bullish from yeaterday held this trade all tje way to TP.
Behind the scenes i was nerveous but i had to hold it because i knew im right and im doubting myself , what ill say to begginer or any level of trader you are especially wjen starting out DO NOT FEAR ATALL WHAT EVER HAPPENS WILL HAPPEN so do not fear and execute fearlessly if your setup has formed press the button and yeah not blindly obviosly with proper risk managemnet
#gold #XAUUSD #forex #crypto #goldusdt $GOLD.US
I was bullish from yeaterday held this trade all tje way to TP.
Behind the scenes i was nerveous but i had to hold it because i knew im right and im doubting myself , what ill say to begginer or any level of trader you are especially wjen starting out DO NOT FEAR ATALL WHAT EVER HAPPENS WILL HAPPEN so do not fear and execute fearlessly if your setup has formed press the button and yeah not blindly obviosly with proper risk managemnet
#gold #XAUUSD #forex #crypto #goldusdt $GOLD.US
1
1
756

තවත් අන්තර්ගතයන් ගවේෂණය කිරීමට ඇතුල් වන්න
Binance චතුරශ්රය හි ගෝලීය ක්රිප්ටෝ පරිශීලකයින් හා එක්වන්න
⚡️ ක්රිප්ටෝ පිළිබඳ නවතම සහ ප්රයෝජනවත් තොරතුරු ලබා ගන්න.
💬 ලොව විශාලතම ක්රිප්ටෝ හුවමාරුව මගින් විශ්වාස කෙරේ.
👍 සත්යායනය කරන ලද නිර්මාණකරුවන්ගෙන් සැබෑ විදසුන් සොයා ගන්න.
විද්යුත් තැපෑල / දුරකථන අංකය
නැගී එන මාතෘකා
1
#NvidiaInvestigatesAfterHuang’sAffairApology
221,049 නැරඹීම්
1,792 සාකච්ඡා කරමින්
2
#CPITestsDecemberRateOutlook
671,922 නැරඹීම්
2,863 සාකච්ඡා කරමින්
3
#AnthropicRejectsIPODelayValuationinQuestion
45,381 නැරඹීම්
450 සාකච්ඡා කරමින්
4
#BitcoinFiveWeeklyLosses
247,346 නැරඹීම්
2,218 සාකච්ඡා කරමින්
5
#AIChipSlumpNasdaq
136,337 නැරඹීම්
1,367 සාකච්ඡා කරමින්
6
#CryptoLiquidationsReach$1.16BIn24Hours
16,398 නැරඹීම්
53 සාකච්ඡා කරමින්
7
#SharpLinkHolds895117ETHAsOfNovember2
0 නැරඹීම්
2 සාකච්ඡා කරමින්
8
#AnthropicPreparesIPOAsSoonAsNextWeek
0 නැරඹීම්
0 සාකච්ඡා කරමින්
9
#StrategyBuys1037BTCLastWeek
149 නැරඹීම්
16 සාකච්ඡා කරමින්
10
#BlackRockIBITTakesInOver$5BOfHoldersBitcoin
20 නැරඹීම්
2 සාකච්ඡා කරමින්