
#followersgrowth
followersgrowth
2,024 නැරඹීම්
37 සාකච්ඡා කරමින්
උණුසුම්
නවතම

·
--
උසබ තත්ත්වය
8.8K Followers Achievement 🎉🎊🎊🎁🎁💯💯💯📊📉📈🥳🥳🥳🥳#VitalikPledgesLeanerEFFewerETHSales #FollowersGrowth #follower #FollowersJourney #Follow_Like_Comment $BTC
{future}(BTCUSDT)
8.8K Followers Achievement 🎉🎊🎊🎁🎁💯💯💯📊📉📈🥳🥳🥳🥳#VitalikPledgesLeanerEFFewerETHSales #FollowersGrowth #follower #FollowersJourney #Follow_Like_Comment $BTC

3
1
76

What are the specific vessel specs and delivery timelines for QatarEnergy's multi-phase LNG carrier#us-irantalksfuelstrongstockmarketrebound
QatarEnergy’s Historic LNG Shipping Expansion Program encompasses 128 vessels. Designed to support the North Field Expansion (NFE and NFS) projects and long-term fleet renewal, the program is split between 104 conventional-sized carriers and 24 world-record ultra-large QC-Max carriers
Key Vessel Specifications by Class
The orderbook is divided into two distinct vessel classes engineered for high thermodynamic efficiency and strict environmental compliance:
Shipyard Allocation & Builder Shares
Four major global shipyards are executing the 128-ship orderbook under Phase I and Phase II contracts:
HD Hyundai Heavy Industries (South Korea): Building 34 conventional 174,000 m³ vessels.Samsung Heavy Industries (South Korea): Building 31 conventional 174,000 m³ vessels.Hanwha Ocean (South Korea): Building 27 conventional 174,000 m³ vessels.Hudong-Zhonghua Shipbuilding (China): Building 36 vessels total—12 conventional 174,000 m³ units and all 24 QC-Max (271,000 m³) mega-carriers.
Phase-by-Phase Delivery Timelines
The delivery schedule is phased across multiple years to align directly with onshore production train start-ups at Ras Laffan
Initial Deliveries (2024 – 2025): 32 conventional vessels were handed over by late 2025 (including early units like Sharq, Shra'Ouh, Mraikh, and Mesaieed).Current Peak Deliveries (2026 – 2027): Conventional 174,000 m³ vessels are being delivered at an active rate of 25–35 ships per year. Over 40 time-charter agreements are assigned across international owners (such as MISC, K-Line, MOL, NYK, and China Merchants).QC-Max Ramp-Up (2028 – 2030): Deliveries for the 24 QC-Max vessels from Hudong-Zhonghua begin in H1 2028 and extend through 2030, timed to match full-capacity output from the North Field South expansion.
$BTC $OILK.ETF #FollowersGrowth #SupportCreators #TipsNeeded
What are the specific vessel specs and delivery timelines for QatarEnergy's multi-phase LNG carrier
#us-irantalksfuelstrongstockmarketrebound
QatarEnergy’s Historic LNG Shipping Expansion Program encompasses 128 vessels. Designed to support the North Field Expansion (NFE and NFS) projects and long-term fleet renewal, the program is split between 104 conventional-sized carriers and 24 world-record ultra-large QC-Max carriers
Key Vessel Specifications by Class
The orderbook is divided into two distinct vessel classes engineered for high thermodynamic efficiency and strict environmental compliance:
Shipyard Allocation & Builder Shares
Four major global shipyards are executing the 128-ship orderbook under Phase I and Phase II contracts:
HD Hyundai Heavy Industries (South Korea): Building 34 conventional 174,000 m³ vessels.Samsung Heavy Industries (South Korea): Building 31 conventional 174,000 m³ vessels.Hanwha Ocean (South Korea): Building 27 conventional 174,000 m³ vessels.Hudong-Zhonghua Shipbuilding (China): Building 36 vessels total—12 conventional 174,000 m³ units and all 24 QC-Max (271,000 m³) mega-carriers.
Phase-by-Phase Delivery Timelines
The delivery schedule is phased across multiple years to align directly with onshore production train start-ups at Ras Laffan
Initial Deliveries (2024 – 2025): 32 conventional vessels were handed over by late 2025 (including early units like Sharq, Shra'Ouh, Mraikh, and Mesaieed).Current Peak Deliveries (2026 – 2027): Conventional 174,000 m³ vessels are being delivered at an active rate of 25–35 ships per year. Over 40 time-charter agreements are assigned across international owners (such as MISC, K-Line, MOL, NYK, and China Merchants).QC-Max Ramp-Up (2028 – 2030): Deliveries for the 24 QC-Max vessels from Hudong-Zhonghua begin in H1 2028 and extend through 2030, timed to match full-capacity output from the North Field South expansion.
$BTC $OILK.ETF #FollowersGrowth #SupportCreators #TipsNeeded
QatarEnergy’s Historic LNG Shipping Expansion Program encompasses 128 vessels. Designed to support the North Field Expansion (NFE and NFS) projects and long-term fleet renewal, the program is split between 104 conventional-sized carriers and 24 world-record ultra-large QC-Max carriers
Key Vessel Specifications by Class
The orderbook is divided into two distinct vessel classes engineered for high thermodynamic efficiency and strict environmental compliance:
Shipyard Allocation & Builder Shares
Four major global shipyards are executing the 128-ship orderbook under Phase I and Phase II contracts:
HD Hyundai Heavy Industries (South Korea): Building 34 conventional 174,000 m³ vessels.Samsung Heavy Industries (South Korea): Building 31 conventional 174,000 m³ vessels.Hanwha Ocean (South Korea): Building 27 conventional 174,000 m³ vessels.Hudong-Zhonghua Shipbuilding (China): Building 36 vessels total—12 conventional 174,000 m³ units and all 24 QC-Max (271,000 m³) mega-carriers.
Phase-by-Phase Delivery Timelines
The delivery schedule is phased across multiple years to align directly with onshore production train start-ups at Ras Laffan
Initial Deliveries (2024 – 2025): 32 conventional vessels were handed over by late 2025 (including early units like Sharq, Shra'Ouh, Mraikh, and Mesaieed).Current Peak Deliveries (2026 – 2027): Conventional 174,000 m³ vessels are being delivered at an active rate of 25–35 ships per year. Over 40 time-charter agreements are assigned across international owners (such as MISC, K-Line, MOL, NYK, and China Merchants).QC-Max Ramp-Up (2028 – 2030): Deliveries for the 24 QC-Max vessels from Hudong-Zhonghua begin in H1 2028 and extend through 2030, timed to match full-capacity output from the North Field South expansion.
$BTC $OILK.ETF #FollowersGrowth #SupportCreators #TipsNeeded
44
What does the global LNG carrier newbuild orderbook look like for the rest of 2026 and 2027?#us-irantalksfuelstrongstockmarketrebound
The global Liquefied Natural Gas Carrier (LNGC) orderbook stands at unprecedented historic levels. Driven by QatarEnergy’s massive fleet expansion, new U.S. Gulf Coast export projects, and compliance with strict environmental regulations (IMO carbon intensity targets), the vessel pipeline entering late 2026 and 2027 represents one of the largest delivery waves in maritime history.
Key Highlights of the 2026–2027 Orderbook
Unprecedented Capacity Ratio: The current active orderbook comprises roughly 340 to 360 LNGCs on firm order. This represents ~38%–40% of the existing global operating fleet by capacity—the highest orderbook-to-fleet ratio of any major commercial shipping sector.Peak Delivery Phase (2026–2027): Deliveries are heavily front-loaded into 2026 and 2027, with 100–120 vessels entering service in 2026 and 110–130 vessels scheduled for 2027.Record Newbuild Pricing: Standard conventional 174,000 m³ LNGC contract prices hold steady near record highs at $248M–$260M per vessel (compared to $180M–$200M pre-2021) due to tight shipyard slot availability.Extreme Yard Concentration: Korean yards hold full orderbook slots through 2027–2028, meaning new orders placed today face delivery windows stretching out to late 2028 or 2029.
Shipyard Breakdown & Market Share
South Korea continues to lead in high-specification, membrane-containment LNGC construction, though Chinese yards have captured a record share of total new orders through 2026.
Primary Demand Drivers for the Delivery Surge
QatarEnergy Historic Fleet Expansion: Over 100 vessels in the current orderbook belong to QatarEnergy’s multi-phase mega-tender program to support the North Field East and North Field South expansion projects.U.S. Gulf Coast Liquefaction Ramp-Up: Offtakers from major U.S. Phase-2 export projects (e.g., Plaquemines, Corpus Christi Stage 3, Port Arthur) ordered tonnage to cover long-term FOB contracts coming online through 2026–2028.Steam-Turbine Replacement (Fleet Renewal): Approximately 15%–20% of the existing global fleet consists of aging, inefficient steam-turbine LNGCs. Strict IMO carbon regulations (CII/EEXI) are pushing operators to scrap or replace older vessels with ultra-efficient 2-stroke dual-fuel carriers.
Charter Rate & Market Outlook (2027+)
Because LNGC deliveries in 2026 and 2027 are set to outpace near-term liquefaction project start-ups, the market is bracing for structural rate softening starting in 2027:
Supply Absorption Gap: If new export capacity ramps up slower than the incoming 110+ vessels in 2027, uncommitted spot ships will face downward pressure on spot charter rates.Tiered Fleet Division: A sharp divide is opening between modern 2-stroke mega-carriers (which command long-term multi-year charter coverage) and older steam-turbine vessels, which risk becoming uncharterable and facing accelerated scrapping by late 2027.
$LNGX.ETF $USDC #FollowersGrowth #SupportCreator #TipsNeeded
What does the global LNG carrier newbuild orderbook look like for the rest of 2026 and 2027?
#us-irantalksfuelstrongstockmarketrebound
The global Liquefied Natural Gas Carrier (LNGC) orderbook stands at unprecedented historic levels. Driven by QatarEnergy’s massive fleet expansion, new U.S. Gulf Coast export projects, and compliance with strict environmental regulations (IMO carbon intensity targets), the vessel pipeline entering late 2026 and 2027 represents one of the largest delivery waves in maritime history.
Key Highlights of the 2026–2027 Orderbook
Unprecedented Capacity Ratio: The current active orderbook comprises roughly 340 to 360 LNGCs on firm order. This represents ~38%–40% of the existing global operating fleet by capacity—the highest orderbook-to-fleet ratio of any major commercial shipping sector.Peak Delivery Phase (2026–2027): Deliveries are heavily front-loaded into 2026 and 2027, with 100–120 vessels entering service in 2026 and 110–130 vessels scheduled for 2027.Record Newbuild Pricing: Standard conventional 174,000 m³ LNGC contract prices hold steady near record highs at $248M–$260M per vessel (compared to $180M–$200M pre-2021) due to tight shipyard slot availability.Extreme Yard Concentration: Korean yards hold full orderbook slots through 2027–2028, meaning new orders placed today face delivery windows stretching out to late 2028 or 2029.
Shipyard Breakdown & Market Share
South Korea continues to lead in high-specification, membrane-containment LNGC construction, though Chinese yards have captured a record share of total new orders through 2026.
Primary Demand Drivers for the Delivery Surge
QatarEnergy Historic Fleet Expansion: Over 100 vessels in the current orderbook belong to QatarEnergy’s multi-phase mega-tender program to support the North Field East and North Field South expansion projects.U.S. Gulf Coast Liquefaction Ramp-Up: Offtakers from major U.S. Phase-2 export projects (e.g., Plaquemines, Corpus Christi Stage 3, Port Arthur) ordered tonnage to cover long-term FOB contracts coming online through 2026–2028.Steam-Turbine Replacement (Fleet Renewal): Approximately 15%–20% of the existing global fleet consists of aging, inefficient steam-turbine LNGCs. Strict IMO carbon regulations (CII/EEXI) are pushing operators to scrap or replace older vessels with ultra-efficient 2-stroke dual-fuel carriers.
Charter Rate & Market Outlook (2027+)
Because LNGC deliveries in 2026 and 2027 are set to outpace near-term liquefaction project start-ups, the market is bracing for structural rate softening starting in 2027:
Supply Absorption Gap: If new export capacity ramps up slower than the incoming 110+ vessels in 2027, uncommitted spot ships will face downward pressure on spot charter rates.Tiered Fleet Division: A sharp divide is opening between modern 2-stroke mega-carriers (which command long-term multi-year charter coverage) and older steam-turbine vessels, which risk becoming uncharterable and facing accelerated scrapping by late 2027.
$LNGX.ETF $USDC #FollowersGrowth #SupportCreator #TipsNeeded
The global Liquefied Natural Gas Carrier (LNGC) orderbook stands at unprecedented historic levels. Driven by QatarEnergy’s massive fleet expansion, new U.S. Gulf Coast export projects, and compliance with strict environmental regulations (IMO carbon intensity targets), the vessel pipeline entering late 2026 and 2027 represents one of the largest delivery waves in maritime history.
Key Highlights of the 2026–2027 Orderbook
Unprecedented Capacity Ratio: The current active orderbook comprises roughly 340 to 360 LNGCs on firm order. This represents ~38%–40% of the existing global operating fleet by capacity—the highest orderbook-to-fleet ratio of any major commercial shipping sector.Peak Delivery Phase (2026–2027): Deliveries are heavily front-loaded into 2026 and 2027, with 100–120 vessels entering service in 2026 and 110–130 vessels scheduled for 2027.Record Newbuild Pricing: Standard conventional 174,000 m³ LNGC contract prices hold steady near record highs at $248M–$260M per vessel (compared to $180M–$200M pre-2021) due to tight shipyard slot availability.Extreme Yard Concentration: Korean yards hold full orderbook slots through 2027–2028, meaning new orders placed today face delivery windows stretching out to late 2028 or 2029.
Shipyard Breakdown & Market Share
South Korea continues to lead in high-specification, membrane-containment LNGC construction, though Chinese yards have captured a record share of total new orders through 2026.
Primary Demand Drivers for the Delivery Surge
QatarEnergy Historic Fleet Expansion: Over 100 vessels in the current orderbook belong to QatarEnergy’s multi-phase mega-tender program to support the North Field East and North Field South expansion projects.U.S. Gulf Coast Liquefaction Ramp-Up: Offtakers from major U.S. Phase-2 export projects (e.g., Plaquemines, Corpus Christi Stage 3, Port Arthur) ordered tonnage to cover long-term FOB contracts coming online through 2026–2028.Steam-Turbine Replacement (Fleet Renewal): Approximately 15%–20% of the existing global fleet consists of aging, inefficient steam-turbine LNGCs. Strict IMO carbon regulations (CII/EEXI) are pushing operators to scrap or replace older vessels with ultra-efficient 2-stroke dual-fuel carriers.
Charter Rate & Market Outlook (2027+)
Because LNGC deliveries in 2026 and 2027 are set to outpace near-term liquefaction project start-ups, the market is bracing for structural rate softening starting in 2027:
Supply Absorption Gap: If new export capacity ramps up slower than the incoming 110+ vessels in 2027, uncommitted spot ships will face downward pressure on spot charter rates.Tiered Fleet Division: A sharp divide is opening between modern 2-stroke mega-carriers (which command long-term multi-year charter coverage) and older steam-turbine vessels, which risk becoming uncharterable and facing accelerated scrapping by late 2027.
$LNGX.ETF $USDC #FollowersGrowth #SupportCreator #TipsNeeded
USDC+0.01%
LNGXETF-3.01%
12
How are global LNG shipping routes adapting to Middle East supply disruptions?#us-irantalksfuelstrongstockmarketrebound
Global LNG shipping routes have undergone structural shifts to adapt to Middle East security threats—primarily surrounding the Strait of Hormuz and Red Sea/Bab el-Mandeb transit corridors. Because roughly 20% of global seaborne LNG originates in the Persian Gulf (led by Qatar and the UAE), shipping lines and energy majors have adopted operational adaptations.
1. Long-Haul Rerouting via the Cape of Good Hope
To completely bypass high-risk zones in the Red Sea and Persian Gulf, shippers heading between the Atlantic and Pacific Basins have normalized circumnavigating Africa via the Cape of Good Hope.
Transit Time & Cost Additions: Round-trip voyages between the U.S. Gulf Coast or Europe and Northeast Asia take 10 to 14 days longer around Africa compared to Suez Canal routes.Tonnage Absorption: The longer voyage durations effectively absorb global fleet capacity, tightening tanker availability and driving up charter rates.
2. Ship-to-Ship (STS) Transfers & Gulf of Oman Offloading
To reduce exposure inside the Persian Gulf, exporters have altered their shuttle strategies:
Outer Anchorages: Tankers exiting the Strait of Hormuz increasingly conduct Ship-to-Ship (STS) transfers off safer outer anchorages, such as Sohar in Oman, transferring gas onto secondary, long-haul carriers bound for Asia or Europe.Southern Corridor Preference: Vessels entering or exiting the Gulf have shifted heavily toward southern navigational lanes within regional channels to lower exposure to contested coastlines.
3. Structural Cargo Swaps & Regional Arbitrage
Rather than sending Middle Eastern cargoes across lengthy routes to Europe, global energy buyers have optimized geographic swaps:
Middle East → Asia Short Hauls: A larger portion of Middle Eastern LNG is channeled toward nearby Asian importers (such as India, China, and South Korea) via direct Indian Ocean transits, minimizing overall travel days.US & Atlantic → Europe: European buyers rely more heavily on short-haul Atlantic Basin supply (principally U.S. export terminals), which can reach Northwestern European regasification hubs without crossing Middle Eastern chokepoints.
Operational & Economic Impacts
$LNGX.ETF #BTC #FollowersGrowth #SupportCreators #TipsForBeginners
How are global LNG shipping routes adapting to Middle East supply disruptions?
#us-irantalksfuelstrongstockmarketrebound
Global LNG shipping routes have undergone structural shifts to adapt to Middle East security threats—primarily surrounding the Strait of Hormuz and Red Sea/Bab el-Mandeb transit corridors. Because roughly 20% of global seaborne LNG originates in the Persian Gulf (led by Qatar and the UAE), shipping lines and energy majors have adopted operational adaptations.
1. Long-Haul Rerouting via the Cape of Good Hope
To completely bypass high-risk zones in the Red Sea and Persian Gulf, shippers heading between the Atlantic and Pacific Basins have normalized circumnavigating Africa via the Cape of Good Hope.
Transit Time & Cost Additions: Round-trip voyages between the U.S. Gulf Coast or Europe and Northeast Asia take 10 to 14 days longer around Africa compared to Suez Canal routes.Tonnage Absorption: The longer voyage durations effectively absorb global fleet capacity, tightening tanker availability and driving up charter rates.
2. Ship-to-Ship (STS) Transfers & Gulf of Oman Offloading
To reduce exposure inside the Persian Gulf, exporters have altered their shuttle strategies:
Outer Anchorages: Tankers exiting the Strait of Hormuz increasingly conduct Ship-to-Ship (STS) transfers off safer outer anchorages, such as Sohar in Oman, transferring gas onto secondary, long-haul carriers bound for Asia or Europe.Southern Corridor Preference: Vessels entering or exiting the Gulf have shifted heavily toward southern navigational lanes within regional channels to lower exposure to contested coastlines.
3. Structural Cargo Swaps & Regional Arbitrage
Rather than sending Middle Eastern cargoes across lengthy routes to Europe, global energy buyers have optimized geographic swaps:
Middle East → Asia Short Hauls: A larger portion of Middle Eastern LNG is channeled toward nearby Asian importers (such as India, China, and South Korea) via direct Indian Ocean transits, minimizing overall travel days.US & Atlantic → Europe: European buyers rely more heavily on short-haul Atlantic Basin supply (principally U.S. export terminals), which can reach Northwestern European regasification hubs without crossing Middle Eastern chokepoints.
Operational & Economic Impacts
$LNGX.ETF #BTC #FollowersGrowth #SupportCreators #TipsForBeginners
Global LNG shipping routes have undergone structural shifts to adapt to Middle East security threats—primarily surrounding the Strait of Hormuz and Red Sea/Bab el-Mandeb transit corridors. Because roughly 20% of global seaborne LNG originates in the Persian Gulf (led by Qatar and the UAE), shipping lines and energy majors have adopted operational adaptations.
1. Long-Haul Rerouting via the Cape of Good Hope
To completely bypass high-risk zones in the Red Sea and Persian Gulf, shippers heading between the Atlantic and Pacific Basins have normalized circumnavigating Africa via the Cape of Good Hope.
Transit Time & Cost Additions: Round-trip voyages between the U.S. Gulf Coast or Europe and Northeast Asia take 10 to 14 days longer around Africa compared to Suez Canal routes.Tonnage Absorption: The longer voyage durations effectively absorb global fleet capacity, tightening tanker availability and driving up charter rates.
2. Ship-to-Ship (STS) Transfers & Gulf of Oman Offloading
To reduce exposure inside the Persian Gulf, exporters have altered their shuttle strategies:
Outer Anchorages: Tankers exiting the Strait of Hormuz increasingly conduct Ship-to-Ship (STS) transfers off safer outer anchorages, such as Sohar in Oman, transferring gas onto secondary, long-haul carriers bound for Asia or Europe.Southern Corridor Preference: Vessels entering or exiting the Gulf have shifted heavily toward southern navigational lanes within regional channels to lower exposure to contested coastlines.
3. Structural Cargo Swaps & Regional Arbitrage
Rather than sending Middle Eastern cargoes across lengthy routes to Europe, global energy buyers have optimized geographic swaps:
Middle East → Asia Short Hauls: A larger portion of Middle Eastern LNG is channeled toward nearby Asian importers (such as India, China, and South Korea) via direct Indian Ocean transits, minimizing overall travel days.US & Atlantic → Europe: European buyers rely more heavily on short-haul Atlantic Basin supply (principally U.S. export terminals), which can reach Northwestern European regasification hubs without crossing Middle Eastern chokepoints.
Operational & Economic Impacts
$LNGX.ETF #BTC #FollowersGrowth #SupportCreators #TipsForBeginners
LNGXETF-3.01%
1
How have global LNG tanker charter rates and spot freight prices reacted to longer shipping routes?#us-irantalksfuelstrongstockmarketrebound
The relationship between longer shipping routes and LNG freight dynamics illustrates a unique market structural split: while ton-mile demand has surged dramatically, spot charter rates have behaved differently than crude or container shipping rates.
1. Ton-Mile Expansion vs. Fleet Supply Oversupply
Normally, taking the Cape of Good Hope route adds 3,500–4,000 nautical miles and 10–14 extra days per leg, which absorbs vessel capacity and spikes charter rates. However, LNG shipping has seen a distinct structural buffer:
Massive Newbuild Deliveries: Record LNG carrier (LNGC) orderbook deliveries over recent years expanded the global LNG fleet past 700+ vessels. This influx of new capacity has largely neutralized the fleet tightness that longer routes would normally create.Ton-Mile Surge: Even though U.S. LNG ton-miles jumped by over 55% as cargoes were forced around Africa or diverted east, available global shipping capacity absorbed the extra sea time without triggering severe systemic vessel shortages.
2. Spot Charter Rates vs. Crude/Container Rates
While crude tankers (VLCCs) and container ships saw spot rates surge on Middle East transit disruptions, LNG spot charter rates dropped or normalized due to ample regional vessel supply and muted spot cargo growth relative to fleet size:
Atlantic Basin Spot Rates: Traded around $40,000–$45,000/day, sharply down from previous multi-hundred-thousand spikes.Pacific Basin Spot Rates: Sustained a structural premium, holding near $69,000–$82,000/day due to tighter regional vessel availability and longer Asian distance draws.Two-Stroke Efficiency Split: Older steam-turbine LNGCs struggled to cover operational costs (earning <$10k–$15k/day), while modern 2-stroke mega-carriers commanded nearly all profitable long-haul charter demand.
3. Compounding Voyage & Operational Expenses
Even when day-charter rates remain subdued, the physical cost of completing an LNG voyage has risen significantly due to rerouting overhead:
$BTC $GAS #FollowersGrowth #SupportCreators #TipsNeeded
How have global LNG tanker charter rates and spot freight prices reacted to longer shipping routes?
#us-irantalksfuelstrongstockmarketrebound
The relationship between longer shipping routes and LNG freight dynamics illustrates a unique market structural split: while ton-mile demand has surged dramatically, spot charter rates have behaved differently than crude or container shipping rates.
1. Ton-Mile Expansion vs. Fleet Supply Oversupply
Normally, taking the Cape of Good Hope route adds 3,500–4,000 nautical miles and 10–14 extra days per leg, which absorbs vessel capacity and spikes charter rates. However, LNG shipping has seen a distinct structural buffer:
Massive Newbuild Deliveries: Record LNG carrier (LNGC) orderbook deliveries over recent years expanded the global LNG fleet past 700+ vessels. This influx of new capacity has largely neutralized the fleet tightness that longer routes would normally create.Ton-Mile Surge: Even though U.S. LNG ton-miles jumped by over 55% as cargoes were forced around Africa or diverted east, available global shipping capacity absorbed the extra sea time without triggering severe systemic vessel shortages.
2. Spot Charter Rates vs. Crude/Container Rates
While crude tankers (VLCCs) and container ships saw spot rates surge on Middle East transit disruptions, LNG spot charter rates dropped or normalized due to ample regional vessel supply and muted spot cargo growth relative to fleet size:
Atlantic Basin Spot Rates: Traded around $40,000–$45,000/day, sharply down from previous multi-hundred-thousand spikes.Pacific Basin Spot Rates: Sustained a structural premium, holding near $69,000–$82,000/day due to tighter regional vessel availability and longer Asian distance draws.Two-Stroke Efficiency Split: Older steam-turbine LNGCs struggled to cover operational costs (earning <$10k–$15k/day), while modern 2-stroke mega-carriers commanded nearly all profitable long-haul charter demand.
3. Compounding Voyage & Operational Expenses
Even when day-charter rates remain subdued, the physical cost of completing an LNG voyage has risen significantly due to rerouting overhead:
$BTC $GAS #FollowersGrowth #SupportCreators #TipsNeeded
The relationship between longer shipping routes and LNG freight dynamics illustrates a unique market structural split: while ton-mile demand has surged dramatically, spot charter rates have behaved differently than crude or container shipping rates.
1. Ton-Mile Expansion vs. Fleet Supply Oversupply
Normally, taking the Cape of Good Hope route adds 3,500–4,000 nautical miles and 10–14 extra days per leg, which absorbs vessel capacity and spikes charter rates. However, LNG shipping has seen a distinct structural buffer:
Massive Newbuild Deliveries: Record LNG carrier (LNGC) orderbook deliveries over recent years expanded the global LNG fleet past 700+ vessels. This influx of new capacity has largely neutralized the fleet tightness that longer routes would normally create.Ton-Mile Surge: Even though U.S. LNG ton-miles jumped by over 55% as cargoes were forced around Africa or diverted east, available global shipping capacity absorbed the extra sea time without triggering severe systemic vessel shortages.
2. Spot Charter Rates vs. Crude/Container Rates
While crude tankers (VLCCs) and container ships saw spot rates surge on Middle East transit disruptions, LNG spot charter rates dropped or normalized due to ample regional vessel supply and muted spot cargo growth relative to fleet size:
Atlantic Basin Spot Rates: Traded around $40,000–$45,000/day, sharply down from previous multi-hundred-thousand spikes.Pacific Basin Spot Rates: Sustained a structural premium, holding near $69,000–$82,000/day due to tighter regional vessel availability and longer Asian distance draws.Two-Stroke Efficiency Split: Older steam-turbine LNGCs struggled to cover operational costs (earning <$10k–$15k/day), while modern 2-stroke mega-carriers commanded nearly all profitable long-haul charter demand.
3. Compounding Voyage & Operational Expenses
Even when day-charter rates remain subdued, the physical cost of completing an LNG voyage has risen significantly due to rerouting overhead:
$BTC $GAS #FollowersGrowth #SupportCreators #TipsNeeded
32
How are natural gas futures and European gas benchmarks responding to Middle East developments#us-irantalksfuelstrongstockmarketrebound
Natural gas and LNG spot benchmarks are experiencing heightened volatility. Because gas markets are deeply linked through global Liquefied Natural Gas (LNG) trade routes, geopolitical headlines out of the Middle East produce instantaneous pricing shifts across major hubs: European Dutch TTF, U.S. Henry Hub, and Asian JKM.
1. European Benchmark: Dutch TTF
Geopolitical Risk Premium & De-escalation Moves: Following sharp geopolitical rallies earlier in autumn—when fears of Strait of Hormuz disruptions and LNG cargo delays pushed TTF contracts toward multi-month highs—recent reports of U.S.–Iran diplomatic progress triggered an immediate unwinding of the risk premium. Front-month TTF dropped from over $34.00/MMBtu (€88–€100/MWh) down to around $28.00–$29.00/MMBtu as de-escalation headlines hit trading desks.Underlying Tightness Prevents Deep Sell-offs: Despite temporary pullbacks on diplomatic headlines, European downside remains heavily constrained. EU underground gas storage levels (around 73%–74%) sit below historical 5-year averages for this time of year, leaving winter heating season fundamentals tight and keeping buyers quick to step back in on any price dips.
2. U.S. Benchmark: Henry Hub
Feedgas Demand & Export Arbitrage: While U.S. domestic supply remains relatively insulated by robust Lower 48 production, Henry Hub futures (trading around $3.00–$3.33/MMBtu) have shown strength.Global Interdependence: Elevated European and Asian prices keep domestic LNG liquefaction facilities running near peak capacity. Whenever Middle East tensions threaten global supply, Europe pulls heavily on U.S. spot LNG cargoes, keeping U.S. feedgas demand robust and pushing Henry Hub futures to multi-week highs.
3. Asian Benchmark: Platts JKM
Direct Competition with Europe: Asian spot LNG prices (JKM) mirror TTF dynamics, retreating from the mid-$34/MMBtu range to around $29.00–$31.00/MMBtu on positive negotiation headlines.Asia-Europe Spread: Because both regions compete for uncommitted, flexible Atlantic and Gulf Coast LNG cargoes, any Middle East disruption forcing rerouted trade drives JKM and TTF into near-parity as importers outbid each other for replacement supply.
Key Takeaway for Energy Markets
$ETFT.ETF $BTC #FollowersGrowth #SupportCreators #TipsForBeginners
How are natural gas futures and European gas benchmarks responding to Middle East developments
#us-irantalksfuelstrongstockmarketrebound
Natural gas and LNG spot benchmarks are experiencing heightened volatility. Because gas markets are deeply linked through global Liquefied Natural Gas (LNG) trade routes, geopolitical headlines out of the Middle East produce instantaneous pricing shifts across major hubs: European Dutch TTF, U.S. Henry Hub, and Asian JKM.
1. European Benchmark: Dutch TTF
Geopolitical Risk Premium & De-escalation Moves: Following sharp geopolitical rallies earlier in autumn—when fears of Strait of Hormuz disruptions and LNG cargo delays pushed TTF contracts toward multi-month highs—recent reports of U.S.–Iran diplomatic progress triggered an immediate unwinding of the risk premium. Front-month TTF dropped from over $34.00/MMBtu (€88–€100/MWh) down to around $28.00–$29.00/MMBtu as de-escalation headlines hit trading desks.Underlying Tightness Prevents Deep Sell-offs: Despite temporary pullbacks on diplomatic headlines, European downside remains heavily constrained. EU underground gas storage levels (around 73%–74%) sit below historical 5-year averages for this time of year, leaving winter heating season fundamentals tight and keeping buyers quick to step back in on any price dips.
2. U.S. Benchmark: Henry Hub
Feedgas Demand & Export Arbitrage: While U.S. domestic supply remains relatively insulated by robust Lower 48 production, Henry Hub futures (trading around $3.00–$3.33/MMBtu) have shown strength.Global Interdependence: Elevated European and Asian prices keep domestic LNG liquefaction facilities running near peak capacity. Whenever Middle East tensions threaten global supply, Europe pulls heavily on U.S. spot LNG cargoes, keeping U.S. feedgas demand robust and pushing Henry Hub futures to multi-week highs.
3. Asian Benchmark: Platts JKM
Direct Competition with Europe: Asian spot LNG prices (JKM) mirror TTF dynamics, retreating from the mid-$34/MMBtu range to around $29.00–$31.00/MMBtu on positive negotiation headlines.Asia-Europe Spread: Because both regions compete for uncommitted, flexible Atlantic and Gulf Coast LNG cargoes, any Middle East disruption forcing rerouted trade drives JKM and TTF into near-parity as importers outbid each other for replacement supply.
Key Takeaway for Energy Markets
$ETFT.ETF $BTC #FollowersGrowth #SupportCreators #TipsForBeginners
Natural gas and LNG spot benchmarks are experiencing heightened volatility. Because gas markets are deeply linked through global Liquefied Natural Gas (LNG) trade routes, geopolitical headlines out of the Middle East produce instantaneous pricing shifts across major hubs: European Dutch TTF, U.S. Henry Hub, and Asian JKM.
1. European Benchmark: Dutch TTF
Geopolitical Risk Premium & De-escalation Moves: Following sharp geopolitical rallies earlier in autumn—when fears of Strait of Hormuz disruptions and LNG cargo delays pushed TTF contracts toward multi-month highs—recent reports of U.S.–Iran diplomatic progress triggered an immediate unwinding of the risk premium. Front-month TTF dropped from over $34.00/MMBtu (€88–€100/MWh) down to around $28.00–$29.00/MMBtu as de-escalation headlines hit trading desks.Underlying Tightness Prevents Deep Sell-offs: Despite temporary pullbacks on diplomatic headlines, European downside remains heavily constrained. EU underground gas storage levels (around 73%–74%) sit below historical 5-year averages for this time of year, leaving winter heating season fundamentals tight and keeping buyers quick to step back in on any price dips.
2. U.S. Benchmark: Henry Hub
Feedgas Demand & Export Arbitrage: While U.S. domestic supply remains relatively insulated by robust Lower 48 production, Henry Hub futures (trading around $3.00–$3.33/MMBtu) have shown strength.Global Interdependence: Elevated European and Asian prices keep domestic LNG liquefaction facilities running near peak capacity. Whenever Middle East tensions threaten global supply, Europe pulls heavily on U.S. spot LNG cargoes, keeping U.S. feedgas demand robust and pushing Henry Hub futures to multi-week highs.
3. Asian Benchmark: Platts JKM
Direct Competition with Europe: Asian spot LNG prices (JKM) mirror TTF dynamics, retreating from the mid-$34/MMBtu range to around $29.00–$31.00/MMBtu on positive negotiation headlines.Asia-Europe Spread: Because both regions compete for uncommitted, flexible Atlantic and Gulf Coast LNG cargoes, any Middle East disruption forcing rerouted trade drives JKM and TTF into near-parity as importers outbid each other for replacement supply.
Key Takeaway for Energy Markets
$ETFT.ETF $BTC #FollowersGrowth #SupportCreators #TipsForBeginners
ETFTETF-0.41%
38
#us-irantalksfuelstrongstockmarketrebound
Reports of diplomatic progress and potential de-escalation between the United States and Iran have triggered a strong global stock market rebound, lifting major equity indices as geopolitical anxiety eases.
Key Market Reactions
Global Equities Surge: Wall Street benchmarks led the rally, with the S&P 500 up 2.35%, the Nasdaq surging 2.74%, and the Dow Jones adding 2.15%. International markets mirrored the gains, including sharp bounces across Asian and European tracking indices.
Crude Oil Pulls Back: Brent crude tumbled below $91 per barrel, hitting its lowest levels since August. Easing fears over disruptions in key transit zones like the Strait of Hormuz relieved acute inflation concerns.
Safe-Haven Assets Cool: Spot gold retreated down toward $4,032/oz as investors rotated out of safety assets and back into risk-on equities.
Short-Covering Fuel: Low institutional exposure and built-up short positions led to significant short-covering moves, accelerating momentum on the upside.
Core Drivers & Caveats
Energy Disinflation: A pullback in oil directly reduces input costs for transport, manufacturing, and consumer sectors while alleviating near-term central bank pressure to keep monetary policy tight.
Fragile Diplomacy: Despite the market optimism, analysts emphasize that without a formal, binding agreement or verified resolution, geopolitical headlines remain fluid, and sudden shifts could quickly test market support levels.
$BTC $FUEL #FollowersGrowth
#us-irantalksfuelstrongstockmarketrebound
Reports of diplomatic progress and potential de-escalation between the United States and Iran have triggered a strong global stock market rebound, lifting major equity indices as geopolitical anxiety eases.
Key Market Reactions
Global Equities Surge: Wall Street benchmarks led the rally, with the S&P 500 up 2.35%, the Nasdaq surging 2.74%, and the Dow Jones adding 2.15%. International markets mirrored the gains, including sharp bounces across Asian and European tracking indices.
Crude Oil Pulls Back: Brent crude tumbled below $91 per barrel, hitting its lowest levels since August. Easing fears over disruptions in key transit zones like the Strait of Hormuz relieved acute inflation concerns.
Safe-Haven Assets Cool: Spot gold retreated down toward $4,032/oz as investors rotated out of safety assets and back into risk-on equities.
Short-Covering Fuel: Low institutional exposure and built-up short positions led to significant short-covering moves, accelerating momentum on the upside.
Core Drivers & Caveats
Energy Disinflation: A pullback in oil directly reduces input costs for transport, manufacturing, and consumer sectors while alleviating near-term central bank pressure to keep monetary policy tight.
Fragile Diplomacy: Despite the market optimism, analysts emphasize that without a formal, binding agreement or verified resolution, geopolitical headlines remain fluid, and sudden shifts could quickly test market support levels.
$BTC $FUEL #FollowersGrowth
Reports of diplomatic progress and potential de-escalation between the United States and Iran have triggered a strong global stock market rebound, lifting major equity indices as geopolitical anxiety eases.
Key Market Reactions
Global Equities Surge: Wall Street benchmarks led the rally, with the S&P 500 up 2.35%, the Nasdaq surging 2.74%, and the Dow Jones adding 2.15%. International markets mirrored the gains, including sharp bounces across Asian and European tracking indices.
Crude Oil Pulls Back: Brent crude tumbled below $91 per barrel, hitting its lowest levels since August. Easing fears over disruptions in key transit zones like the Strait of Hormuz relieved acute inflation concerns.
Safe-Haven Assets Cool: Spot gold retreated down toward $4,032/oz as investors rotated out of safety assets and back into risk-on equities.
Short-Covering Fuel: Low institutional exposure and built-up short positions led to significant short-covering moves, accelerating momentum on the upside.
Core Drivers & Caveats
Energy Disinflation: A pullback in oil directly reduces input costs for transport, manufacturing, and consumer sectors while alleviating near-term central bank pressure to keep monetary policy tight.
Fragile Diplomacy: Despite the market optimism, analysts emphasize that without a formal, binding agreement or verified resolution, geopolitical headlines remain fluid, and sudden shifts could quickly test market support levels.
$BTC $FUEL #FollowersGrowth
78

LISTEN ..... LISTEN ..... LISTEN 🚨
Guys, I know you are waiting for a signal, but I didn’t share a trade today 😥 because the market is very tricky right now.
I don’t want my followers to suffer losses. Protecting your capital is more important than taking unnecessary risks.
Stay patient and trade carefully.
#FollowersGrowth
LISTEN ..... LISTEN ..... LISTEN 🚨
Guys, I know you are waiting for a signal, but I didn’t share a trade today 😥 because the market is very tricky right now.
I don’t want my followers to suffer losses. Protecting your capital is more important than taking unnecessary risks.
Stay patient and trade carefully.
#FollowersGrowth
Guys, I know you are waiting for a signal, but I didn’t share a trade today 😥 because the market is very tricky right now.
I don’t want my followers to suffer losses. Protecting your capital is more important than taking unnecessary risks.
Stay patient and trade carefully.
#FollowersGrowth

8
2
1.5k

·
--
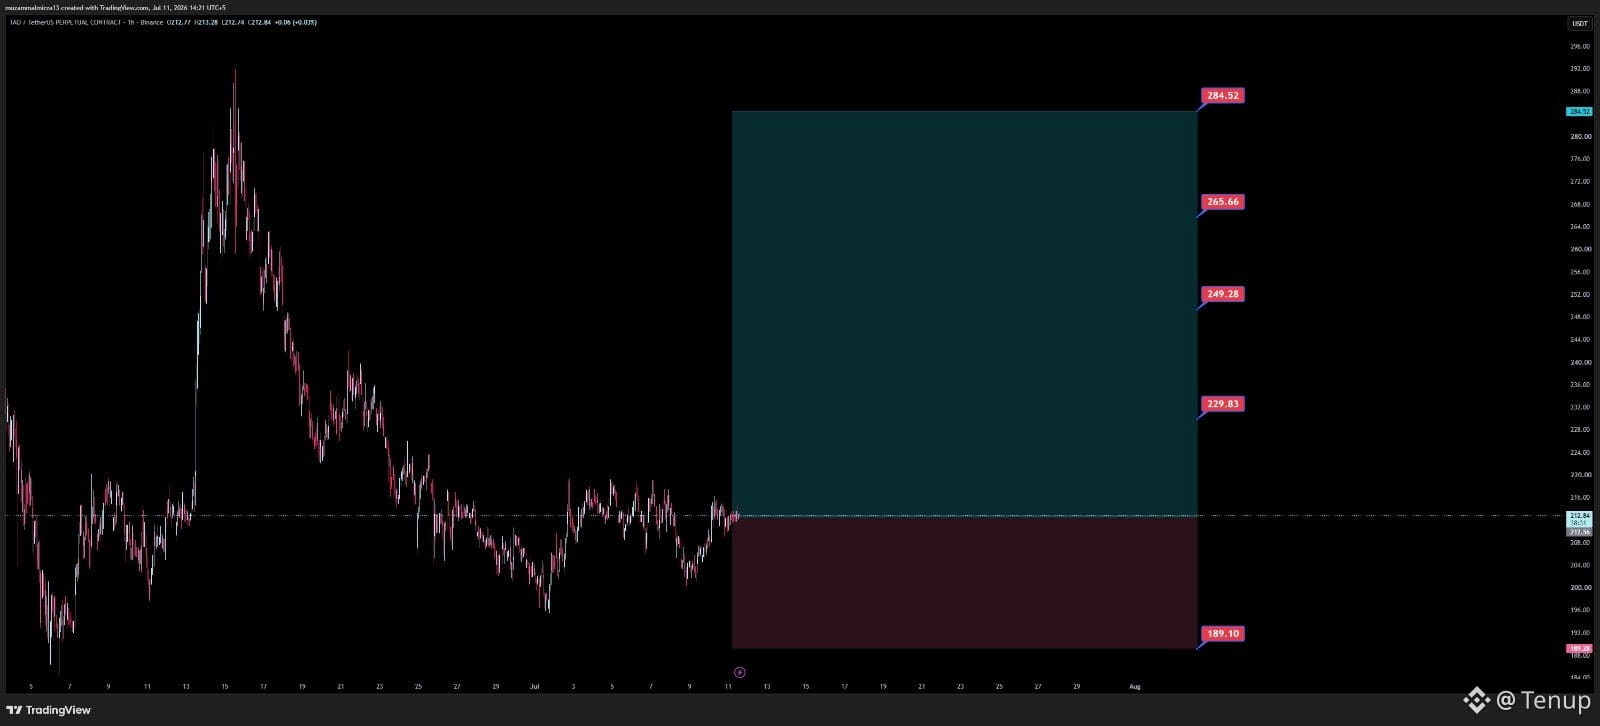
Long + Spot (#TAO USDT)
Entry NOW : 212.84$ and 2nd entry For price avrg : 195-200$ price zone
TP SL Mention on chart... (wallet risk 1-2%) or ya trade lamby time k liye chal skti.. mean kuch din b holding mai chal skti.
#FollowersGrowth
Long + Spot (#TAO USDT)
Entry NOW : 212.84$ and 2nd entry For price avrg : 195-200$ price zone
TP SL Mention on chart... (wallet risk 1-2%) or ya trade lamby time k liye chal skti.. mean kuch din b holding mai chal skti.
#FollowersGrowth
Entry NOW : 212.84$ and 2nd entry For price avrg : 195-200$ price zone
TP SL Mention on chart... (wallet risk 1-2%) or ya trade lamby time k liye chal skti.. mean kuch din b holding mai chal skti.
#FollowersGrowth
108
තවත් අන්තර්ගතයන් ගවේෂණය කිරීමට ඇතුල් වන්න
Binance චතුරශ්රය හි ගෝලීය ක්රිප්ටෝ පරිශීලකයින් හා එක්වන්න
⚡️ ක්රිප්ටෝ පිළිබඳ නවතම සහ ප්රයෝජනවත් තොරතුරු ලබා ගන්න.
💬 ලොව විශාලතම ක්රිප්ටෝ හුවමාරුව මගින් විශ්වාස කෙරේ.
👍 සත්යායනය කරන ලද නිර්මාණකරුවන්ගෙන් සැබෑ විදසුන් සොයා ගන්න.
විද්යුත් තැපෑල / දුරකථන අංකය
නැගී එන මාතෘකා
1
#A Packed Week of Earnings and Data Tests Markets
68,063 නැරඹීම්
434 සාකච්ඡා කරමින්
2
#AnthropicIPOTestsInvestorAppetiteForAI
133,741 නැරඹීම්
1,488 සාකච්ඡා කරමින්
3
#NvidiaBoardNotConsideringHuang’sReturnasCEO
1,929 නැරඹීම්
63 සාකච්ඡා කරමින්
4
#WhatInvestmentSignalsDo13FFilingsReveal?
908 නැරඹීම්
43 සාකච්ඡා කරමින්
5
#SevenUSBanksDisclose$29.4MInXRPETFHoldings
22 නැරඹීම්
6 සාකච්ඡා කරමින්
6
#InvescoStablecoinReservesFundLaunchesOnEthereum
82 නැරඹීම්
8 සාකච්ඡා කරමින්
7
#CypherpunkReports$306MQ3NetProfit
408 නැරඹීම්
8 සාකච්ඡා කරමින්
8
#OPTIMJACKAttackInfectsAtLeast186Websites
1,378 නැරඹීම්
45 සාකච්ඡා කරමින්
9
#StrategySells2.09MMSTRSharesFor$244.7M
823 නැරඹීම්
13 සාකච්ඡා කරමින්
10
#StablecoinMarketShrinksAtFastestPaceSinceTerraLuna
1,454 නැරඹීම්
34 සාකච්ඡා කරමින්