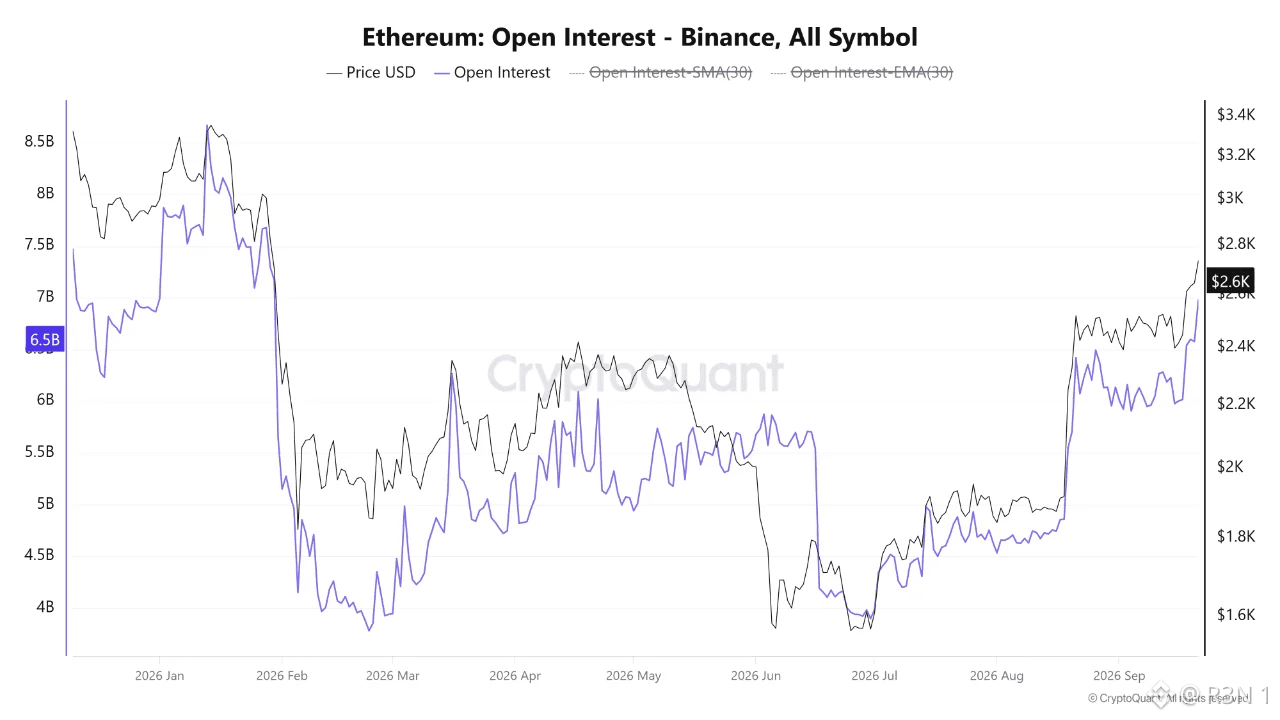
ETH open interest on Binance just hit a nine-month high, and whether that's bullish confirmation or leverage risk depends entirely on a detail this data alone can't answer. Open interest climbed from around $4.8 billion in late August to roughly $6.58 billion now, a genuine acceleration through September, not a slow drift. That coincided with ETH climbing to about $2,644, price and open positions rising together. Here's the part I'd push back on in how this usually gets framed. Rising OI alongside rising price gets read as automatically bullish, more capital, more participation, stronger conviction. That's true as far as it goes, but it's incomplete without knowing the mix. Rising OI can mean fresh longs entering with real conviction, or it can mean shorts getting trapped and adding to losing positions before eventually capitulating, or some combination of both happening at once. The dollar figure alone doesn't distinguish between those scenarios. What would actually settle this is funding rates and the long/short ratio over the same window, neither of which is in this dataset. Elevated positive funding alongside this OI climb would support the "genuine bullish participation" read. Funding staying flat or negative while OI expands this fast would suggest a more contested market, sellers pressing against a rally rather than buyers driving it cleanly. Worth being direct about the risk side too, regardless of which scenario this turns out to be. A nine-month high in open interest means more leveraged capital sitting exposed to price swings than at any point since January. That cuts both ways, it can fuel continuation if the move holds, or accelerate a reversal fast if price turns and forces liquidations on the side that's overextended. The open question isn't whether participation increased, the OI number confirms that plainly. It's which side actually added that exposure, and that's the piece this specific report leaves out. #BTC Price Analysis# $ETH

Посты

--
Отказ от ответственности. Содержит мнения третьих сторон. Не является рекомендацией. Binance AI не предоставляет гарантий. См. Правила и условия.