

🔥 GUSDT — Is There a Bigger Move Coming?
Before jumping into GUSDT, there is one thing traders should understand: this is not a coin that should automatically be analyzed like BTC or other high-volatility altcoins.
Indicators:
Overall indication: 🟢 Short-term bullish, but overheated.
That means the trend is currently strong, but entering after a large pump carries increased pullback risk. This is particularly important for Futures/leverage.
💡 My watchlist setup:
Volume → Structure → Breakout → Retest → Confirmation
📈 Trend: Bullish on the short-term/hourly structure.
⚠️ RSI: ~78 on the hourly chart → overbought.
⚠️ Daily RSI: ~76 → also overbought.
📊 ADX: ~42 → strong trend.
🔥 Volume: very high, confirming strong activity.
🟢 Price is above the 50/200 EMA on the available technical analysis.
⚠️ Momentum indicators are showing signs that a pullback/cooling period is possible.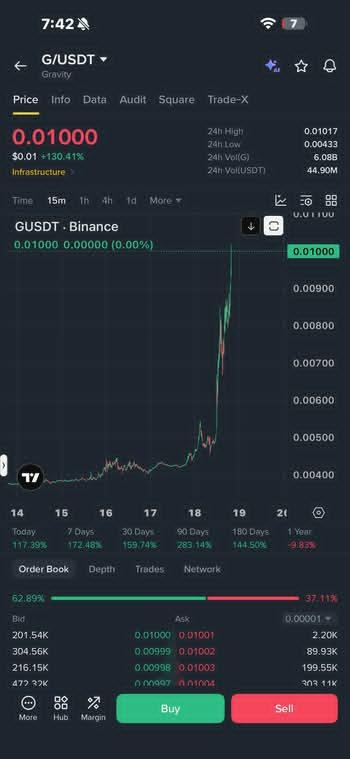

#GUSDT #Binance #BitcoinSpotETFsNetInflow$159M #GUSDT #Altcoins #CryptoAnalysis #BinanceSquare #Breakout #Infrastructure