
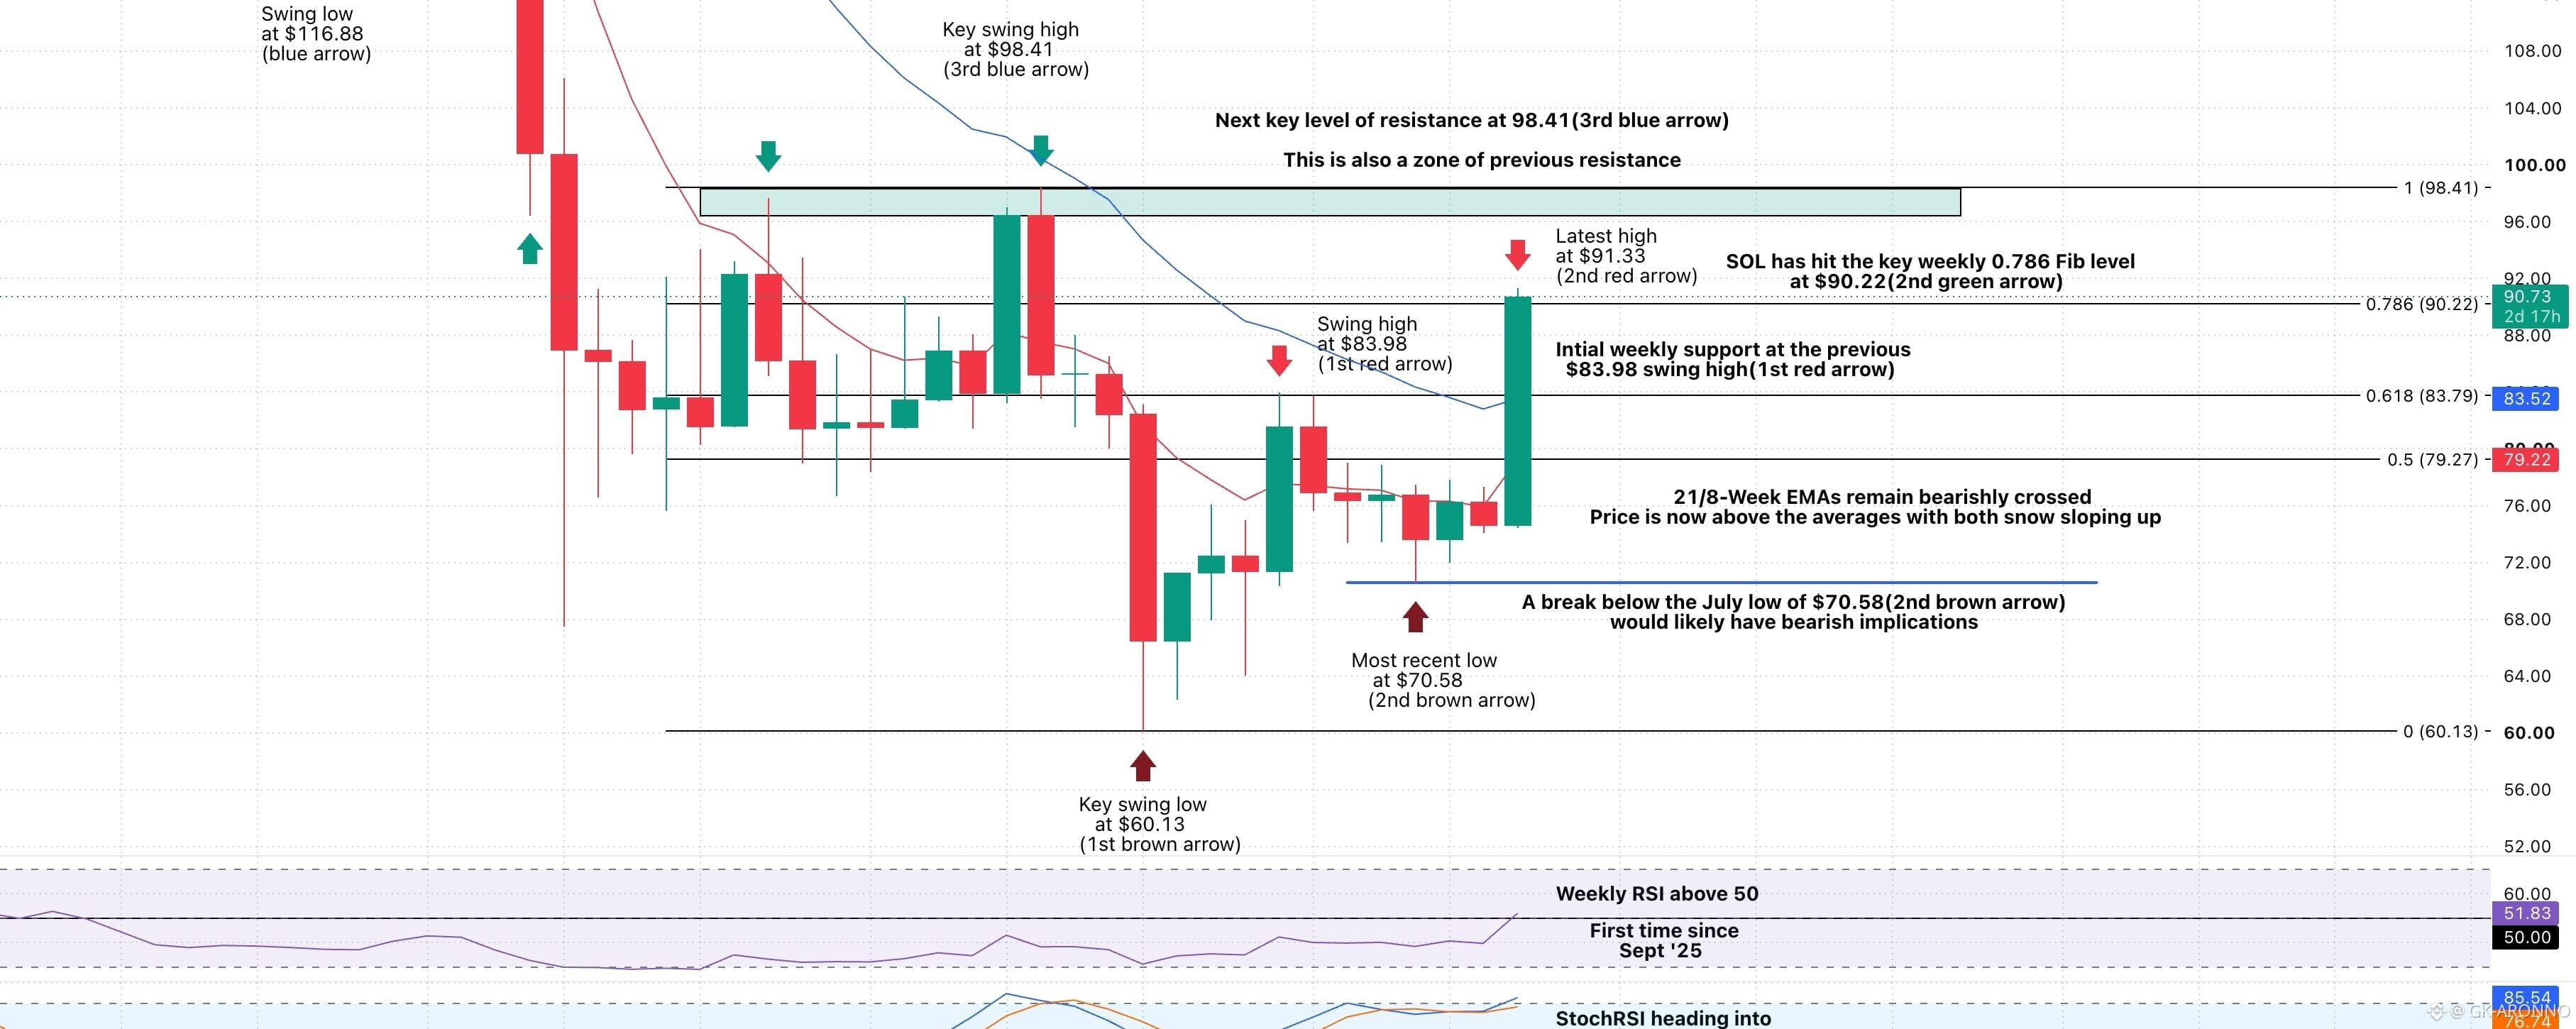

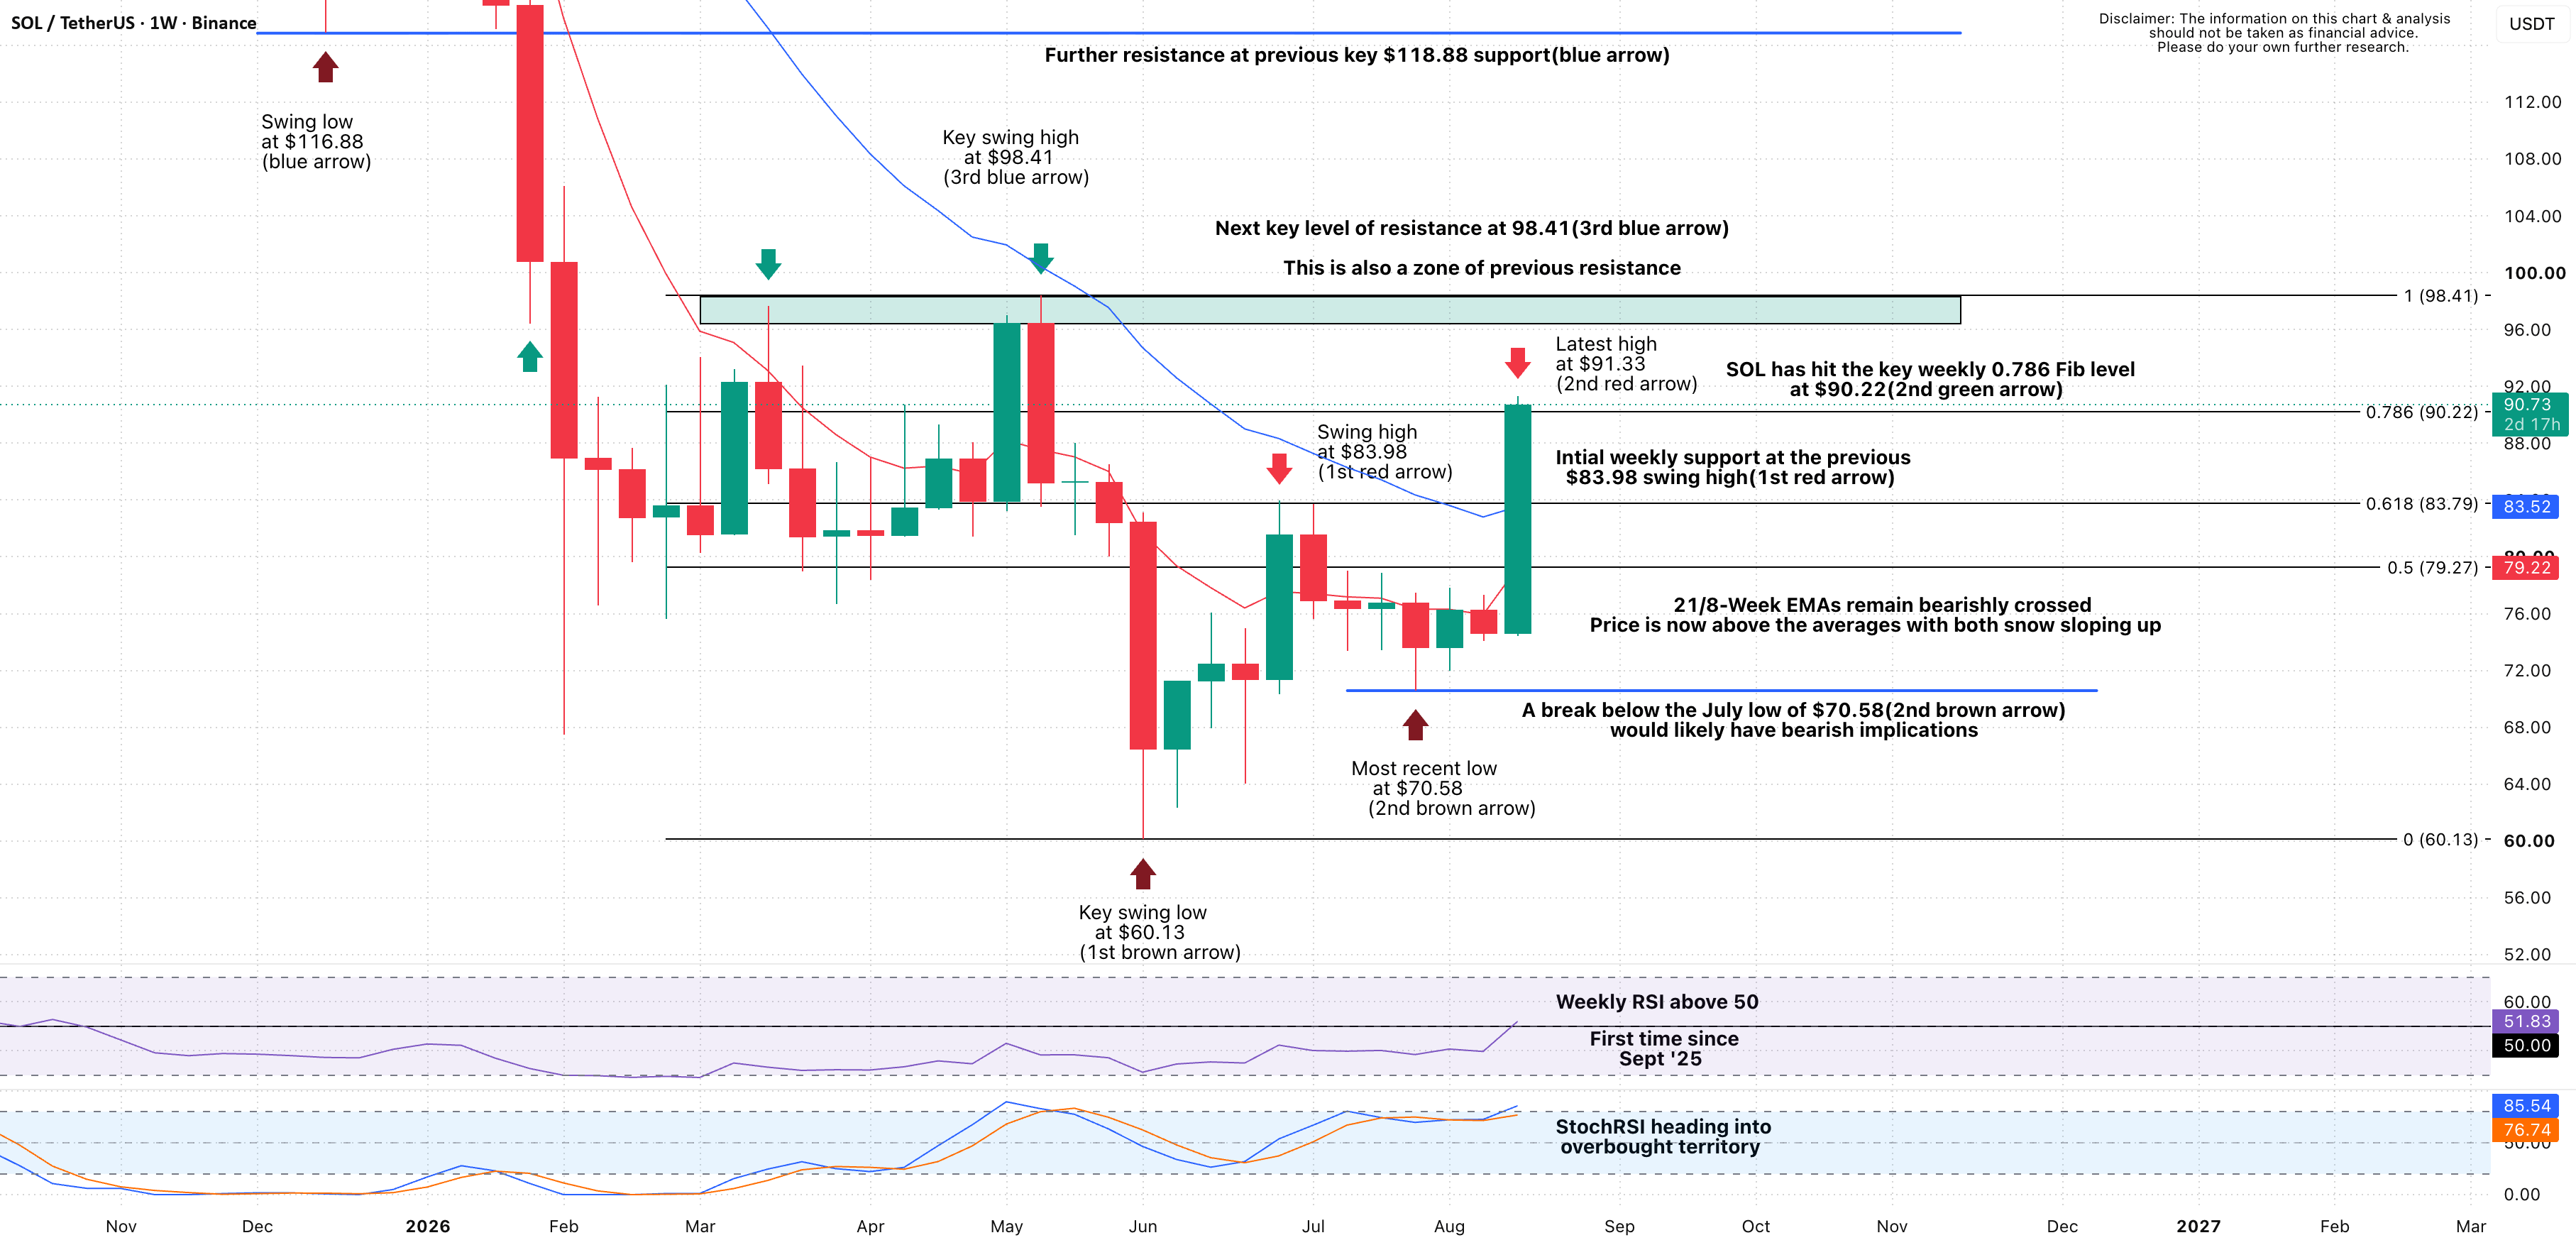
Solana is certainly not alone in the strong upside seen across the crypto market over the last couple of days. SOL’s weekly candle has surged more than 20%, reaching a new recent high at $91.33 and dramatically improving the short-term picture.
0.786 Fib Now Being Tested
That powerful weekly candle has now reached and found interest around the key 0.786 Fibonacci level at $90.22. After such an aggressive move higher, this is an important technical hurdle and an obvious area for sellers to attempt to slow the advance.
Weekly Momentum Continues to Improve
There are encouraging signs underneath the move. Weekly RSI has climbed above 50 for the first time since September 2025, while price has also pushed back above the bearishly crossed 21/8-Week EMAs, with both averages beginning to slope higher.
Next Major Test Sits Around $98.41
A convincing break above the 0.786 Fib would shift attention towards the $98.41 area. This represents both a previous key swing high and an established zone of resistance, making it an even more significant test should bulls continue pushing higher.
Former Resistance Could Become Support
Should Solana cool following this explosive weekly candle, the previous $83.98 swing high provides an initial area to watch. This sits close to the 0.618 Fib at $83.79, creating an interesting area of confluence that bulls would ideally want to defend.
In Summary
Solana has joined the powerful upside seen across crypto, with its weekly candle gaining more than 20% and reaching $91.33 before finding interest around the 0.786 Fib at $90.22. Momentum has improved considerably, with weekly RSI reclaiming 50 and price moving above the 21/8-Week EMAs. A convincing break higher would put $98.41 firmly in focus, while any pullback could see the $83.79–$83.98 area become an important first test.
