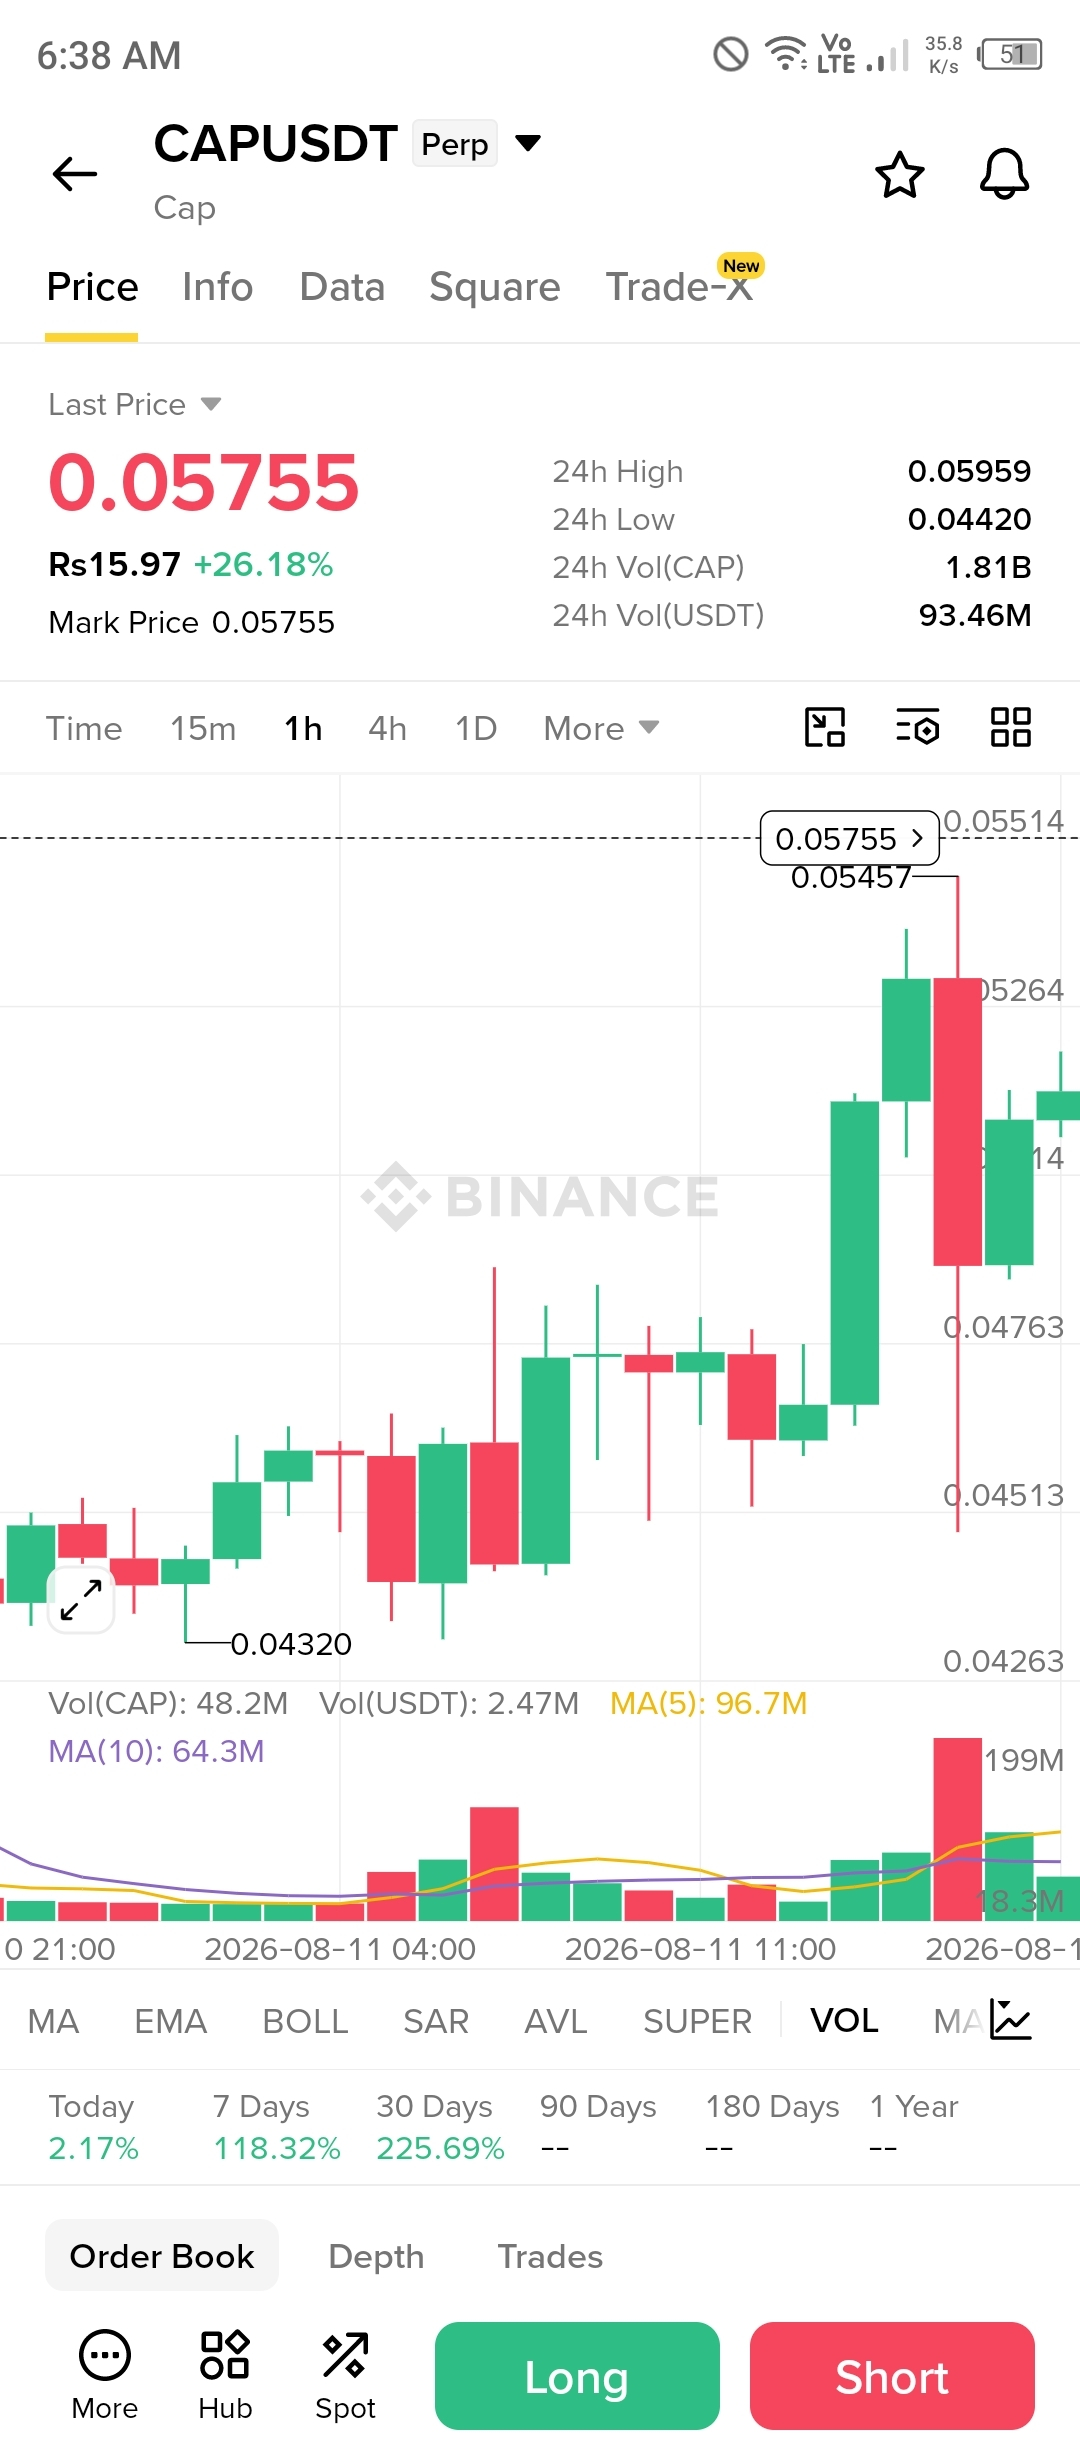
CAP has caught my attention on the 1H chart because the structure is clearly shifting in favor of buyers. Price is currently around $0.05755, up approximately 26.18% in 24 hours, and the move has been supported by a noticeable expansion in trading volume.
What stands out to me is the progression from the $0.0432 area. Price spent a good amount of time moving sideways, building a base, and then buyers finally started stepping in. From there, we saw higher pushes toward $0.0476, followed by another strong expansion toward the $0.0526–$0.0545 zone.
The latest move took price as high as $0.05959, which is also very close to the major resistance visible on the chart.
📈 The Structure Looks Strong
I’m seeing a sequence of higher lows developing on the 1H timeframe. That’s important because it shows buyers are not simply creating one random pump — they’re gradually pushing the market upward.
The strongest confirmation came when CAP moved above the previous $0.0476 area with increasing volume.
However, the rejection from around $0.0595–$0.0600 deserves attention.
Price briefly pushed higher, sellers responded aggressively, and we got a large red candle. The good thing is that buyers didn't completely disappear afterward. Price recovered back toward the $0.057 region.
That tells me demand is still present.
🔑 Levels I’m Watching
Immediate support: $0.0545–$0.0550
This is the first area I want to see buyers defend. Holding above this zone would keep the current bullish structure intact.
Secondary support: $0.0520–$0.0530
If the market pulls back deeper, this becomes an important reaction area. A successful bounce here could provide another opportunity for buyers to regain momentum.
Major support: $0.0475–$0.0480
This is a much more important structural level. Losing it would weaken the current bullish setup considerably.
🚀 Resistance Zone
The biggest obstacle right now is $0.0595–$0.0600.
Price has already tested this area and faced rejection. A clean 1H breakout above $0.0600, preferably with strong volume and a successful retest, would be the signal that I’d take seriously.
If buyers manage to establish acceptance above that level, the next psychological areas I’d watch are:
$0.0620 → $0.0650 → $0.0700
The exact path won't be straight, especially after a 26% daily move, so I’d expect some volatility along the way.
📊 Volume Is Confirming the Move
Volume is another reason I’m keeping CAP on my radar.
The chart shows noticeably larger volume during the recent upward expansion, including a major spike around the latest rejection. High volume around a breakout can confirm genuine participation, but the spike also tells me that there is heavy two-way trading happening here.
That means I wouldn't blindly chase CAP at the current level.
I’d rather see whether the market can hold $0.0545–$0.0550 and build another base before attempting the next breakout.
🎯 My Take
For me, the chart is bullish above the $0.0545 area.
As long as buyers continue defending the higher-low structure, I’m interested in another attempt at the $0.0595–$0.0600 resistance.
A decisive breakout could open the door toward $0.062 → $0.065 → $0.070.
On the other hand, if CAP loses $0.0545 with heavy selling, I’d expect a deeper retracement toward $0.052 and potentially $0.0475–$0.0480.
So I’m not looking at this as a simple “price is going up” setup. The real battle is happening right now between $0.0545 support and $0.0600 resistance.
Break $0.0600 with volume = bullish continuation becomes much more interesting.
Lose $0.0545 = momentum starts cooling and a deeper pullback becomes likely.
For now, buyers still have the advantage — but I want confirmation rather than chasing the move after a strong 26% daily expansion. 🔥📊
Chart-based analysis only, not financial advice. Perpetual futures can move extremely quickly, so risk management is essential.