Bitcoin ( $BTC ) is once again behaving like a market that’s shaking out weak hands while quietly inviting patient capital back in. After a volatile start to February, price action has stabilized into a range where “smart money” typically goes to work: not by chasing green candles, but by buying when sentiment is messy, leverage is flushing out, and headlines feel conflicted.
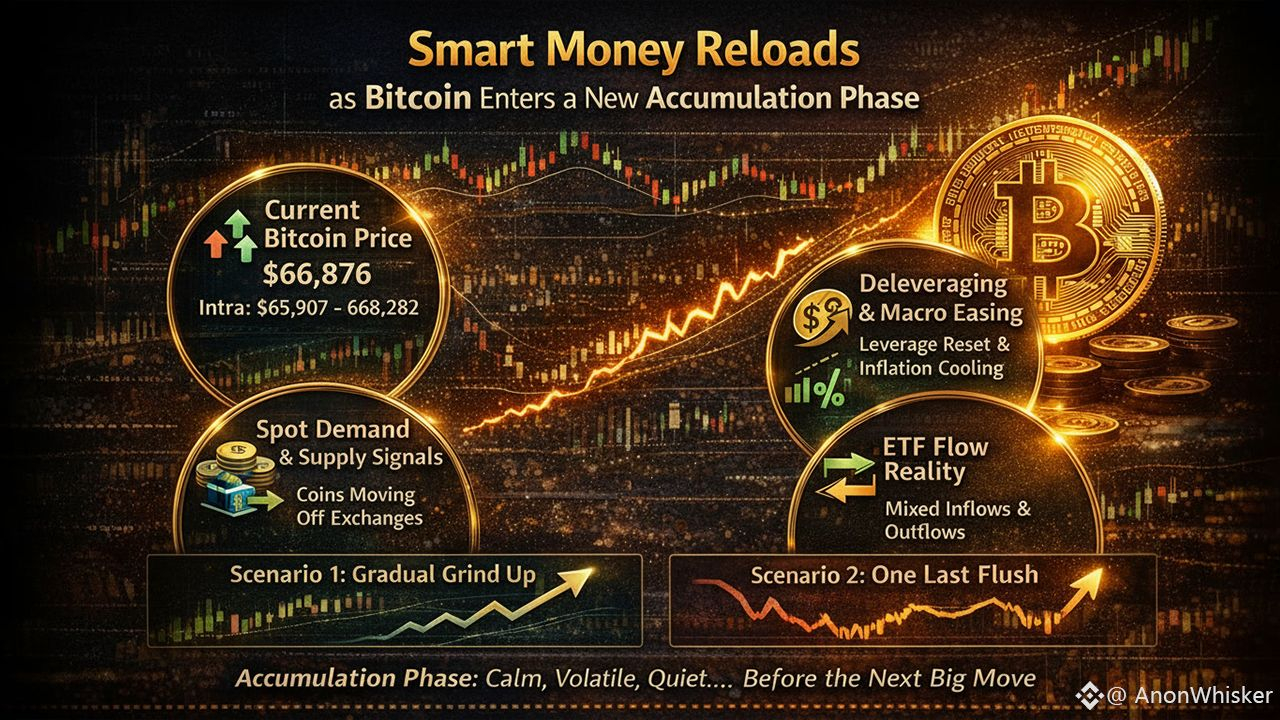
As of today, Bitcoin is trading around $66,876 (intraday range roughly $65,907–$68,282). That level matters less as a “number” and more as a signal: the market is no longer trending cleanly, it’s digesting and digestion phases are where accumulation often hides.
What Accumulation Phase Really Means? (And What It Doesn’t)
An accumulation phase isn’t a guarantee of an immediate rally. It’s a process where stronger hands build positions while price moves sideways or chops lower, typically after a period of sharp selling or deleveraging.
It usually looks like:
Reduced directional momentum, more range trading
Leverage cooling off after a fast move down
Spot demand gradually absorbing supply
Coins moving off exchanges or into longer-horizon custody
It does not mean:
“Bottom is 100% confirmed”
“Up-only starts tomorrow”
“No more volatility”
Why Smart Money Often Buys Here?
Deleveraging creates better entries
Some recent commentary has framed the February drawdown as an orderly deleveraging event (leverage resetting) rather than a panic-driven capitulation. In practical terms, that’s the kind of environment where disciplined buyers can scale in while forced sellers finish selling.Macro pressure is easing, even if slowly
January U.S. inflation data showed CPI up 0.2% (seasonally adjusted) in January and 2.4% year-over-year, with core CPI up 0.3% on the month.
Lower inflation doesn’t automatically pump Bitcoin, but it can reduce the “rates higher forever” fear that tightens financial conditions and drains liquidity.Supply behavior is flashing mixed but interesting signals
One narrative getting attention: miners and larger holders shifting coins away from exchanges (often interpreted as less immediate sell pressure). A CryptoQuant-linked data point circulating in news coverage claims ~36,000 BTC has been withdrawn from exchanges since early February, tied to miner behavior.
These are directional signals not perfect predictors but they matter when paired with price stabilization.
The ETF Flow Reality: Not a One-Way Street
Spot Bitcoin ETFs can act like a demand engine, but flows are not consistently positive day after day especially in risk-off weeks. For example, one recent “flash” update cited a $105M net outflow day (Feb 17).
The takeaway: ETF flows are a regime indicator, not a daily trading signal.
Sustained inflows over weeks = supportive backdrop
Choppy flows = market still deciding risk appetite
Persistent outflows = accumulation may take longer (or price may need to go lower to find real demand)
For tracking, datasets from The Block and Glassnode are widely used references.
On-Chain “Accumulation” Is Not One Opinion Right Now
A key point many traders miss: on-chain interpretations can disagree at turning points.
Some reports suggest long-term holders are resuming accumulation (a classic “smart money reload” sign).
Others push the opposite view, warning of a bear-cycle confirmation or pointing to recent net selling by longer-term cohorts.
That disagreement is normal near inflection points. When everyone agrees, the move is often already well underway.
Where Accumulation Usually Shows Up First?
If Bitcoin is truly entering a new accumulation phase, it typically shows up in three places before the breakout headlines arrive:
A) Range structure and repeated defense
Price revisits the same support zone multiple times, but sellers fail to push it materially lower. That repeated defense is often the “quiet bid” of larger buyers.
B) Spot vs. derivatives behavior
Healthy accumulation tends to coincide with:
Lower funding rates (less crowded longs)
Open interest resetting (less forced liquidation risk)
Better spot-led moves instead of perpetual-led spikes
C) Exchange balance / custody shifts
Coins moving away from exchanges can reduce immediate sell supply, although it’s not always bullish (coins can move for many reasons). The key is whether the market holds support while these shifts occur.
The Two Scenarios to Watch Next
Scenario 1: “Slow Grind Up” (Most common in accumulation)
What you’d see:
Bitcoin holds a base, prints higher lows
ETF flow stabilizes, even if not explosive
Volatility compresses before expansion
What it implies:
Smart money is successfully absorbing supply and doesn’t need to chase price.
Scenario 2: “One More Flush” (Also common)
What you’d see:
A sharp wick below support, quick recovery
Panic narratives spike briefly
Then price returns to the range and stabilizes
What it implies: Late sellers capitulate, providing final liquidity for larger buyers.
Practical Smart Money Playbook (How big money typically approaches it)
This is not financial advice just a framework for understanding behavior:
Scale in, don’t snipe the bottom. Accumulation is often built in tranches.
Respect time. The market can chop for weeks before it trends.
Watch regime signals: inflation trend, liquidity conditions, ETF flow persistence, and leverage temperature.
Focus on invalidation: a clean breakdown of the established range is usually more important than any single bullish metric.
Bitcoin at ~$66.9K is not just a price it’s a decision zone. The mix of leverage reset narratives, macro inflation easing, and evolving supply behavior creates the exact kind of environment where patient capital often reloads.
But the market is also honest: ETF flows are not guaranteed, and on-chain “accumulation” signals are currently debated meaning conviction hasn’t fully returned across all cohorts.
