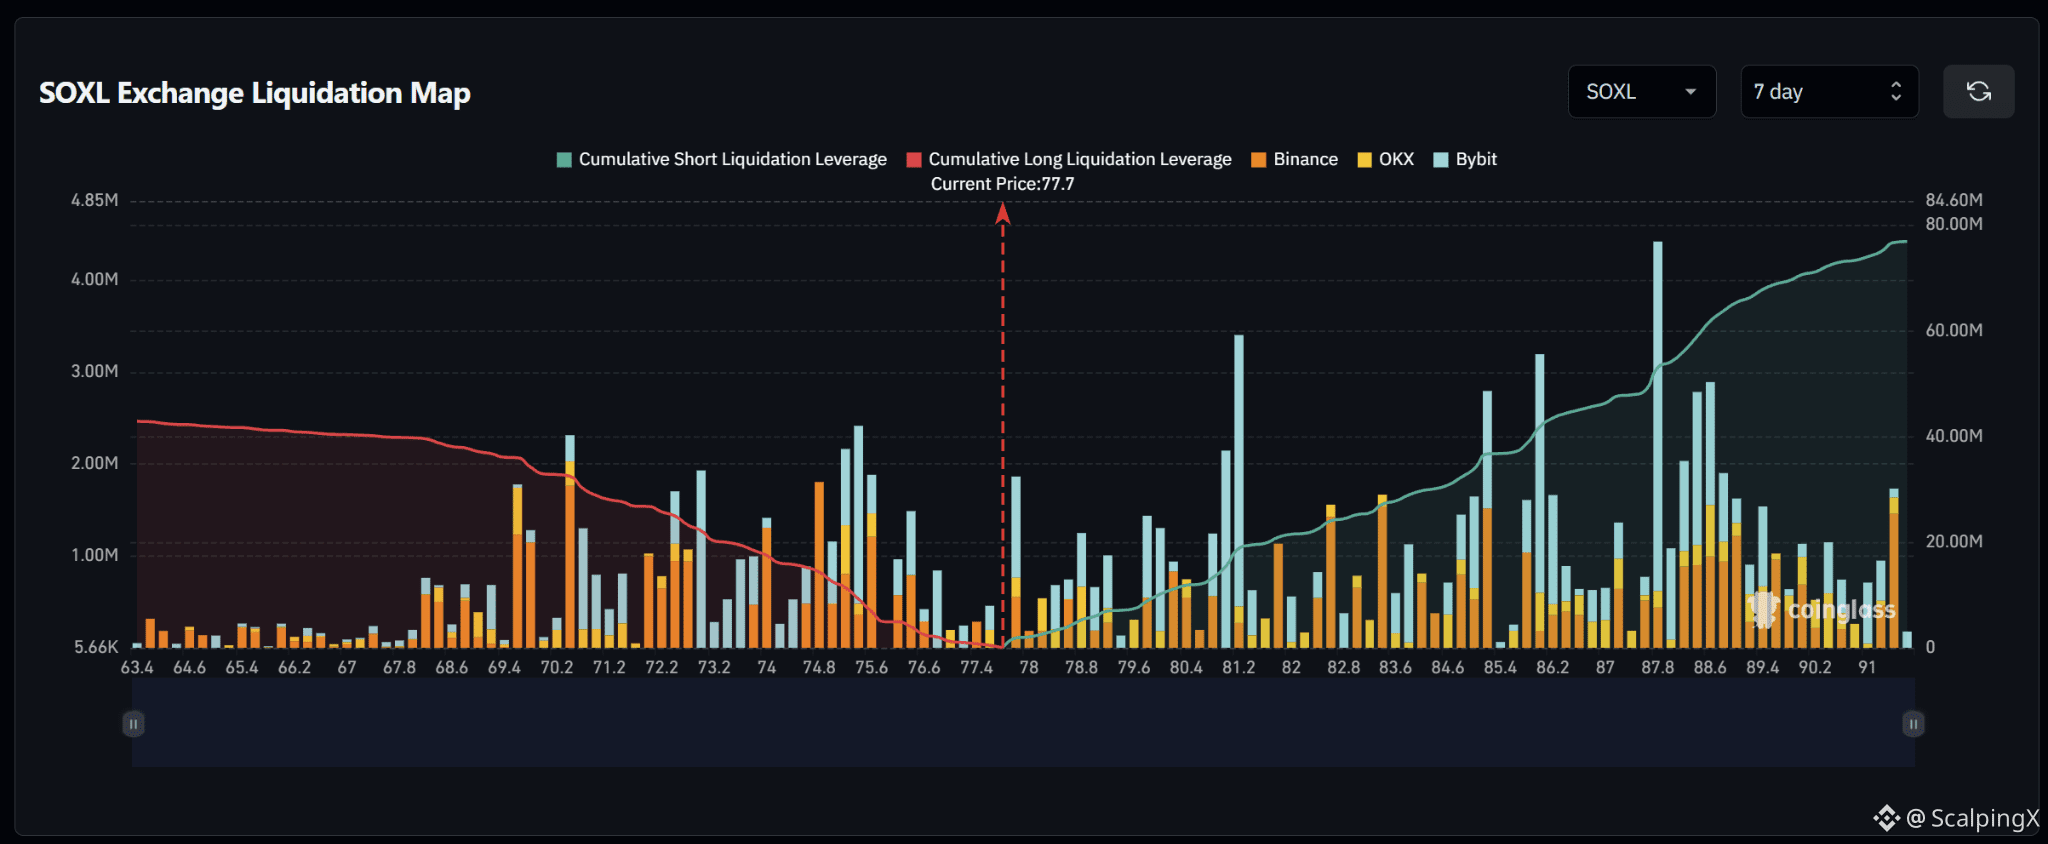
$SOXL – Liquidation Map (7 days) – Index ~77.7
🧭 The map favors an upside short sweep. Estimated cumulative short liquidation exposure is nearly $77M, versus roughly $43M on the long side across the displayed range. The nearest short cluster sits around 77.8–78.0.
🔺 A break and hold above 78.0 shifts attention to 78.6–78.9 and 79.8–80.2. Next is 81.0–81.3, where density rises noticeably; short liquidations there could amplify the advance.
🎯 Holding above 81.3 after a sweep brings 82.6–83.5, then 84.8–86.2, into focus. The 87.6–89.0 band remains a farther target, particularly near 87.8, which has the largest liquidation bar on the map.
⚖️ Losing 77.4 without a reclaim weakens the upside bias and shifts attention to 76.5–76.8, then the larger long cluster at 75.0–75.6. Avoid chasing a sweep of 81.0–81.3 that quickly falls back below 81.0.
#LiquidationMap