

MAFIA COINS FAMILY
393 Публикации

MAFIA COINS FAMILY
Отправить жалобу
Заблокировать пользователя
170 подписок(и/а)
141 подписчиков(а)
55 понравилось
Посты
Все
Цитирования
#earningsseasons $XAUT
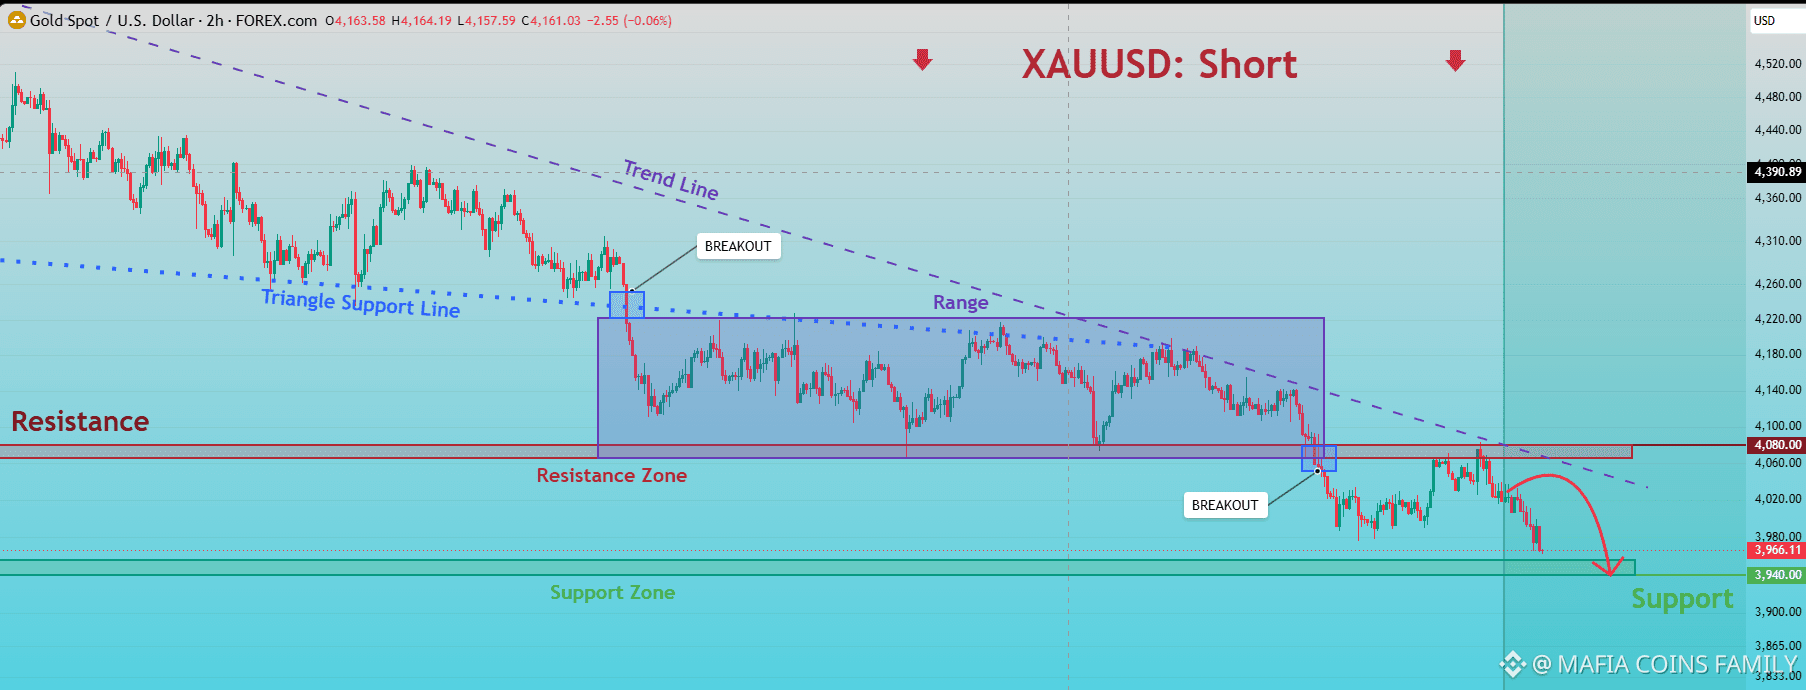
XAUUSDT (Gold) – 2H Technical Analysis
There are four important developments:
Gold formed a descending triangle with lower highs.
The triangle support around $4,220 broke down.
Price consolidated between approximately $4,060 and $4,220.
The second breakdown below $4,060–$4,080 confirmed further bearish pressure.
The previous support has now turned into resistance.
Important price levels
Price
Technical significance
$4,220
Major range resistance
$4,080–$4,060
Major broken support / resistance
$4,020
Minor resistance
$3,980
Near-term support
$3,940
Major immediate support
$3,900
Next downside target
$3,865–$3,833
Lower support area
Bearish continuation
Bearish setup
Gold breaks below $3,940.
A 2H candle closes below support.
A retest of $3,940–$3,960 fails.
Potential targets:
$3,900
$3,865
$3,833
This would support your bearish projection.
Bullish temporary recovery
Countertrend bounce
$XAU
{future}(XAUUSDT)
If $3,940 holds:
Gold may recover toward $3,980.
Next resistance: $4,020.
Stronger resistance: $4,060–$4,080.
A bounce alone does not reverse the bearish trend. Gold needs to reclaim $4,080 convincingly to weaken the bearish structure.
Support breakdown and reversal
Gold could briefly break below $3,940, trigger stop losses, and recover above the level.
Watch for:
Long lower wick.
Strong bullish 2H candle.
Reclaim of $3,960–$3,980.
That would indicate a possible liquidity sweep rather than a confirmed breakdown.
{future}(XAUTUSDT)
#earningsseasons $XAUT
XAUUSDT (Gold) – 2H Technical Analysis
There are four important developments:
Gold formed a descending triangle with lower highs.
The triangle support around $4,220 broke down.
Price consolidated between approximately $4,060 and $4,220.
The second breakdown below $4,060–$4,080 confirmed further bearish pressure.
The previous support has now turned into resistance.
Important price levels
Price
Technical significance
$4,220
Major range resistance
$4,080–$4,060
Major broken support / resistance
$4,020
Minor resistance
$3,980
Near-term support
$3,940
Major immediate support
$3,900
Next downside target
$3,865–$3,833
Lower support area
Bearish continuation
Bearish setup
Gold breaks below $3,940.
A 2H candle closes below support.
A retest of $3,940–$3,960 fails.
Potential targets:
$3,900
$3,865
$3,833
This would support your bearish projection.
Bullish temporary recovery
Countertrend bounce
$XAU
If $3,940 holds:
Gold may recover toward $3,980.
Next resistance: $4,020.
Stronger resistance: $4,060–$4,080.
A bounce alone does not reverse the bearish trend. Gold needs to reclaim $4,080 convincingly to weaken the bearish structure.
Support breakdown and reversal
Gold could briefly break below $3,940, trigger stop losses, and recover above the level.
Watch for:
Long lower wick.
Strong bullish 2H candle.
Reclaim of $3,960–$3,980.
That would indicate a possible liquidity sweep rather than a confirmed breakdown.
1
625
Security Incident Update
Security Incident Update


Binance Announcement
·
--
Security Incident Update (2026-10-30)
This is a general announcement. Products and services referred to here may not be available in your region.
Fellow Binancians,
Binance's initial investigation suggests that the security incident may involve a compromised DevOps engineer’s laptop, which allowed an attacker to gain access to a service container and submit unauthorized withdrawal transactions. We have found no evidence of any wallet private key leak. We will share a detailed technical post-mortem once the investigation is complete and the facts are fully verified.
The estimated total impact sits at around $6.3B. We have worked with blockchain partners to freeze affected assets, with ~$3 billion frozen on-chain so far.
Binance will cover all losses from the SAFU fund and the company’s funds. User funds are safe. We will also publish an updated Proof of Reserves once the remediation is complete.
As an immediate precaution, Binance has:
temporarily suspended withdrawals while security checks are completed;revoked the affected address authorisation;engaged law enforcement and blockchain intelligence partners to trace and recover funds.
Our teams are working around the clock to resolve this issue safely and thoroughly. We are working closely with our law enforcement partners to confirm the identity of these criminals and bring them to justice.
Please rely only on official Binance channels for updates. Please feel free to contact Binance Customer Support if you have any further questions.
Thank you for your support!
Binance Team
2026-10-30
Note: This announcement was updated on 2026-10-30 to clarify deposits remain unaffected and continue to operate as normal.
89
#earningsseasons $BTC $BTC $BTC
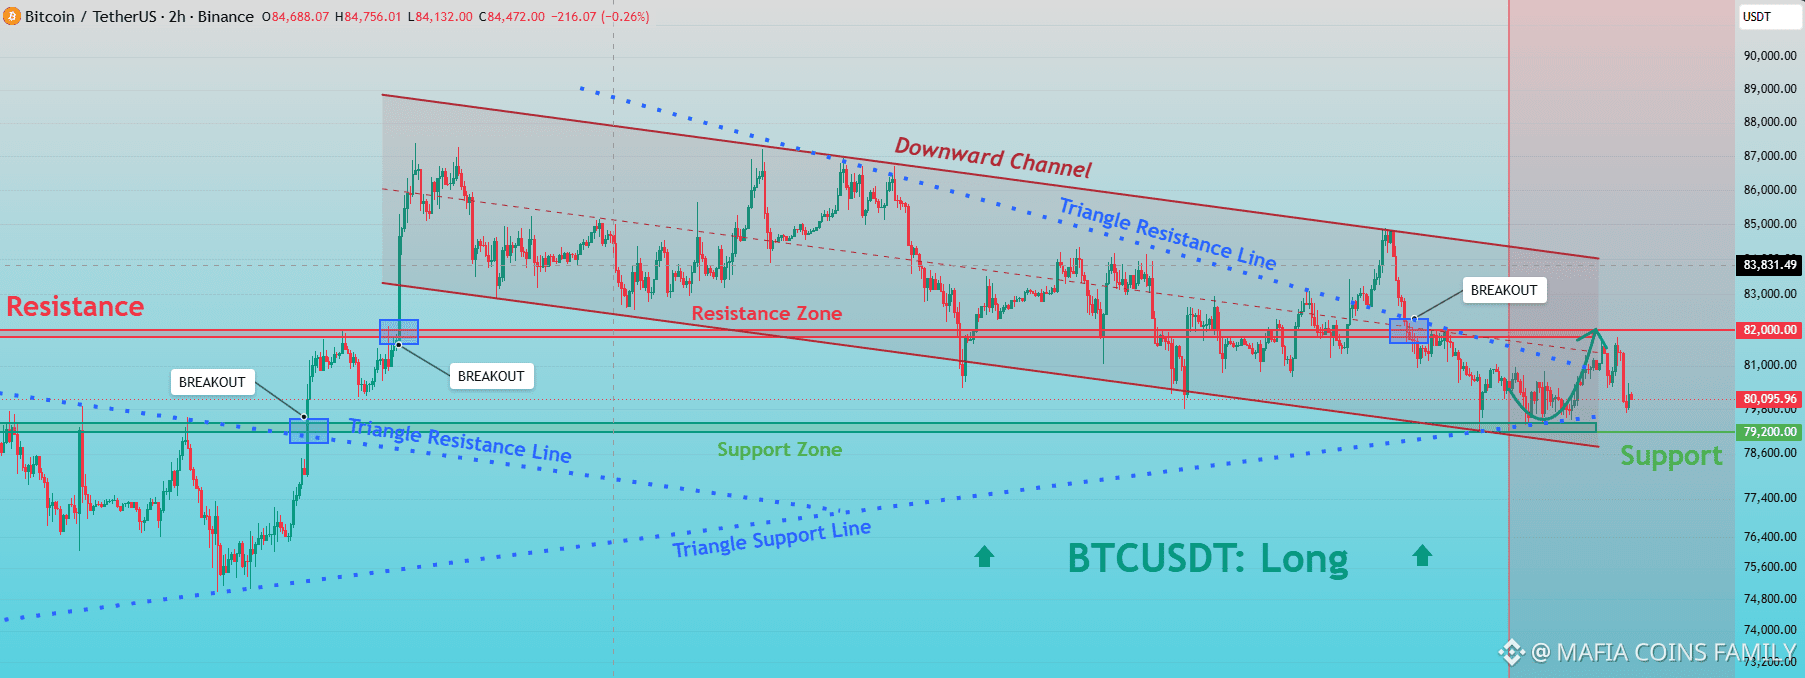
1. Key levels to watch
Resistance zone
$81,800–$82,200
Major reclaim level; previous support/resistance and possible rejection area.
Current price area
$80,000–$80,500
Price is near the lower consolidation area and needs to show whether buyers are defending it.
Major support zone
$79,200–$79,800
A breakdown and failed retest would weaken the bullish setup.
{spot}(BTCUSDT)
{future}(BTCUSDT)
#earningsseasons $BTC $BTC $BTC
1. Key levels to watch
Resistance zone
$81,800–$82,200
Major reclaim level; previous support/resistance and possible rejection area.
Current price area
$80,000–$80,500
Price is near the lower consolidation area and needs to show whether buyers are defending it.
Major support zone
$79,200–$79,800
A breakdown and failed retest would weaken the bullish setup.
57
$XAU
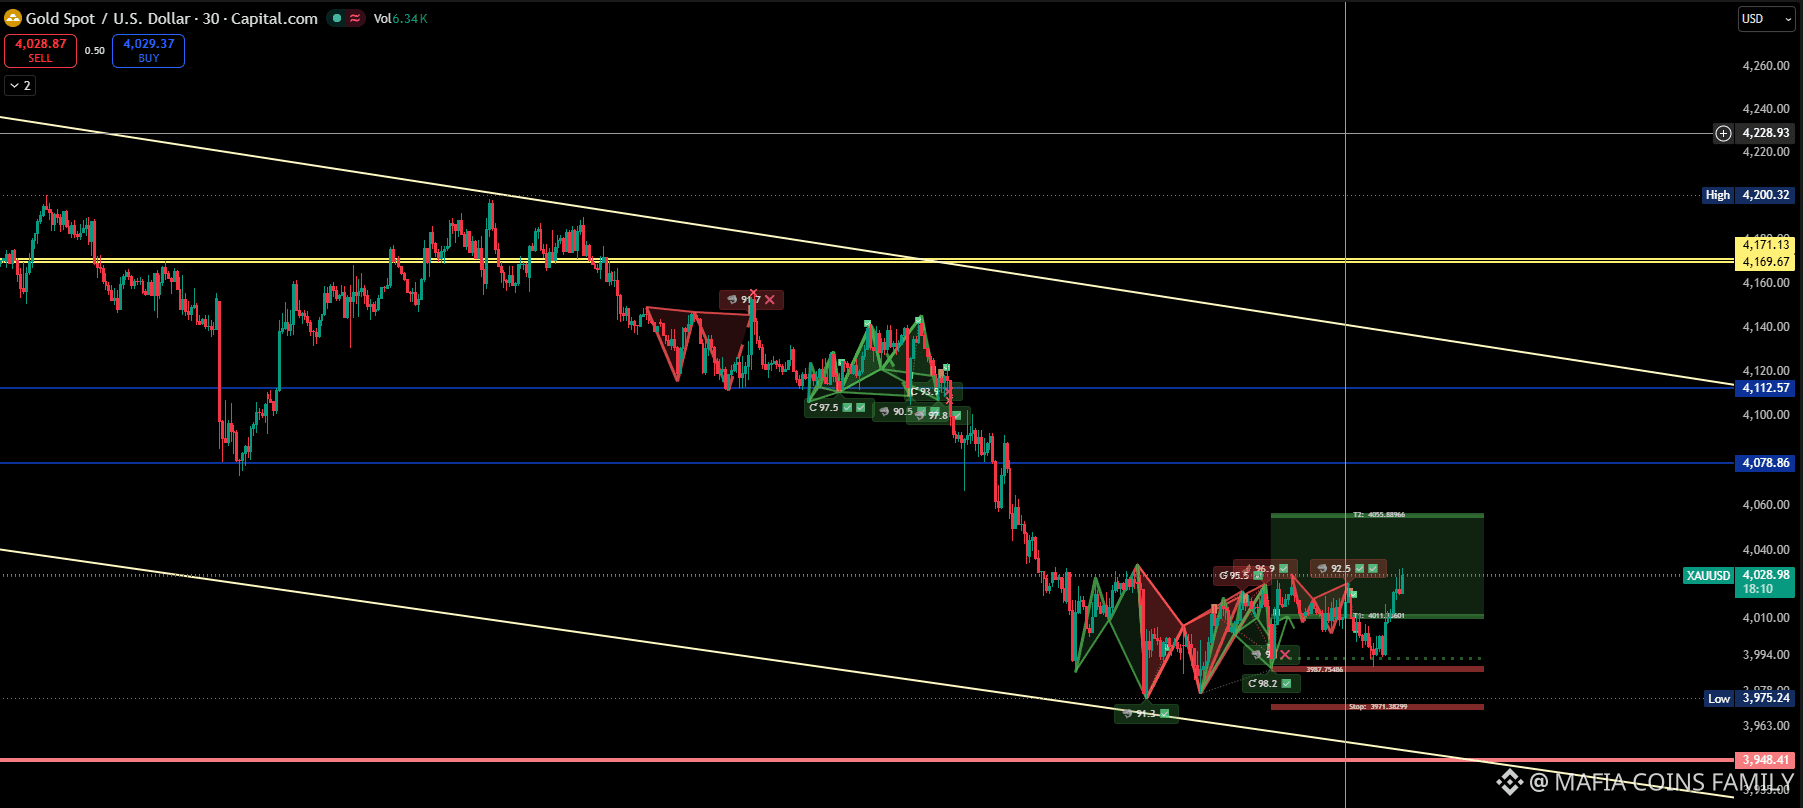
$XAUT 1. Important support and resistance levels
Price zone
Technical significance
4,169–4,171
Major overhead resistance
4,112.57
Previous support, now resistance
4,078.86
Intermediate resistance
4,035–4,040
Immediate breakout / rejection area
4,010–4,015
Near-term support
3,990–3,994
Local support zone
3,975.24
Recent chart low
3,948.41
Lower support / downside level
. Potential trade scenarios
Scenario A — Sell the rejection
Preferred directional bias
Watch: 4,030–4,040 for rejection.
Confirmation: A 30-minute candle rejects this zone and breaks back below 4,010.
Potential targets: 3,994 → 3,975 → 3,948.
Invalidation: Sustained price acceptance above the rejection zone, particularly if higher lows develop.
The key is to wait for the rejection rather than sell simply because the broader trend is bearish
Scenario B — Short-term bullish rebound
Confirmation: A 30-minute close above 4,040, followed by a successful retest.
Potential targets: 4,055–4,060, then 4,078.86.
Stronger recovery: A sustained break above 4,078.86 would improve the bullish case.
Invalidation: A failed breakout and return below 4,010.
This would initially be a counter trend trade, not proof that the overall downtrend has reversed
{future}(XAUUSDT)
{spot}(XAUTUSDT)
$XAU
$XAUT 1. Important support and resistance levels
Price zone
Technical significance
4,169–4,171
Major overhead resistance
4,112.57
Previous support, now resistance
4,078.86
Intermediate resistance
4,035–4,040
Immediate breakout / rejection area
4,010–4,015
Near-term support
3,990–3,994
Local support zone
3,975.24
Recent chart low
3,948.41
Lower support / downside level
. Potential trade scenarios
Scenario A — Sell the rejection
Preferred directional bias
Watch: 4,030–4,040 for rejection.
Confirmation: A 30-minute candle rejects this zone and breaks back below 4,010.
Potential targets: 3,994 → 3,975 → 3,948.
Invalidation: Sustained price acceptance above the rejection zone, particularly if higher lows develop.
The key is to wait for the rejection rather than sell simply because the broader trend is bearish
Scenario B — Short-term bullish rebound
Confirmation: A 30-minute close above 4,040, followed by a successful retest.
Potential targets: 4,055–4,060, then 4,078.86.
Stronger recovery: A sustained break above 4,078.86 would improve the bullish case.
Invalidation: A failed breakout and return below 4,010.
This would initially be a counter trend trade, not proof that the overall downtrend has reversed
334
$XAU
$XAU
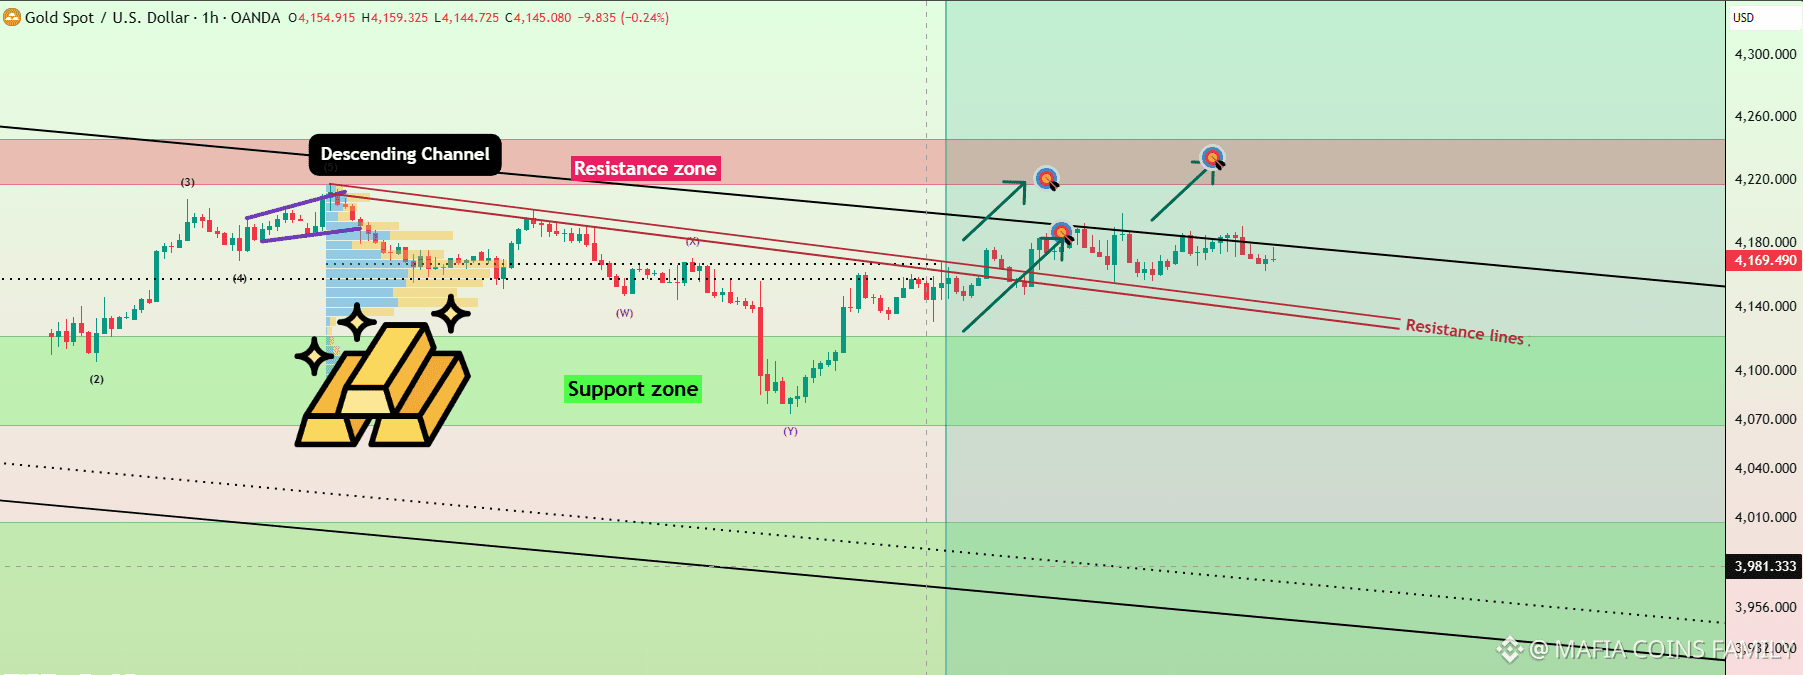
Major resistance
4,220–4,245
Highlighted red zone; potential profit-taking or rejection area.
Immediate resistance
4,180–4,200
Descending trendline and recent swing highs; price needs to reclaim this area.
Near-term support
4,150–4,140
First area to watch for a pullback and bullish reaction.
Major support
4,120–4,070
Your green demand zone, including the area of the sharp recovery.
2. What price action is telling us
Recovery from support: The sharp sell-off toward approximately 4,080 was followed by a strong rebound, suggesting buyers entered the demand area.
Resistance is still active: Price is trading beneath or around the major descending black trendline. The recovery alone does not confirm a trend reversal.
Compression near resistance: The recent candles around 4,160–4,190 show relatively sideways movement. This is a decision area where a breakout or rejection could develop.
Trend confirmation is missing: A strong 1H close above the descending trendline, followed by a successful retest, would provide better evidence of a bullish reversal.
3. Possible trading setups
These are conditional plans, not live trade signals.
Setup A — Breakout long
Bullish
Trigger: A strong 1H candle closes above 4,190–4,200.
Entry idea: Wait for a retest that holds above the breakout area.
Targets: 4,220, then 4,240–4,245.
Invalidation: Price falls back below the reclaimed level; define the stop using the retest structure.
Setup B — Resistance rejection short
Bearish
Trigger: A clear bearish rejection near 4,180–4,200, followed by a break of local support.
Entry idea: Consider only after rejection confirmation, rather than selling directly into support.
Targets: 4,150, then 4,140; an extended move could reach 4,120.
Invalidation: Price breaks and holds above the rejection high.
{future}(XAUTUSDT)
{future}(XAUUSDT)
$XAU
$XAU
Major resistance
4,220–4,245
Highlighted red zone; potential profit-taking or rejection area.
Immediate resistance
4,180–4,200
Descending trendline and recent swing highs; price needs to reclaim this area.
Near-term support
4,150–4,140
First area to watch for a pullback and bullish reaction.
Major support
4,120–4,070
Your green demand zone, including the area of the sharp recovery.
2. What price action is telling us
Recovery from support: The sharp sell-off toward approximately 4,080 was followed by a strong rebound, suggesting buyers entered the demand area.
Resistance is still active: Price is trading beneath or around the major descending black trendline. The recovery alone does not confirm a trend reversal.
Compression near resistance: The recent candles around 4,160–4,190 show relatively sideways movement. This is a decision area where a breakout or rejection could develop.
Trend confirmation is missing: A strong 1H close above the descending trendline, followed by a successful retest, would provide better evidence of a bullish reversal.
3. Possible trading setups
These are conditional plans, not live trade signals.
Setup A — Breakout long
Bullish
Trigger: A strong 1H candle closes above 4,190–4,200.
Entry idea: Wait for a retest that holds above the breakout area.
Targets: 4,220, then 4,240–4,245.
Invalidation: Price falls back below the reclaimed level; define the stop using the retest structure.
Setup B — Resistance rejection short
Bearish
Trigger: A clear bearish rejection near 4,180–4,200, followed by a break of local support.
Entry idea: Consider only after rejection confirmation, rather than selling directly into support.
Targets: 4,150, then 4,140; an extended move could reach 4,120.
Invalidation: Price breaks and holds above the rejection high.

179
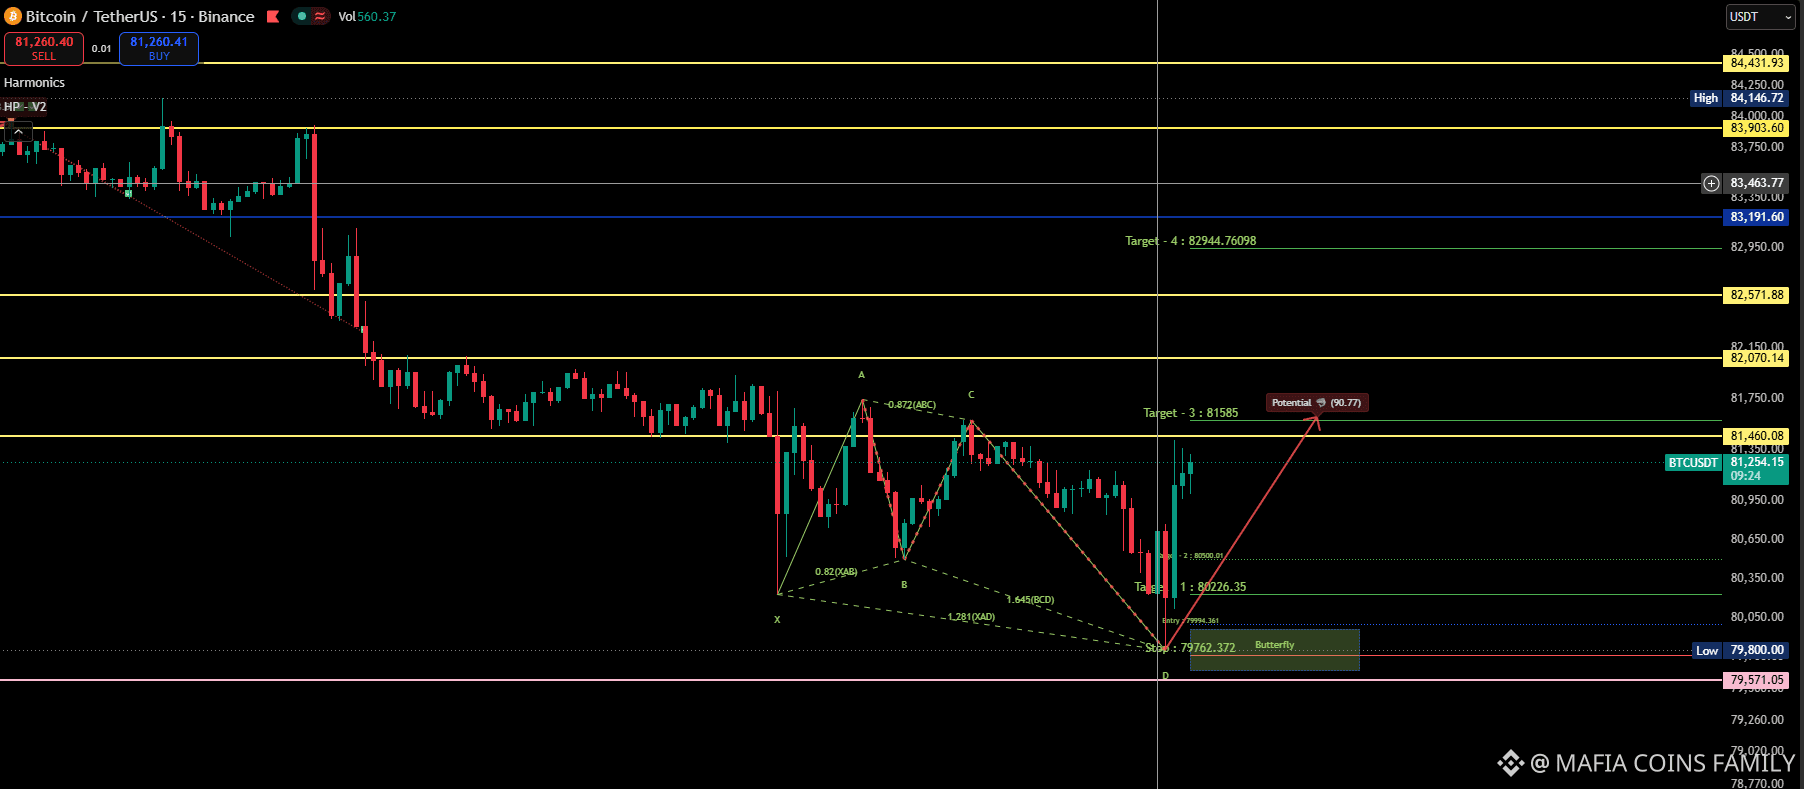
$BTC Harmonic Butterfly pattern
Your chart marks a potential bullish Butterfly completion near point D around 79,762.
X–A–B–C–D: The projected harmonic structure identifies a possible reversal zone.
D zone: The sharp reaction from around 79,800 supports the possibility that buyers are defending this level.
Projected rebound: The red arrow points toward approximately 81,585, which is a plausible first major recovery target if momentum continues.
Important: a harmonic pattern is a setup, not confirmation. The bounce alone does not prove that the low is in.
BTC closes a 15-minute candle above 81,460–81,585 and successfully retests that zone as support.
{future}(BTCDOMUSDT)
First upside objective: 82,070
Next objective: 82,572
Extended objective: 82,945
A breakout without a successful retest can still fail.👍👍👍👍
{future}(BTCUSDT)
$BTC Harmonic Butterfly pattern
Your chart marks a potential bullish Butterfly completion near point D around 79,762.
X–A–B–C–D: The projected harmonic structure identifies a possible reversal zone.
D zone: The sharp reaction from around 79,800 supports the possibility that buyers are defending this level.
Projected rebound: The red arrow points toward approximately 81,585, which is a plausible first major recovery target if momentum continues.
Important: a harmonic pattern is a setup, not confirmation. The bounce alone does not prove that the low is in.
BTC closes a 15-minute candle above 81,460–81,585 and successfully retests that zone as support.
First upside objective: 82,070
Next objective: 82,572
Extended objective: 82,945
A breakout without a successful retest can still fail.👍👍👍👍
70
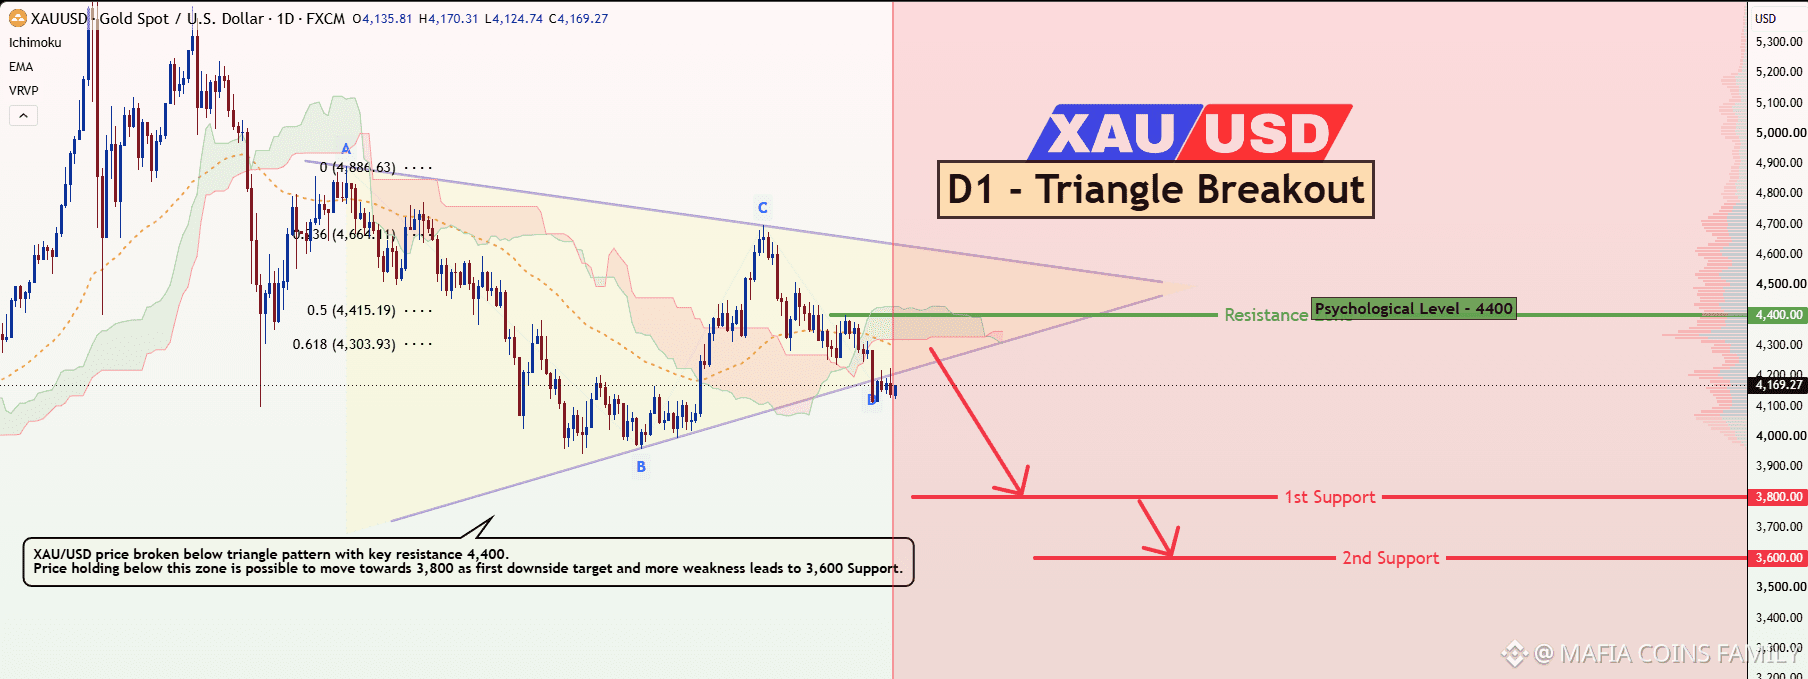
$XAU 1. Current structure
Current price: ~4,169
Major psychological resistance: 4,400
Triangle support/trendline has been broken.
The previous swing structure shows lower highs, while the larger triangle had been compressing price.
The Ichimoku cloud is also not giving a strong bullish confirmation around the current price.
Bearish scenario — my preferred reading
If XAU/USD remains below 4,300–4,400, the chart favors continuation lower.
A reasonable sequence would be:
4,170 → 4,000 → 3,800 → 3,600
The 3,800 area is particularly important because it's the first clearly marked support on your chart. If price reaches it and produces a strong daily reversal, a corrective bounce would be quite normal.
If 3,800 breaks decisively on a daily closing basis, then 3,600 becomes the next major objective.
Bullish scenario
I wouldn't consider the breakdown fully negated simply because price bounces.
For bulls, I'd want to see:
4,300 reclaim → 4,400 daily close → successful retest of 4,400 as support.
A sustained move above 4,400 would significantly weaken the triangle-breakdown thesis and could signal a false breakdown.
{future}(XAUUSDT)
$XAU 1. Current structure
Current price: ~4,169
Major psychological resistance: 4,400
Triangle support/trendline has been broken.
The previous swing structure shows lower highs, while the larger triangle had been compressing price.
The Ichimoku cloud is also not giving a strong bullish confirmation around the current price.
Bearish scenario — my preferred reading
If XAU/USD remains below 4,300–4,400, the chart favors continuation lower.
A reasonable sequence would be:
4,170 → 4,000 → 3,800 → 3,600
The 3,800 area is particularly important because it's the first clearly marked support on your chart. If price reaches it and produces a strong daily reversal, a corrective bounce would be quite normal.
If 3,800 breaks decisively on a daily closing basis, then 3,600 becomes the next major objective.
Bullish scenario
I wouldn't consider the breakdown fully negated simply because price bounces.
For bulls, I'd want to see:
4,300 reclaim → 4,400 daily close → successful retest of 4,400 as support.
A sustained move above 4,400 would significantly weaken the triangle-breakdown thesis and could signal a false breakdown.

296
Follow Me For 🧧🧧🧧
Follow Me For 🧧🧧🧧

龙虾量化带单
·
--
Рост关注我领取你的红包,另外我将从转发者中抽3人,每人送5美元
Follow me to get your bonus. 3 reposters will win $5 each.
Follow me to get your bonus. 3 reposters will win $5 each.

6
Войдите, чтобы посмотреть больше материала
Присоединяйтесь к пользователям криптовалют по всему миру на Binance Square
⚡️ Получайте новейшую и полезную информацию о криптоактивах.
💬 Нам доверяет крупнейшая в мире криптобиржа.
👍 Получите достоверные аналитические данные от верифицированных создателей контента.
Эл. почта/номер телефона
В тренде
UniswapA16zSeekDeFiExemptionFromIllinoisCryptoTax
Просмотров: 35,131
871 обсуждают
#CryptoTax 🚨 CRYPTO MARKET & REGULATORY UPDATE #HKDollarStablecoinHKDAPToLaunchOnSolana
#uniswapa16zseekdefiexemptionfromillinoiscryptotax UNISWAP, a16z & DeFi Education Fund Challenge Illinois Crypto Tax Rules
October 30, 2026 | Market Volatility & Industry Developments
📊 1. MARKET SNAPSHOT
Crypto markets are showing mixed signals, with selected assets posting sharp gains while several major cryptocurrencies remain under pressure.
📈 Top reported gainers
SOPH: +60.81% — $0.00238
BEAMX: +37.94% — $0.004701
SKDDB: +16.81% — $9.38
📉 Notable reported losers
INTWUSDT: −61.09% — $6.72
AKEUSDT: −31.47% — $0.013989
SNXXUSDT: −30.71% — $6.43
🔎 Major crypto assets under pressure
DOGE: −5.06%
PEPE: −4.91%
SUI: −4.83%
NEAR: −3.28%
XRP: −3.13%
Uniswap Labs, Andreessen Horowitz (a16z), and the DeFi Education Fund (DEF) are pushing for exemptions from Illinois’
#Uniswap #a16z #DeFi #CryptoRegulation #Illinois # #Web3 #BinanceSquare
#HKDollarStablecoinHKDAPToLaunchOnSolana #HKDAP #Stablecoin #CryptoNews #Blockchain #DeFi #DigitalPayments
⚖️ 3. UNISWAP, a16z & ILLINOIS CRYPTO TAX RULES
Uniswap Labs, Andreessen Horowitz (a16z), and the DeFi Education Fund are associated with efforts to seek exemptions proposed Illinois crypto tax requirements.
The debate highlights a key question: How should tax-reporting obligations apply to decentralized that may not operate like traditional financial intermediaries?
The outcome could influence DeFi compliance, developer obligations, and the future regulatory environment.
#BinanceSquare #CryptoNews #HKDAP #Stablecoin #Uniswap #a16z #DeFi #CryptoTax
CHASEPA SULUXù
·Лайков: 2
·Просмотров: 383
HKDollarStablecoinHKDAPToLaunchOnSolana
Просмотров: 25,538
560 обсуждают
$1.5BInLeveragedCryptoBetsLiquidated
Просмотров: 53,777
267 обсуждают