

#liquidationmap
liquidationmap
Просмотров: 400,904
1,013 обсуждают
Популярные
Новые

·
--
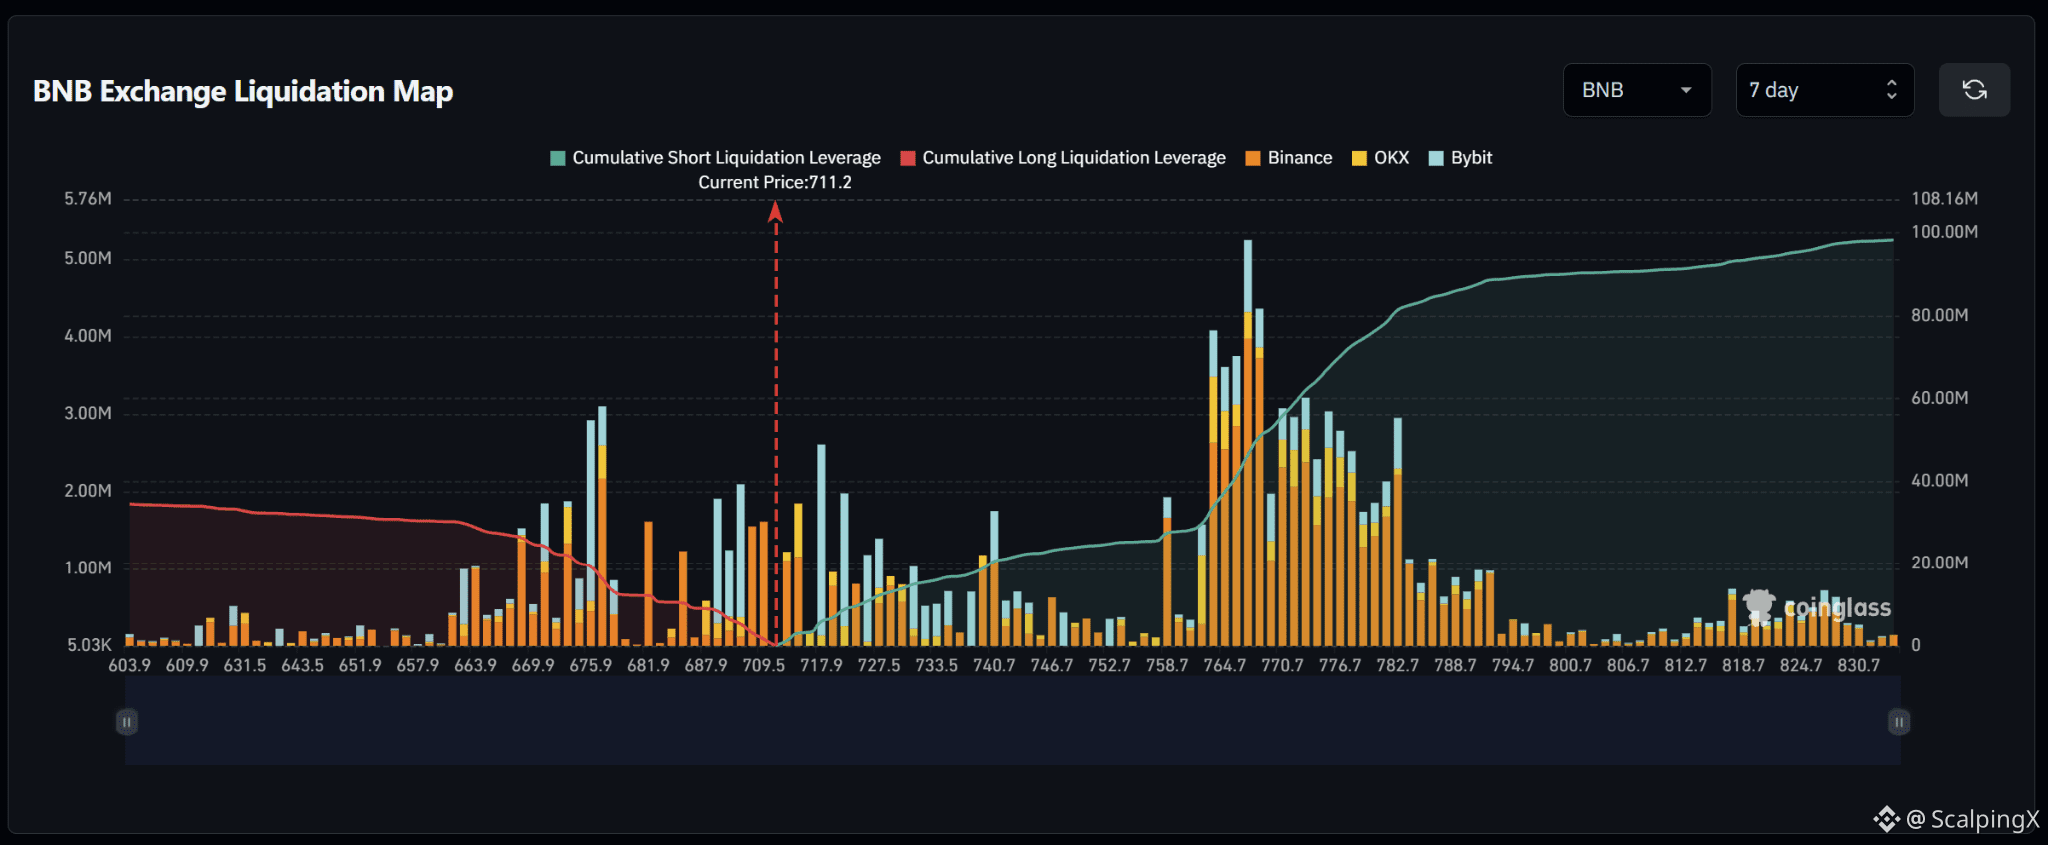
$BNB – Liquidation Map (7 days) – Index ~711.2
🧭 BNB favors an upside short sweep. Estimated cumulative short liquidations approach $100M, nearly three times long exposure across the displayed range. However, the heaviest concentration sits farther away at 764–783, requiring progress through nearby clusters first.
🔺 The first target is 717–724. A break and hold above 724 shifts attention to 733–742. These intermediate clusters will help assess whether the advance can hold.
🎯 Above 742, the next target is 758, followed by the large short band at 764–783, particularly near 767. Short liquidations there could amplify the advance; density drops sharply beyond 789.
⚖️ Losing 709.5 without a reclaim weakens the upside bias and shifts attention to 699–706. Losing that zone would bring the large long cluster at 674–682 into focus as a farther target. Avoid chasing if price sweeps 717–724 and falls back below 717.
#LiquidationMap
24
·
--
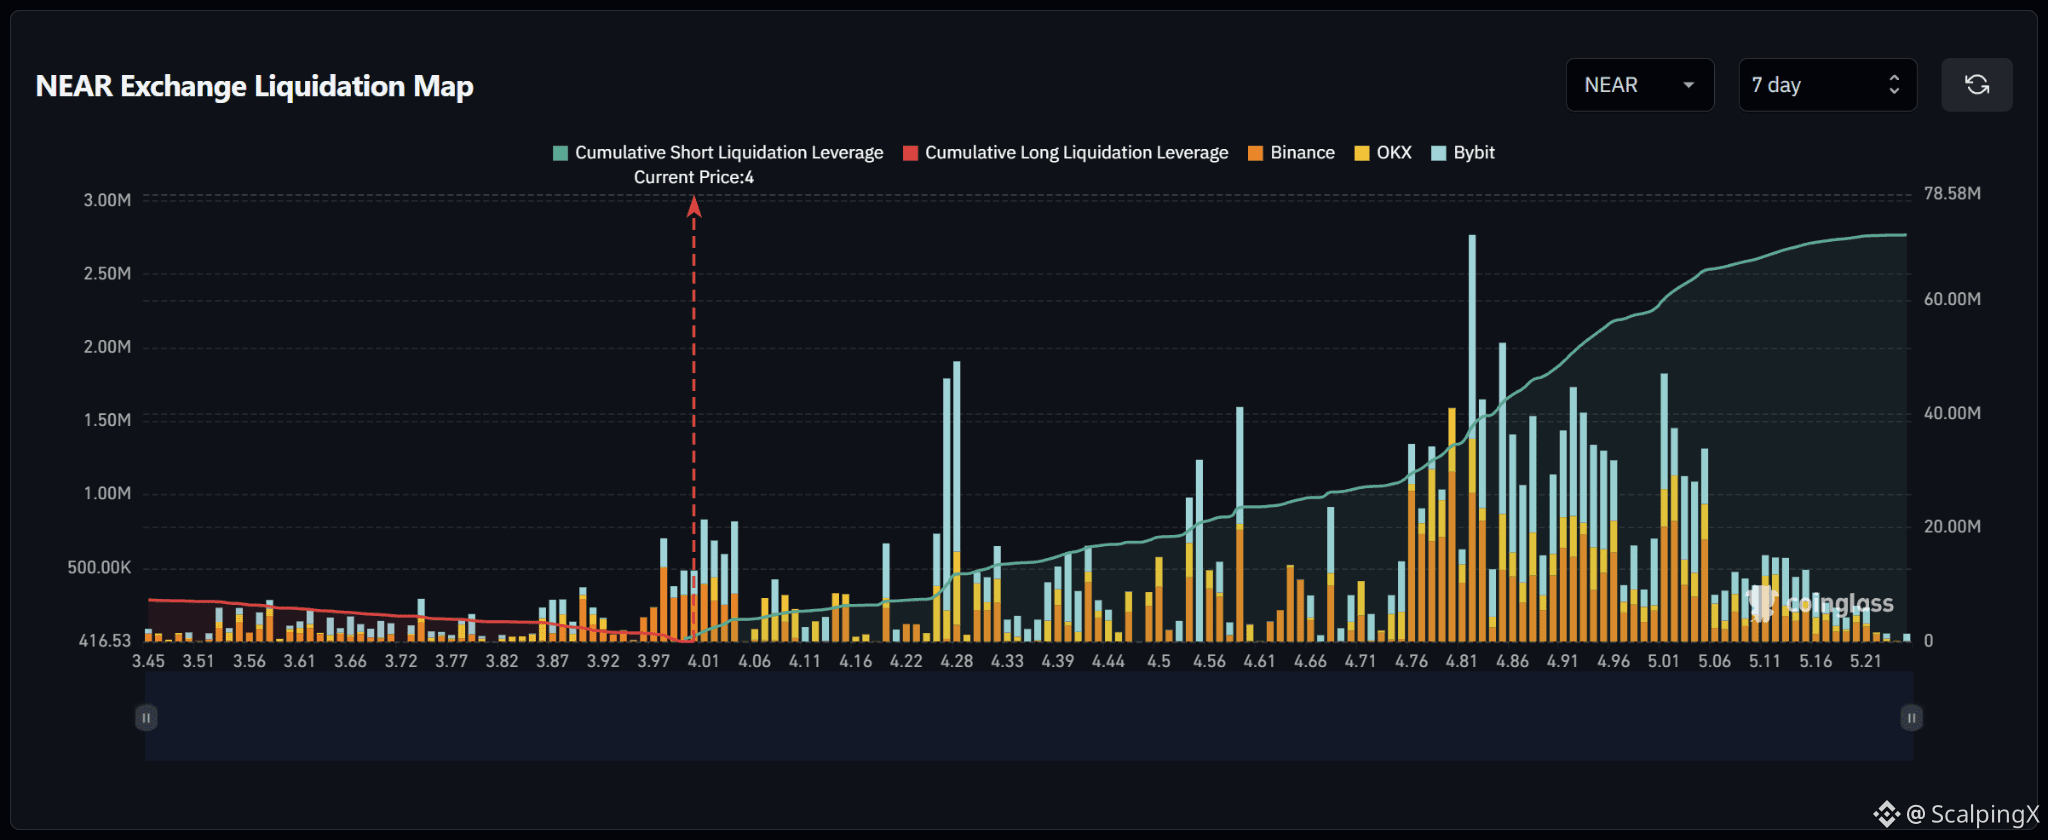
$NEAR – Liquidation Map (7 days) – Index ~4.00
🧭 NEAR clearly favors an upside short sweep. Estimated cumulative short liquidations reach roughly $70M versus nearly $7M in longs across the displayed range. However, most short exposure sits farther above the current price.
🔺 The first target is 4.01–4.05. A break and hold above 4.05 shifts attention to 4.26–4.29, featuring two prominent liquidation spikes. Density is lower between these zones, making reclaimed levels important to sustain the upside scenario.
🎯 Above 4.29, the next targets are 4.54–4.61, followed by the large band at 4.76–5.05. The biggest spike sits near 4.82; this is an extended target, rather than an expectation for one uninterrupted advance.
⚖️ Losing 3.97 without a reclaim weakens the upside bias and shifts attention to 3.87–3.92. A sweep of 4.26–4.29 followed by a drop below 4.26 would also weaken continuation; avoid chasing after the short cluster has been cleared.
#LiquidationMap
19
·
--
Рост
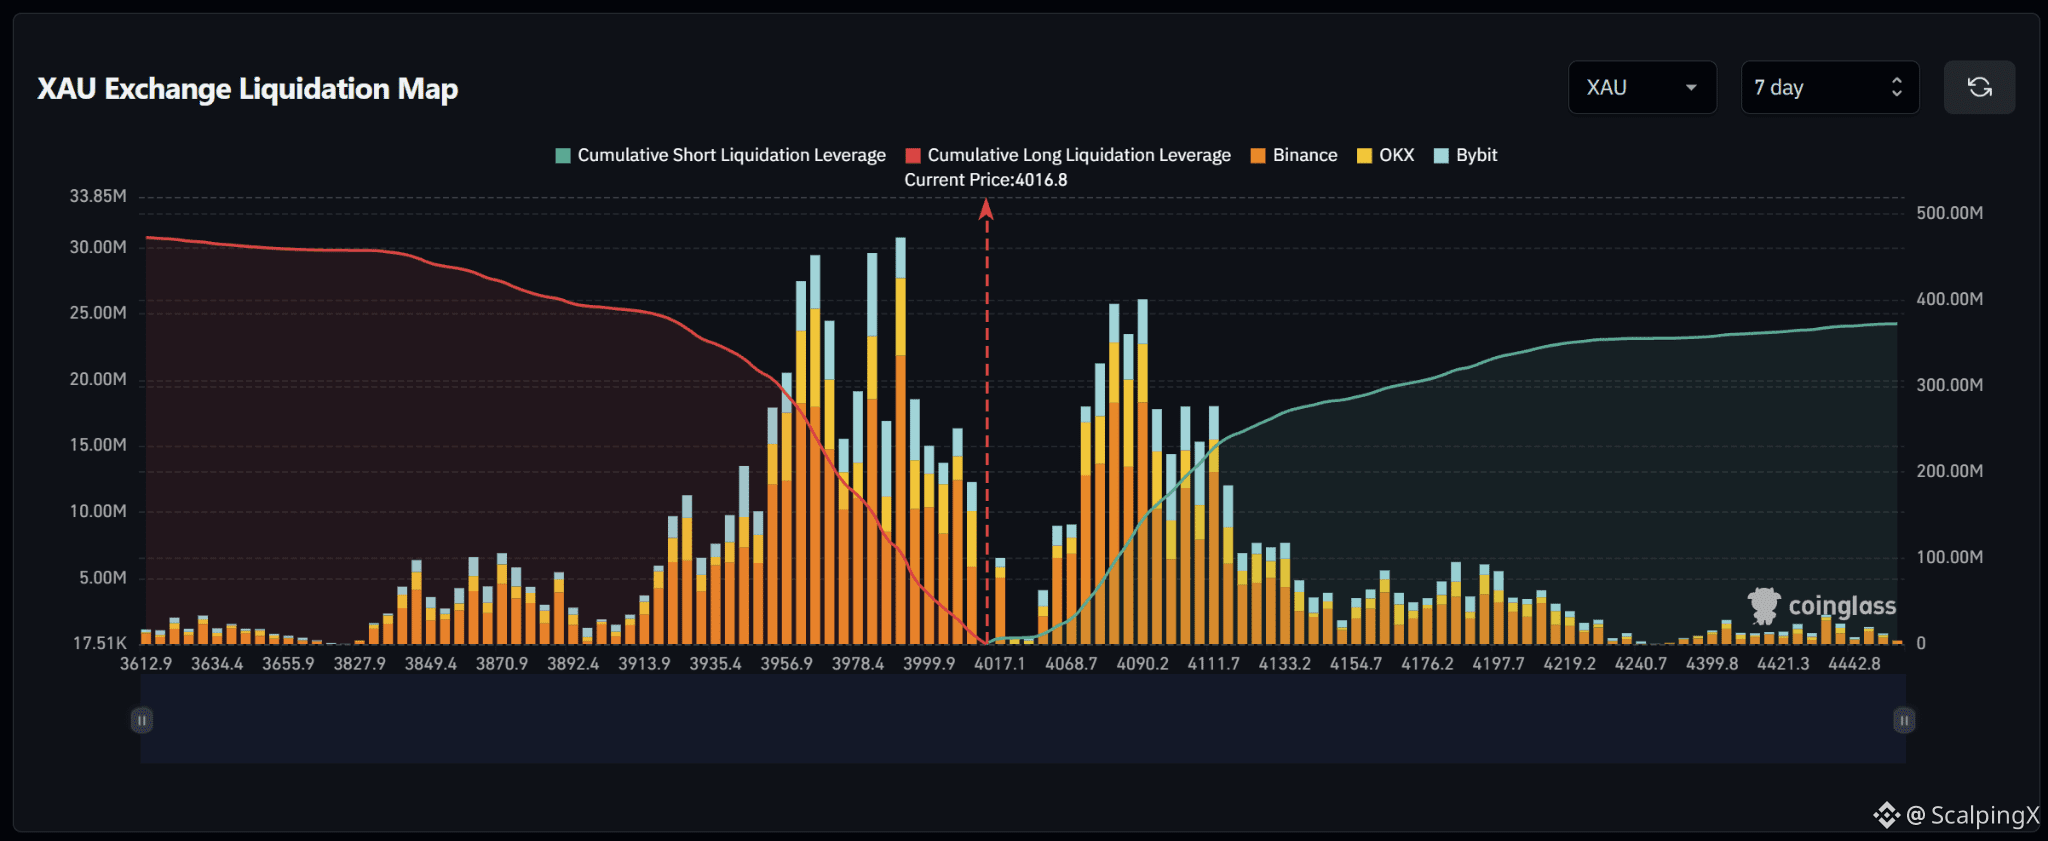
$XAU – Liquidation Map (7 days) – Index ~4,016.8
🧭 XAU favors a downside long sweep first. Cumulative long exposure exceeds shorts, with a heavy concentration at 3,950–4,010. The main short cluster sits farther away at 4,065–4,115, making the downside more relevant for the initial move.
🔻 The trigger to watch is 4,000. Losing it without a reclaim shifts attention to 3,975–3,990, then 3,950–3,965. Several large liquidation spikes sit together and could amplify the decline.
🎯 A break below 3,950 opens targets at 3,925–3,940, then 3,850–3,890. However, sweeping 3,950–3,965 and reclaiming 3,965 would weaken further downside expectations; avoid chasing after a sharp liquidation move.
⚖️ A break and hold above 4,050 weakens the downside priority and shifts attention to shorts at 4,065–4,095, then 4,100–4,115. Density drops noticeably above 4,135, warranting lower expectations for an extended squeeze.
#LiquidationMap
100
·
--
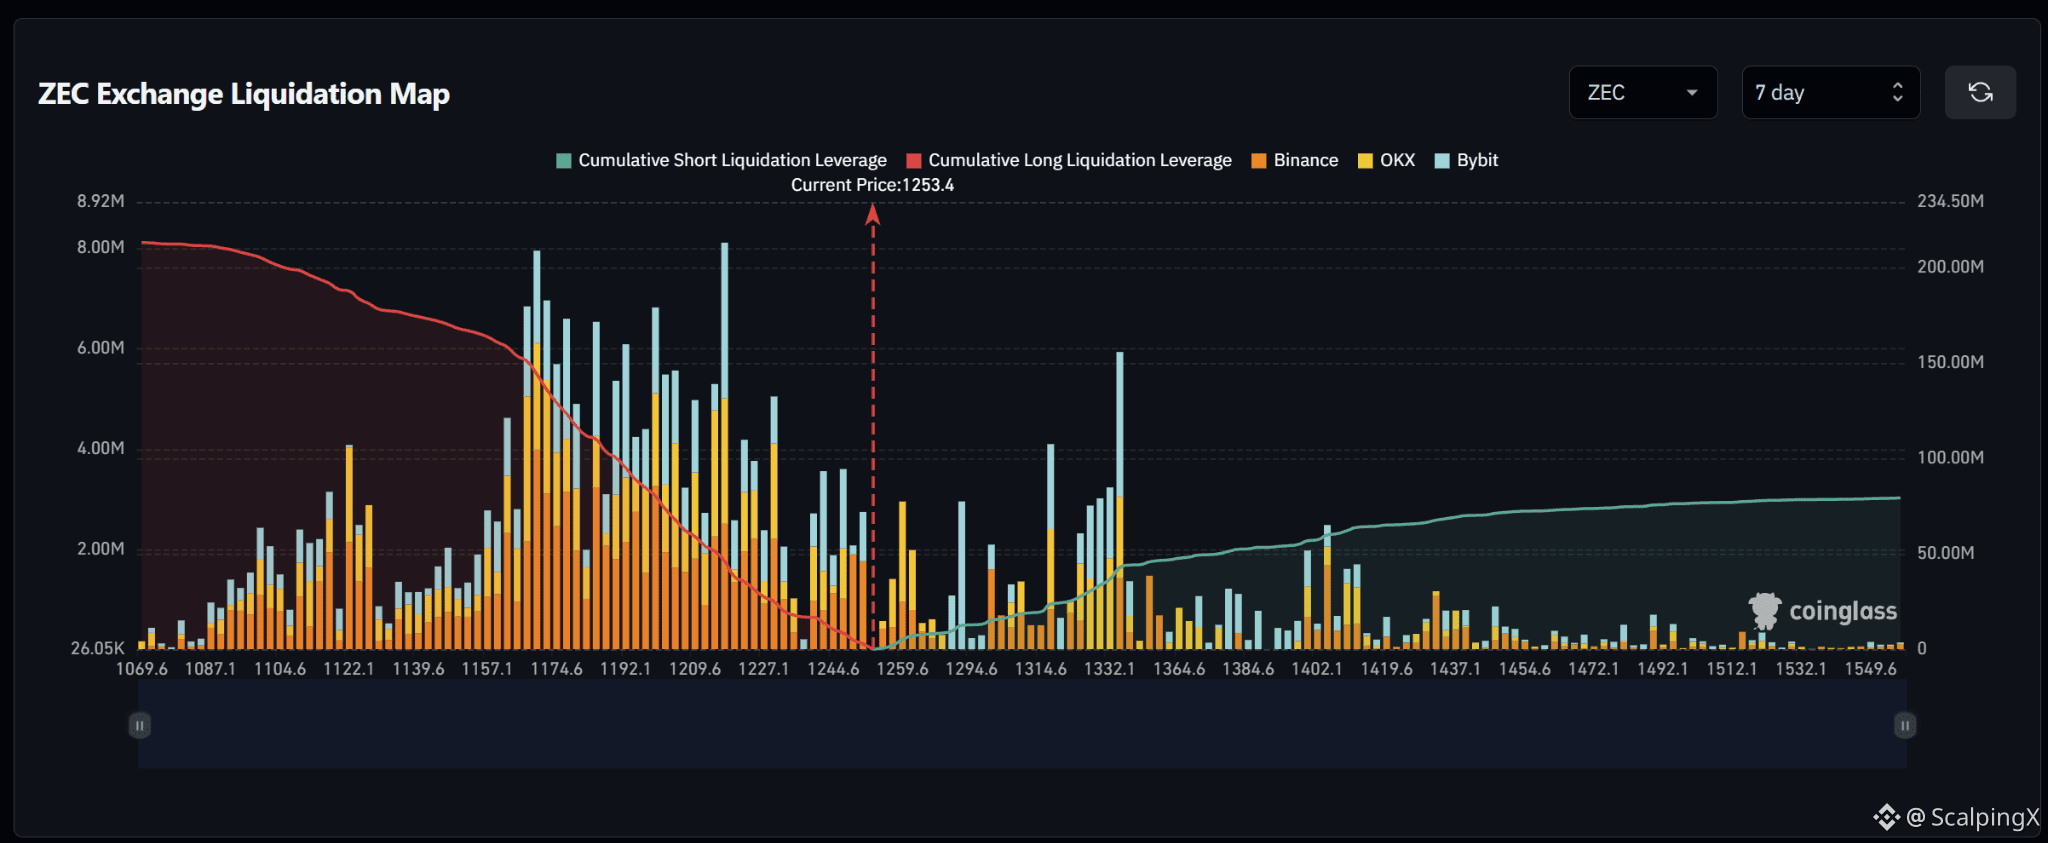
$ZEC – Liquidation Map (7 days) – Index ~1,253.4
🧭 ZEC clearly favors a downside long sweep. Estimated cumulative long liquidations reach roughly $210M versus nearly $80M in shorts across the displayed range. Successive large clusters at 1,165–1,230 create cascade risk if price falls into that band.
🔻 The first target is 1,240–1,250. Losing 1,240 without a reclaim shifts attention to 1,220–1,230, featuring one of the map’s largest liquidation spikes near 1,220.
🎯 A break below 1,220 opens targets at 1,190–1,210, then 1,165–1,180. However, sweeping the 1,220 cluster and reclaiming 1,230 would weaken further downside expectations; avoid chasing after a sharp liquidation move.
⚖️ A break and hold above 1,295 weakens the downside priority and shifts attention to shorts at 1,315–1,335. Density drops beyond this zone before another cluster around 1,400–1,415, so an extended squeeze should not be assumed.
#LiquidationMap
70
·
--
Рост
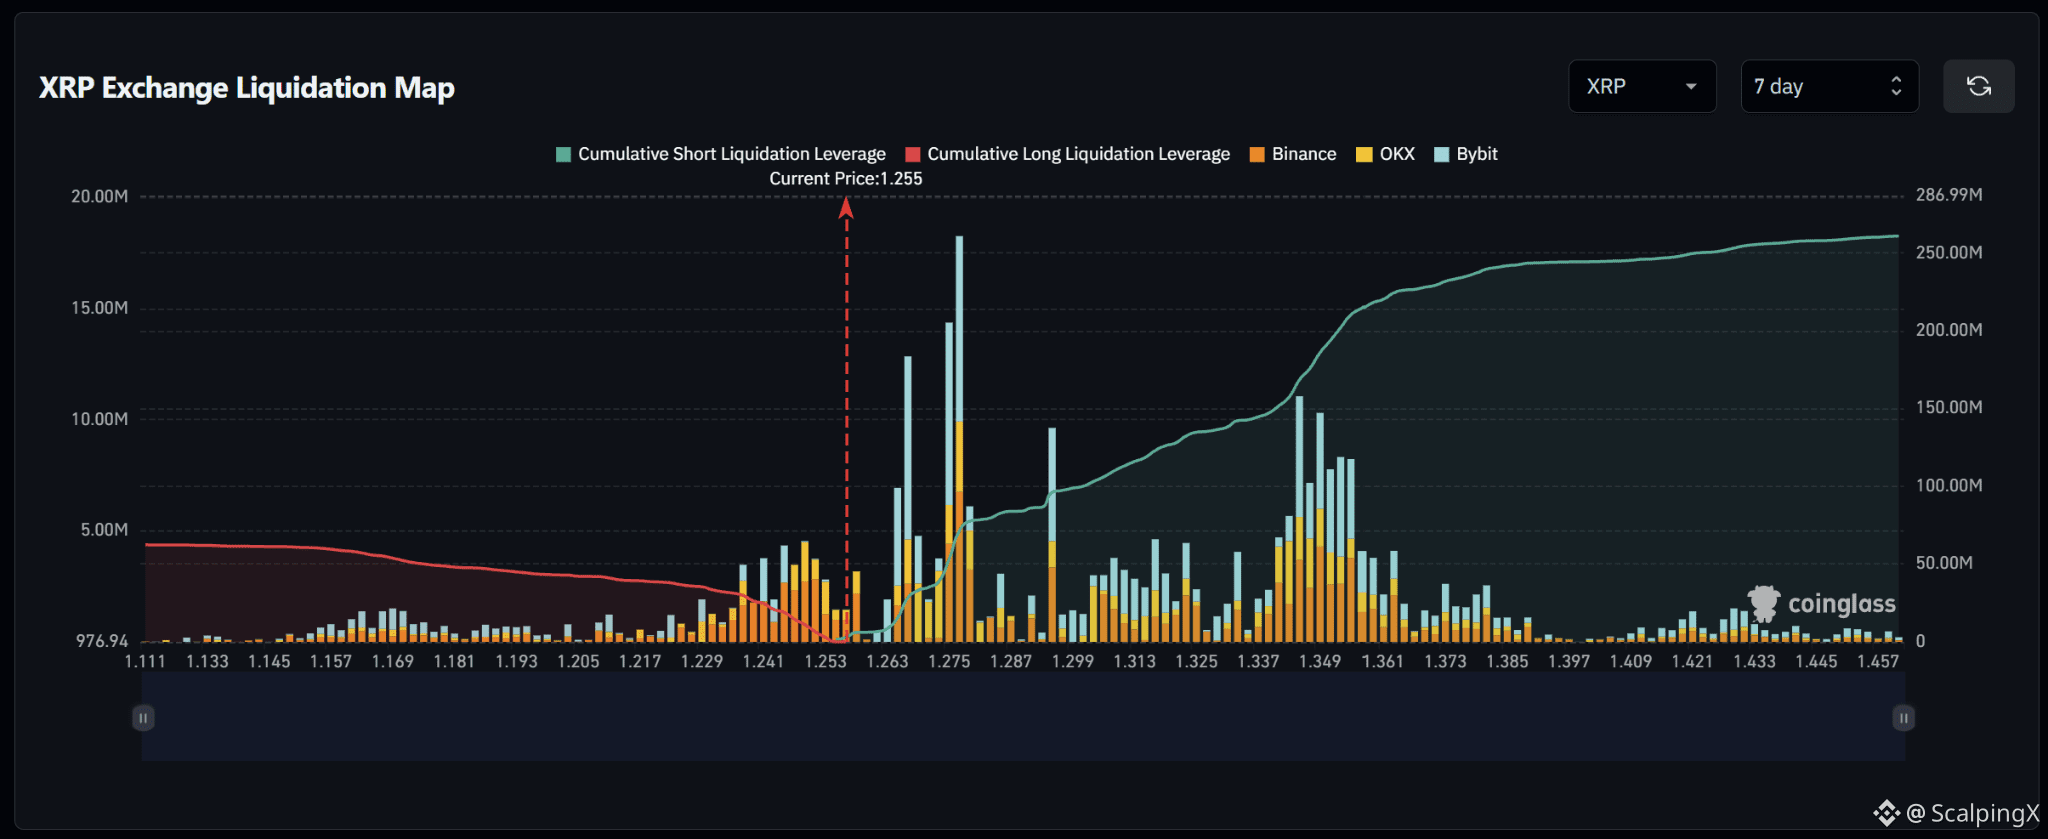
$XRP – Liquidation Map (7 days) – Index ~1.255
🧭 XRP clearly favors an upside short sweep. Estimated cumulative short liquidations reach roughly $260M, about four times long exposure across the displayed range. The large nearby cluster at 1.263–1.279 features a prominent spike near 1.277.
🔺 The first target is 1.263–1.279. A break and hold above 1.279 shifts attention to 1.295, then 1.305–1.325. Short liquidations within the nearby cluster could amplify the advance.
🎯 The main extended target is 1.341–1.355, where several large liquidation spikes sit together. Beyond 1.361–1.385, density drops sharply, warranting lower expectations for a prolonged squeeze toward farther levels.
⚖️ Losing 1.241 without a reclaim weakens the upside bias and shifts attention to 1.229–1.237. A sweep near 1.277 followed by a drop below 1.263 would also weaken continuation; avoid chasing after the large short cluster has been cleared.
#LiquidationMap
42
·
--
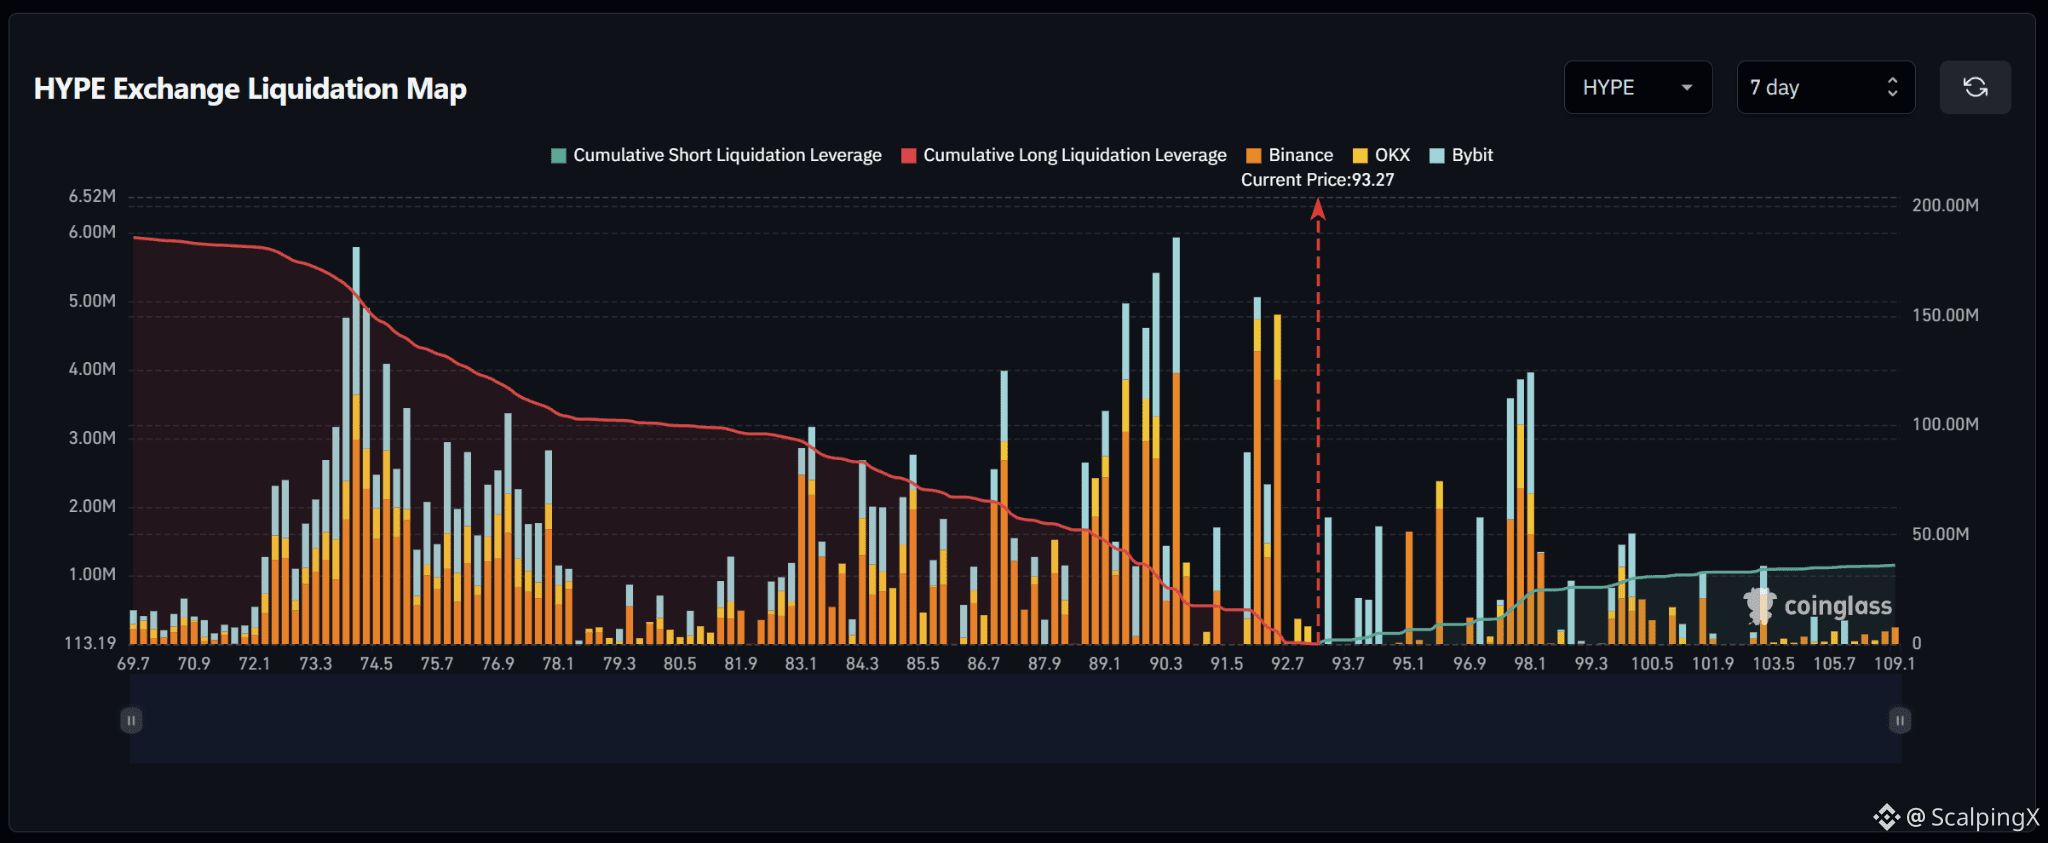
$HYPE – Liquidation Map (7 days) – Index ~93.27
🧭 HYPE clearly favors a downside long sweep. Estimated cumulative long exposure exceeds shorts by more than five times across the displayed range. Large bands at 92.0–92.5 and 89.1–90.6 sit just below price, highlighting liquidation cascade risk.
🔻 The first target is 92.0–92.5. Losing 92.0 without a reclaim shifts attention to 89.1–90.6, particularly 90.3–90.6. Long liquidations there could amplify the decline.
🎯 A break below 89.1 opens targets at 86.7–87.2, then 83.1–85.5. However, sweeping the 89.1–90.6 cluster and reclaiming 90.6 would weaken further downside expectations; avoid chasing after a sharp liquidation move.
⚖️ A break and hold above 95.1 weakens the downside priority and shifts attention to shorts at 97.6–98.3, then 100.0–100.5. Density becomes very thin beyond that zone, limiting further squeeze fuel.
#LiquidationMap
77
·
--
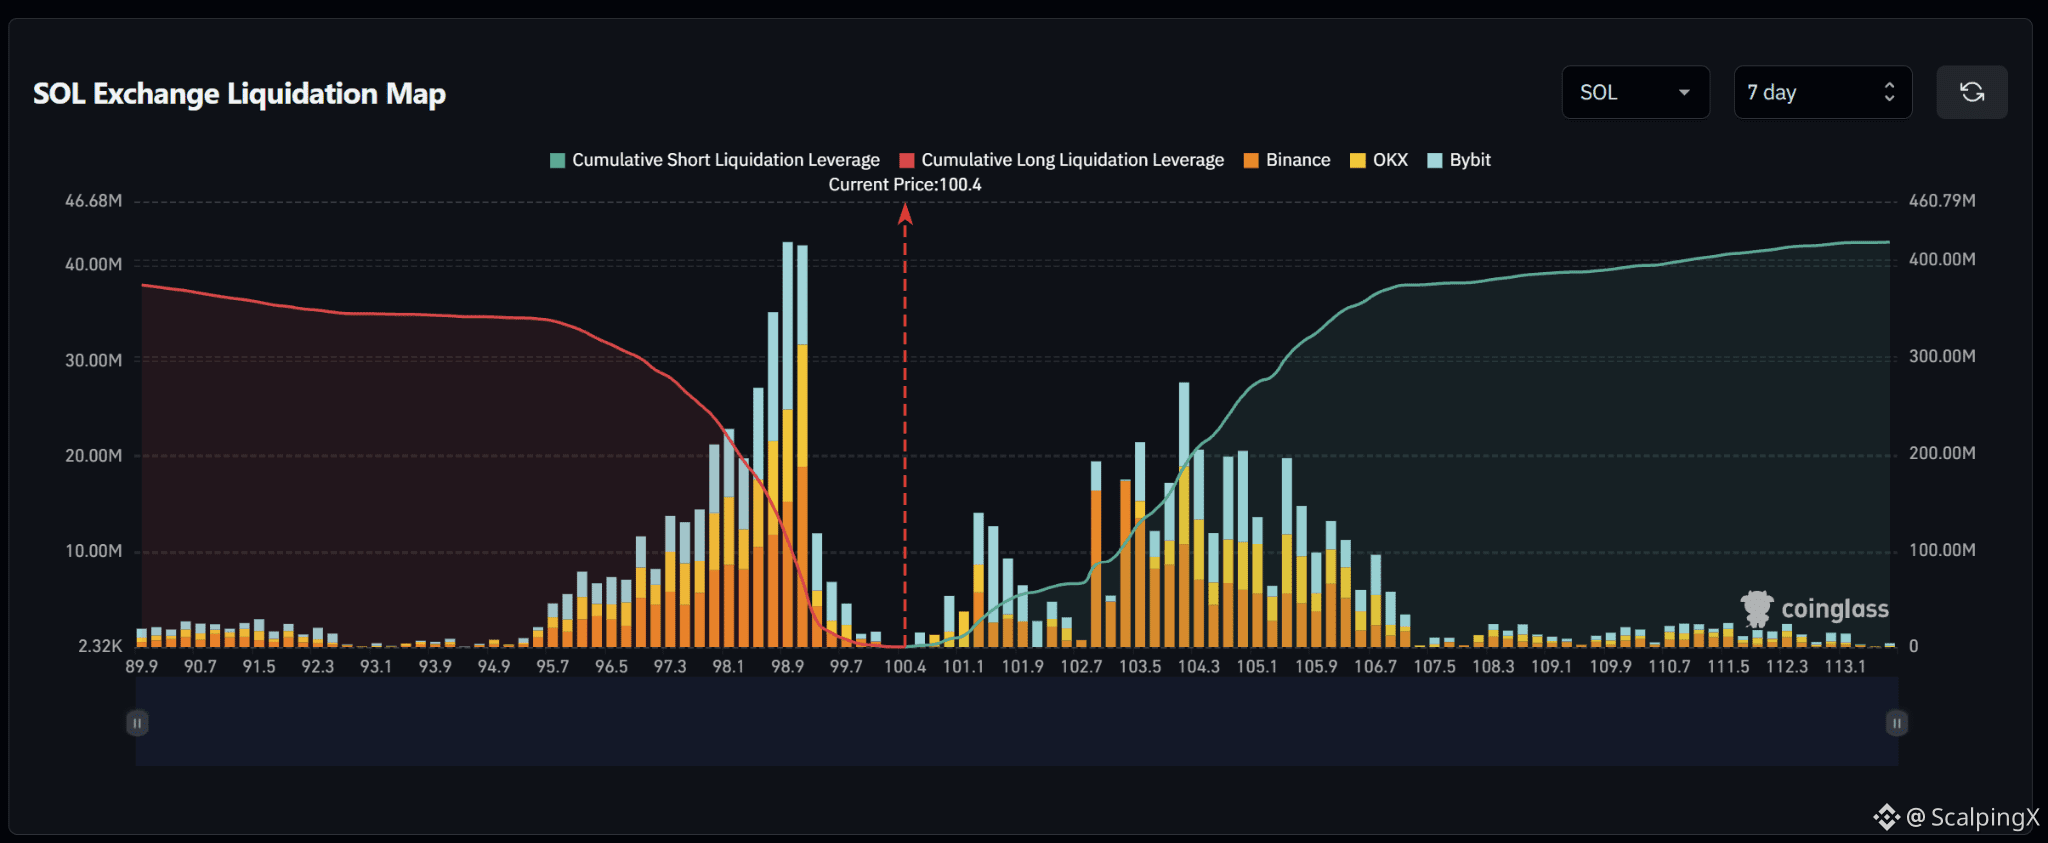
$SOL – Liquidation Map (7 days) – Index ~100.4
🧭 SOL favors a downside long sweep first. Although cumulative short exposure is slightly larger, the biggest liquidation spikes sit nearby below at 98.8–99.2. The main short concentration lies farther away at 102.9–106.8.
🔻 The trigger to watch is 99.7. Losing it without a reclaim shifts attention to 98.8–99.2, then 98.0–98.4. Long liquidations within this band could amplify the decline.
🎯 A break below 98.0 opens targets at 97.3–97.7, then 95.7–96.5. However, sweeping near 98.9 and reclaiming 99.2 would weaken further downside expectations; avoid chasing after the large cluster has been cleared.
⚖️ A break and hold above 101.7 weakens the downside-first scenario. Attention shifts to shorts at 102.9–104.3, then 105.0–106.8. Liquidation density drops sharply above 107, warranting lower expectations for an extended squeeze.
#LiquidationMap
35
·
--
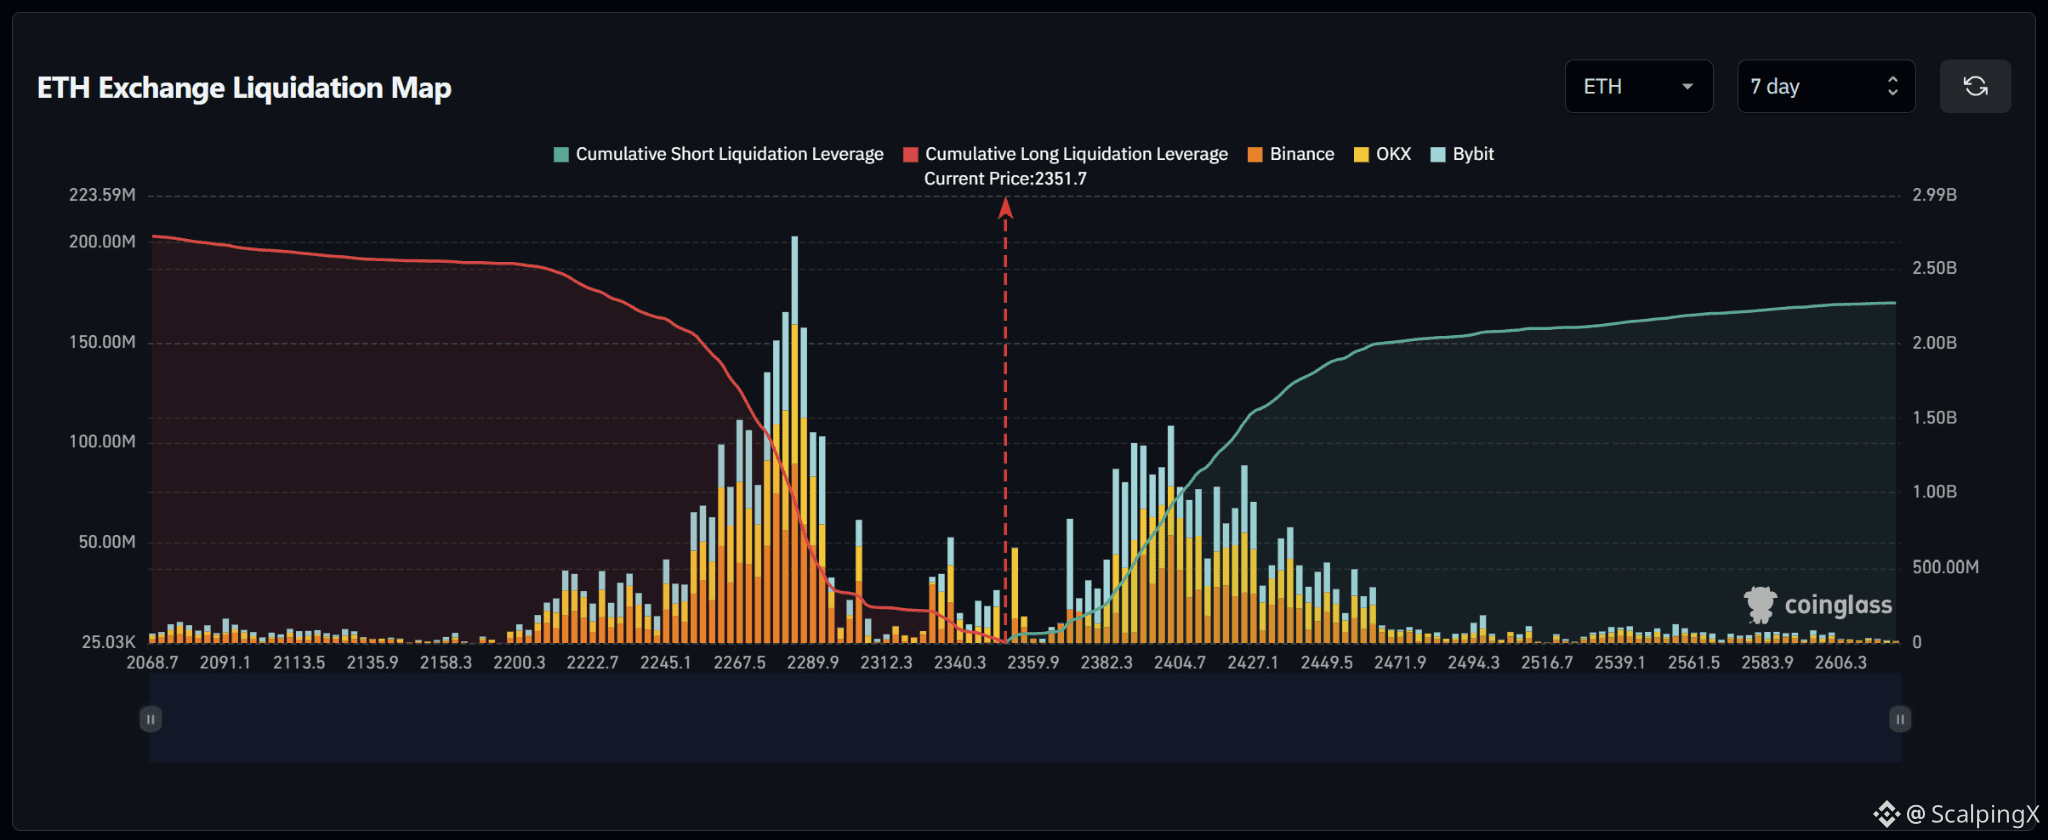
$ETH – Liquidation Map (7 days) – Index ~2,351.7
🧭 ETH favors an upside short sweep first. Although cumulative long exposure is larger, its strongest cluster sits farther away at 2,260–2,290. The short band at 2,385–2,450 is closer and contains successive liquidation spikes.
🔺 The first target is 2,385–2,410. A break and hold above 2,410 shifts attention to 2,420–2,450. Short liquidations within this band could amplify the advance, particularly around 2,400–2,410.
🎯 The 2,450–2,470 zone is the final extension of the main cluster. Liquidation density drops sharply beyond 2,470, making the reaction after a sweep more important than chasing farther targets.
⚖️ Losing 2,330 without a reclaim weakens the upside bias and shifts attention to 2,310, then 2,260–2,290, featuring the largest spike near 2,285. A sweep of 2,400–2,410 followed by a drop below 2,385 would also weaken expectations for continuation.
#LiquidationMap
22
·
--
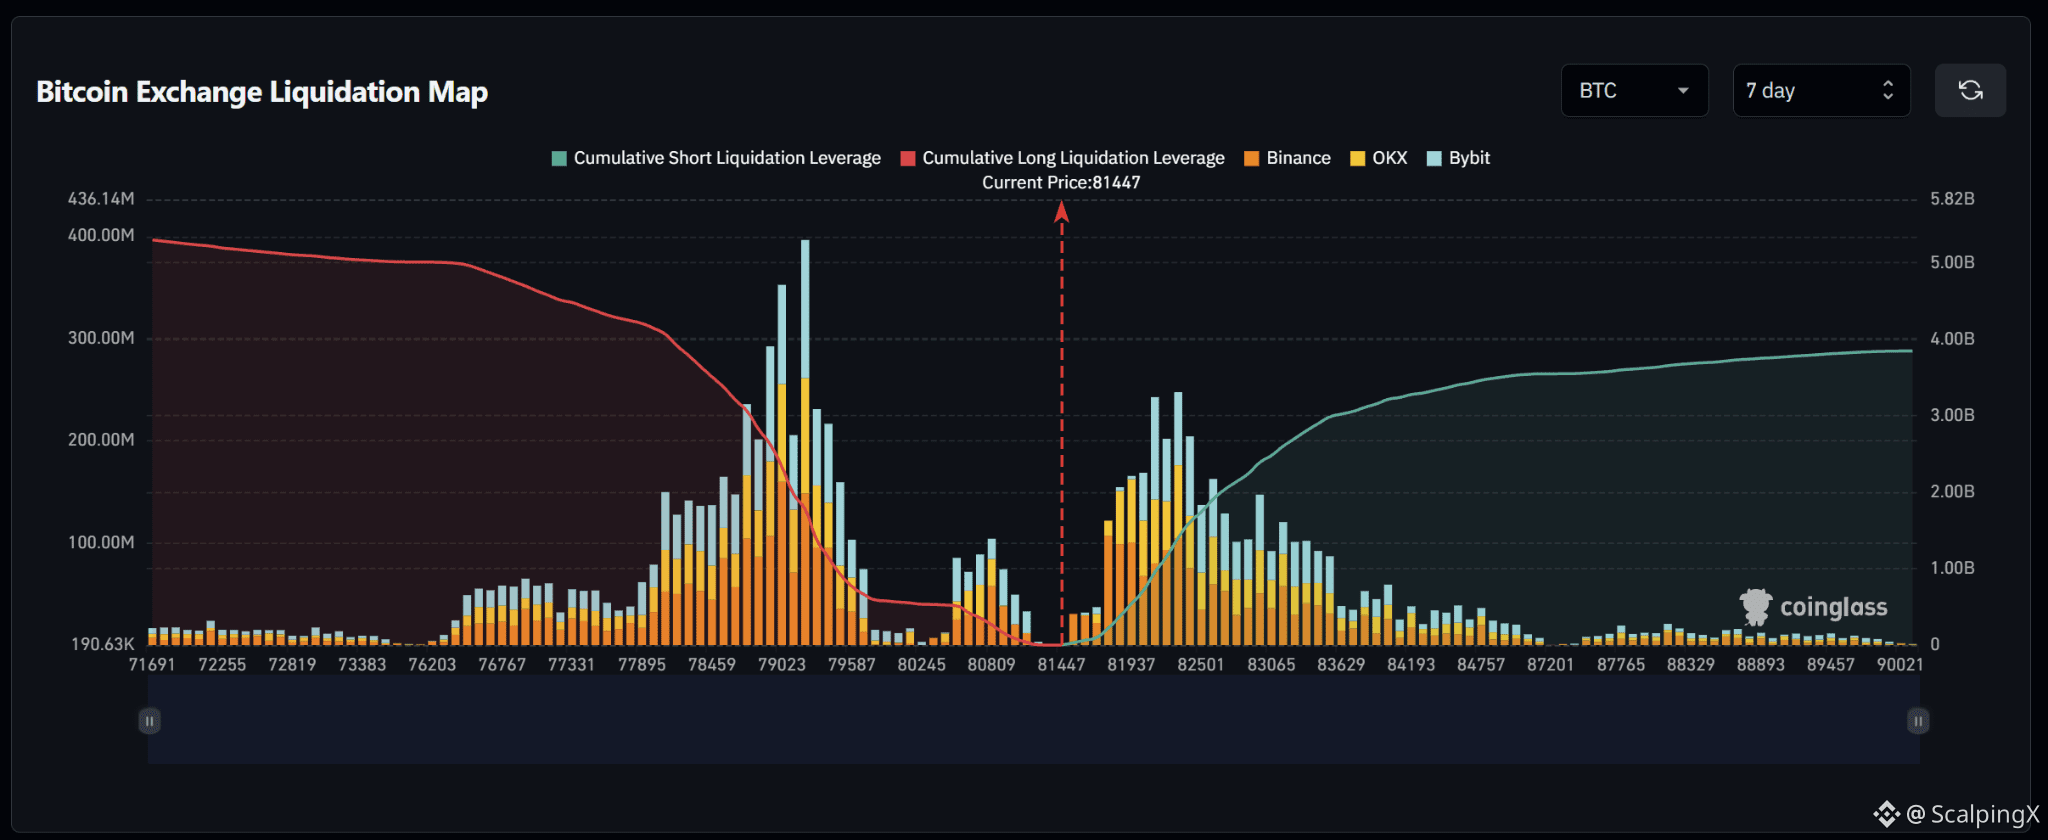
$BTC – Liquidation Map (7 days) – Index ~81,447
🧭 BTC favors an upside short sweep first. Although cumulative long exposure is larger, its strongest cluster sits farther away at 78,900–79,600. The dense short cluster at 81,800–82,500 is closer, making it the preferred initial target.
🔺 The main nearby target is 81,800–82,500, particularly around 82,200–82,300. A break and hold above 82,500 shifts attention to 82,900–83,600. Short liquidations within this band could amplify the advance.
🎯 Liquidation density drops noticeably beyond 83,600. Smaller clusters remain at 84,000–84,800, but further squeeze fuel diminishes; the reaction after the main cluster matters more than chasing higher prices.
⚖️ Losing 80,800 without a reclaim weakens the upside bias and shifts attention to 80,500, then 78,900–79,600. A sweep of 82,200–82,500 followed by a drop below 81,800 would also weaken expectations for continuation.
#LiquidationMap
36
·
--
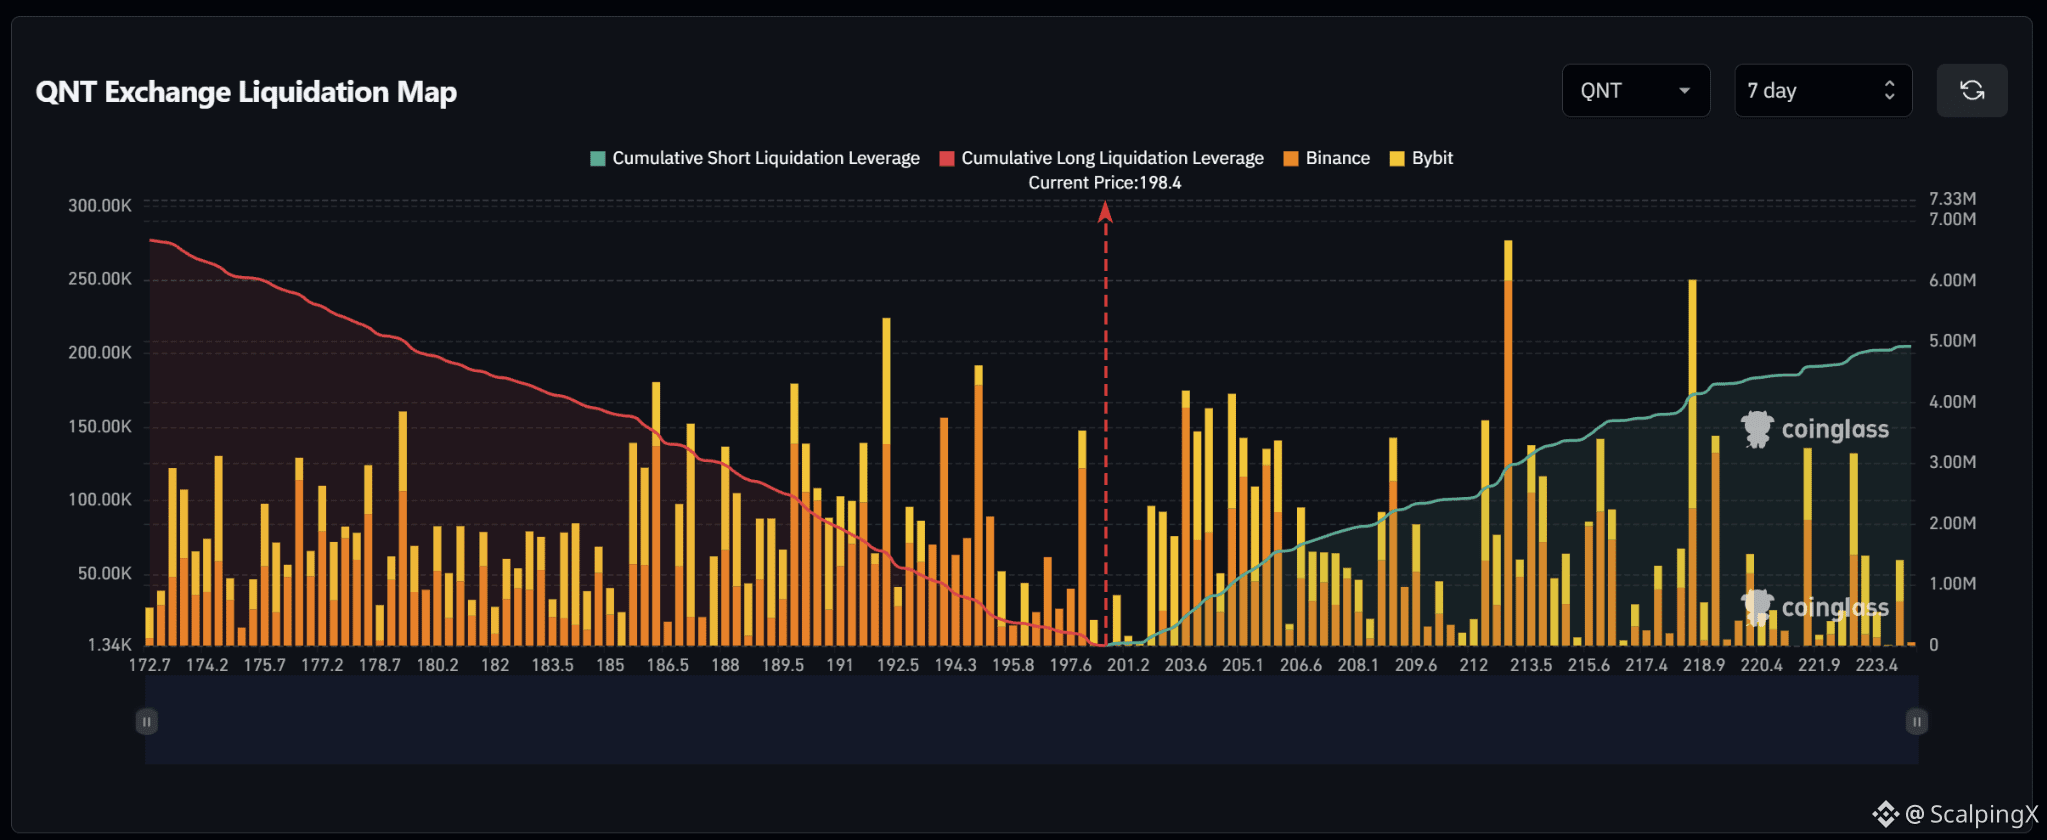
$QNT – Liquidation Map (7 days) – Index ~198.4
🧭 QNT favors a downside long sweep first. Estimated cumulative long liquidations reach roughly $6.7M versus nearly $5M in shorts across the displayed range. The long cluster near 197.6 sits close to price, followed by larger concentrations at 192–195.
🔻 The first target is 197.5–197.8. Losing 197.5 without a reclaim shifts attention to 194.3–194.8, then 191.5–192.5. Long liquidations across these clusters could amplify the decline.
🎯 A break below 191.5 opens targets around 189.5–190, then 186–187. However, sweeping the 192 cluster and reclaiming 194.8 would weaken expectations for further downside; avoid chasing after the liquidation move.
⚖️ A break and hold above 201.2 weakens the downside priority and shifts attention to shorts at 202–206. Holding above 206 opens 212–214, featuring the map’s largest liquidation spike near 213.
#LiquidationMap
121
·
--
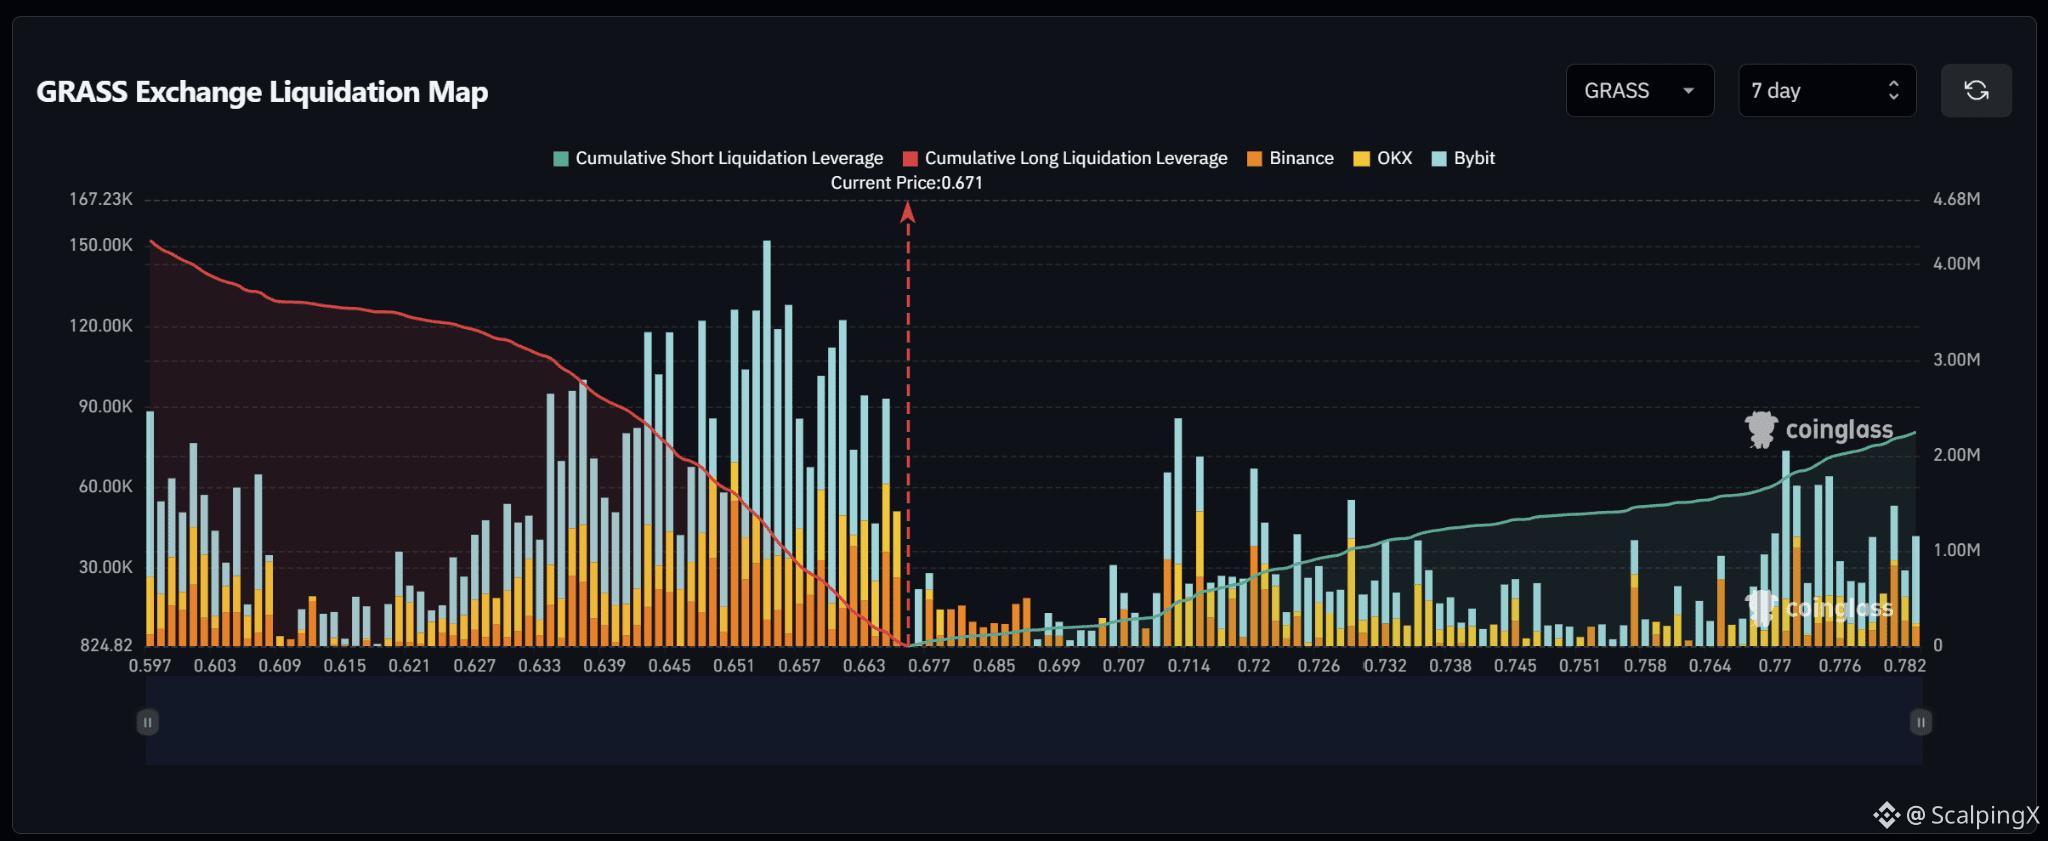
$GRASS – Liquidation Map (7 days) – Index ~0.671
🧭 GRASS favors a downside long sweep first. Estimated cumulative long liquidations reach roughly $4.3M, nearly twice short exposure across the displayed range. The dense long band at 0.645–0.665 sits close to price and outweighs nearby overhead clusters.
🔻 The first target is 0.660–0.665. Losing 0.660 without a reclaim shifts attention to 0.651–0.657, featuring the largest liquidation spike near 0.654. Long liquidations there could amplify the decline.
🎯 A break below 0.651 opens targets at 0.643–0.647, then 0.635–0.640. However, sweeping near 0.654 and reclaiming 0.657 would weaken further downside expectations; avoid chasing after the large cluster has been cleared.
⚖️ A break and hold above 0.685 weakens the downside-first scenario. Liquidation density is thin across 0.685–0.707, with the notable short cluster at 0.711–0.722 becoming the upside target if recovery holds.
#LiquidationMap
27
·
--
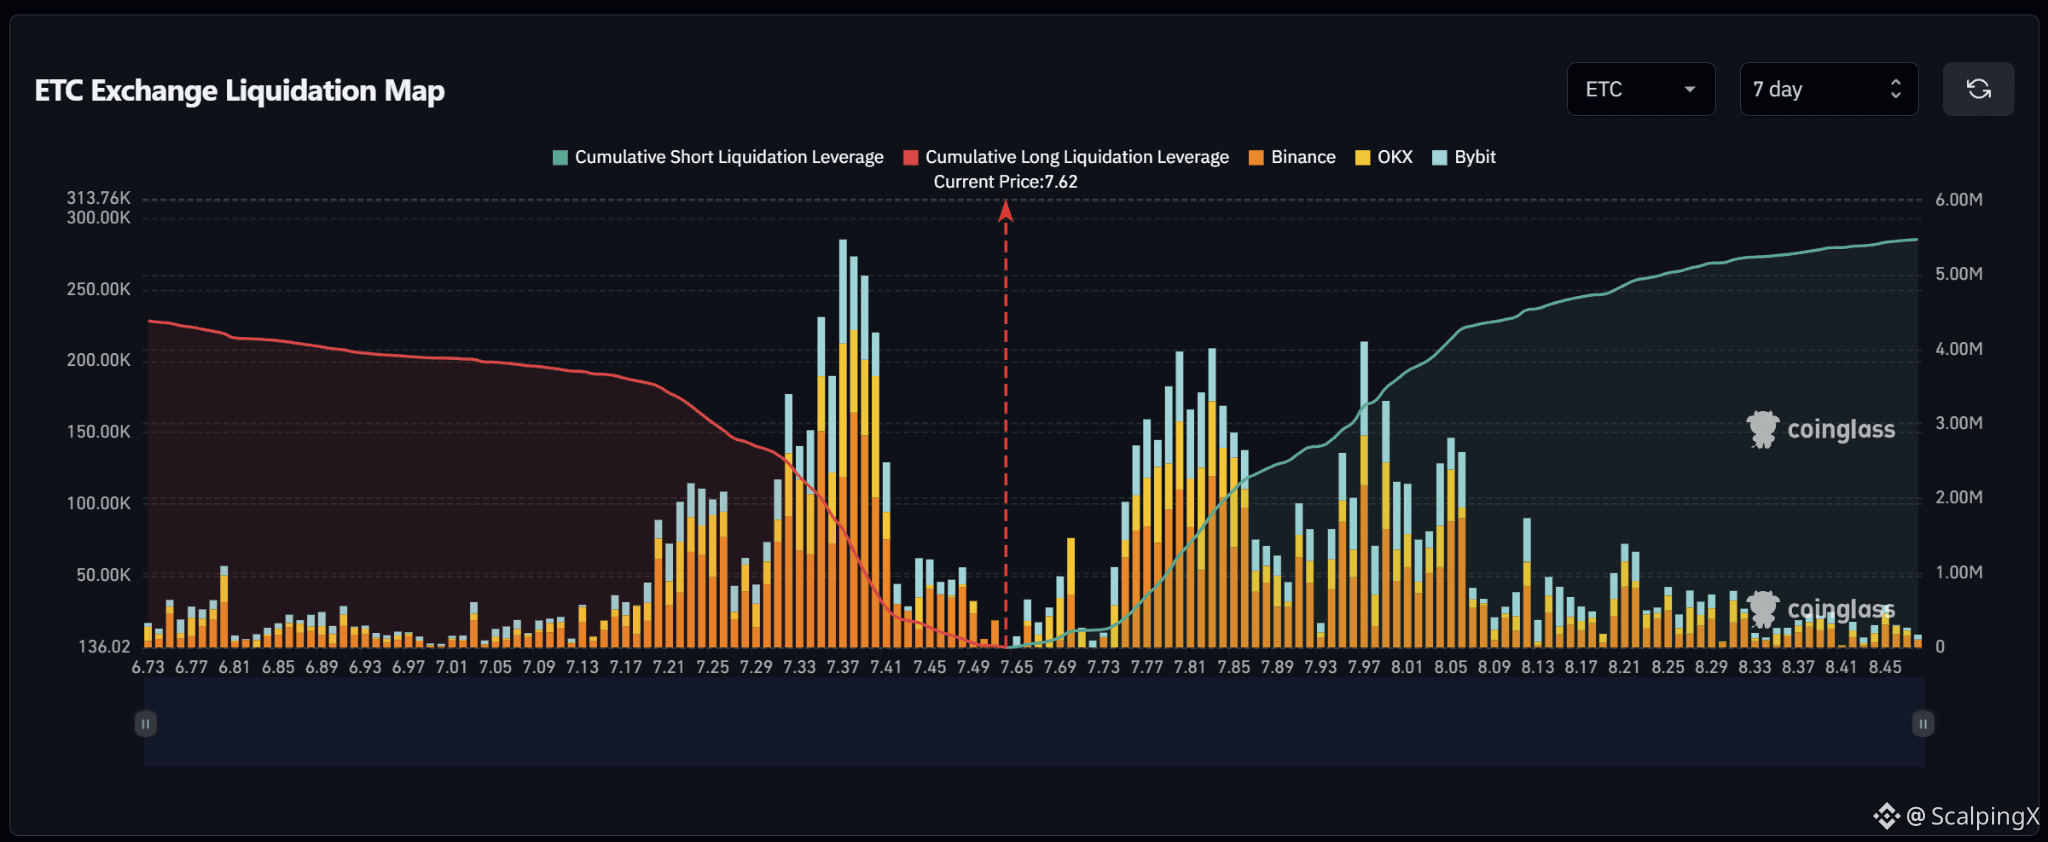
$ETC – Liquidation Map (7 days) – Index ~7.62
🧭 ETC favors an upside short sweep first. The 7.75–7.85 cluster sits closer to price than the heavy long concentration at 7.33–7.41, with another notable short band following at 7.95–8.06.
🔺 Liquidation density is relatively thin across 7.65–7.73. The main nearby target is 7.75–7.85, particularly around 7.80 and 7.83. Short liquidations there could amplify the advance as price enters the zone.
🎯 A break and hold above 7.85 shifts attention to 7.95–8.06.
Density drops noticeably beyond that band, making the reaction after a sweep more important than chasing farther targets.
⚖️ Losing 7.49 without a reclaim weakens the upside bias and shifts attention to the long cluster at 7.33–7.41, particularly 7.37–7.39. A sweep of 7.80–7.85 followed by a drop below 7.75 would also weaken expectations for continuation.
#LiquidationMap
24
·
--
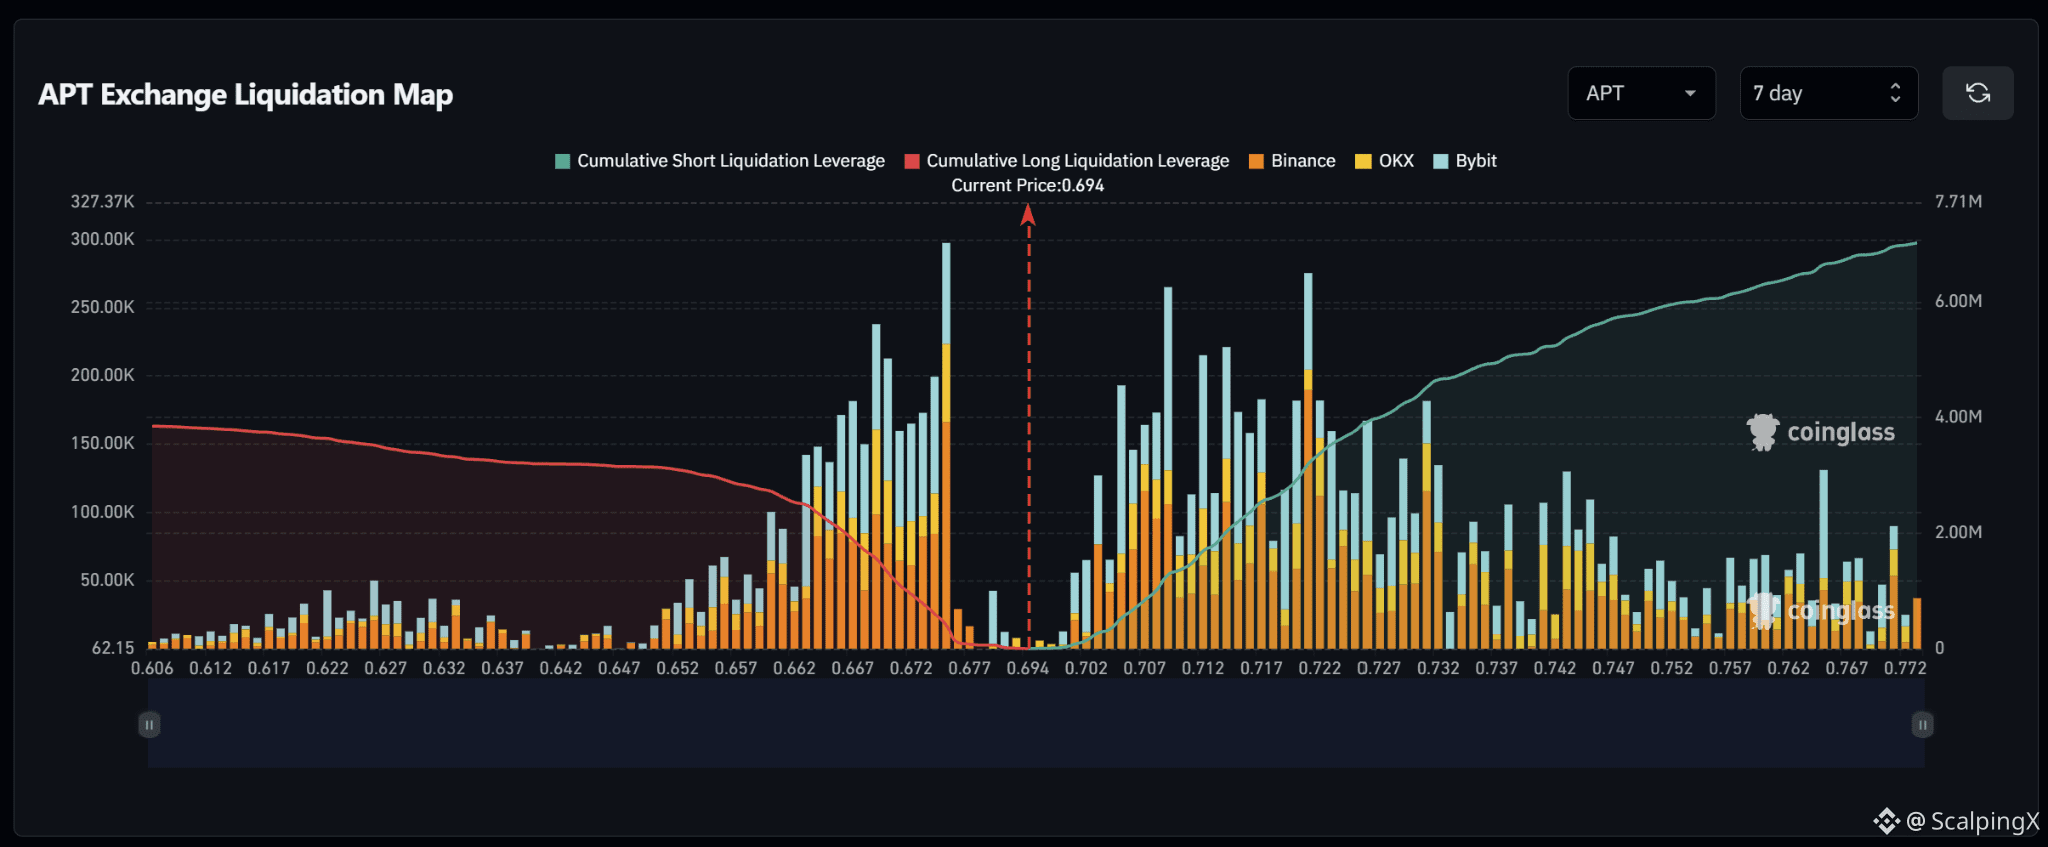
$APT – Liquidation Map (7 days) – Index ~0.694
🧭 APT favors an upside short sweep first. Estimated cumulative short liquidations reach roughly $7M, nearly twice long exposure across the displayed range. Successive clusters at 0.702–0.722 provide clear upside targets.
🔺 The first target is 0.702–0.710. A break and hold above 0.710 shifts attention to 0.712–0.722, particularly around 0.720–0.721. Short liquidations there could amplify the advance.
🎯 Holding above 0.722 opens targets at 0.727–0.732, then 0.740–0.747. Liquidation density gradually decreases beyond the main band, making sustained strength after each cluster important before expecting further extension.
⚖️ Losing 0.687 without a reclaim weakens the upside bias and shifts attention to the long cluster at 0.672–0.677, then 0.663–0.669. Avoid chasing if price sweeps the first cluster and falls back below 0.702.
#LiquidationMap
31
·
--
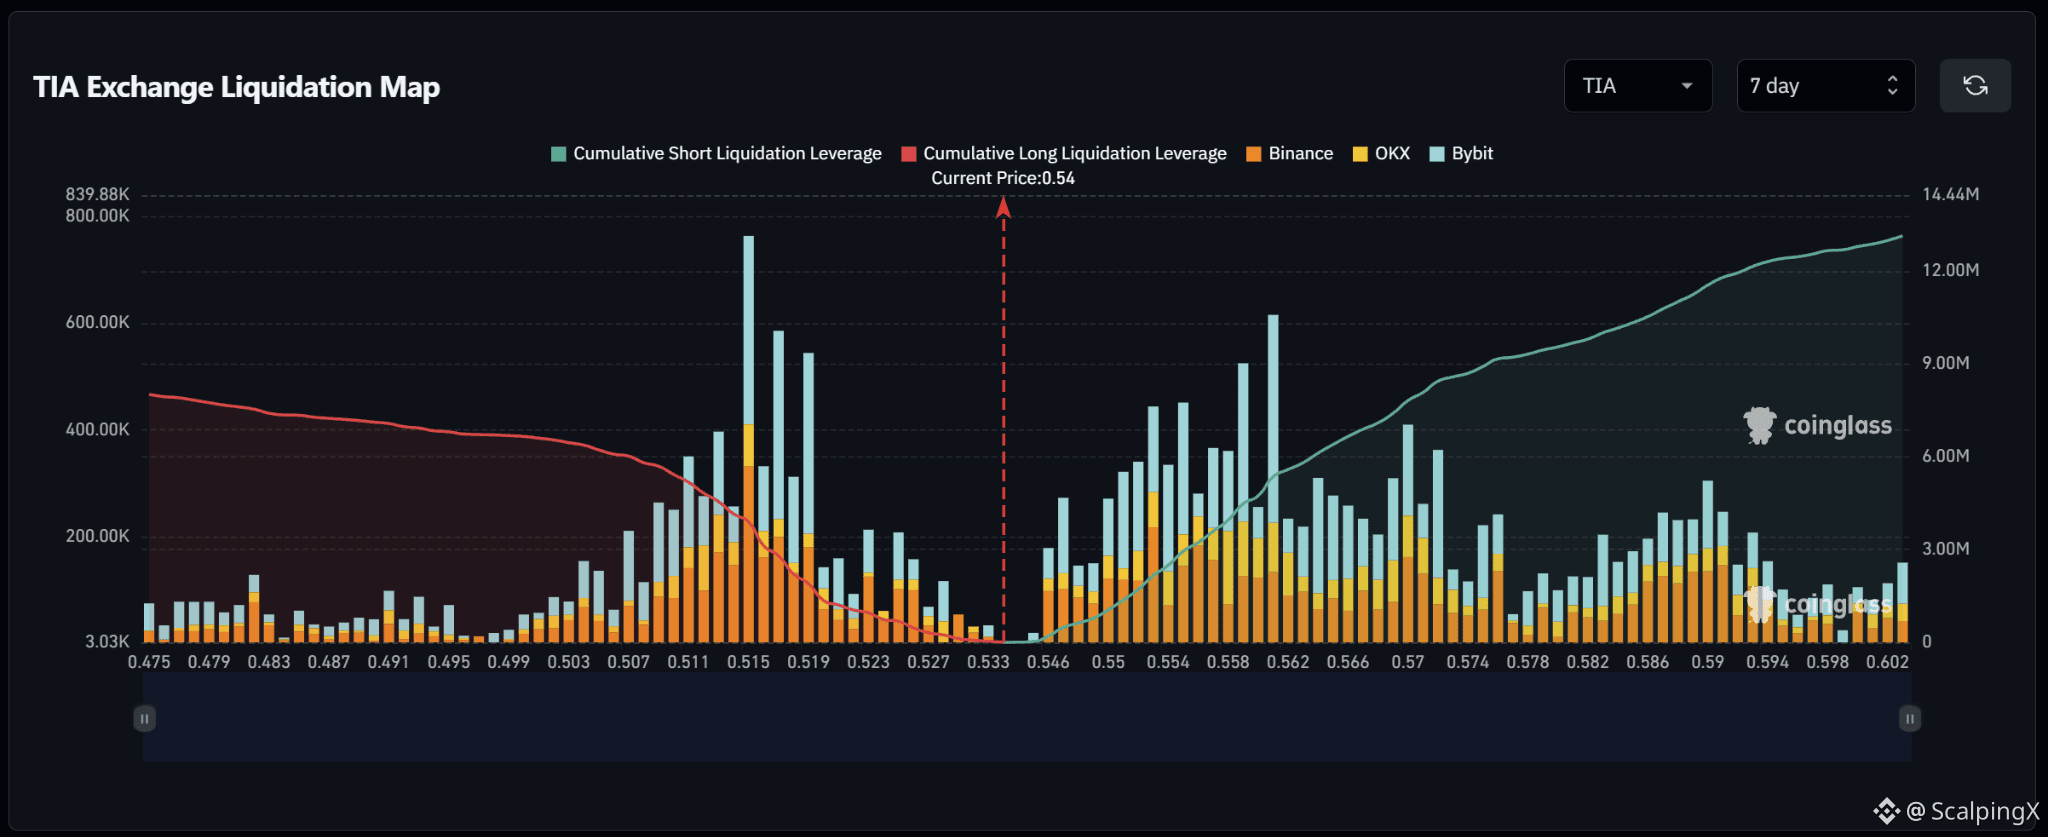
$TIA – Liquidation Map (7 days) – Index ~0.540
🧭 TIA favors an upside short sweep first. Estimated cumulative short liquidations reach roughly $13M versus nearly $8M in longs across the displayed range. The short cluster at 0.546–0.562 sits closer than the heavy long concentration at 0.511–0.519.
🔺 The first target is 0.546–0.554. A break and hold above 0.554 shifts attention to 0.558–0.562, particularly near 0.561. Successive large liquidation spikes could amplify the squeeze within this band.
🎯 Holding above 0.562 opens targets at 0.566–0.572, then 0.586–0.592. Density eases between those zones, making sustained strength after the first cluster key to an extended move.
⚖️ Losing 0.533 without a reclaim weakens the upside bias and shifts attention to 0.523–0.527, then 0.511–0.519, featuring the largest spike near 0.515. Avoid chasing if price sweeps 0.558–0.562 and falls back below 0.554.
#LiquidationMap
33
·
--
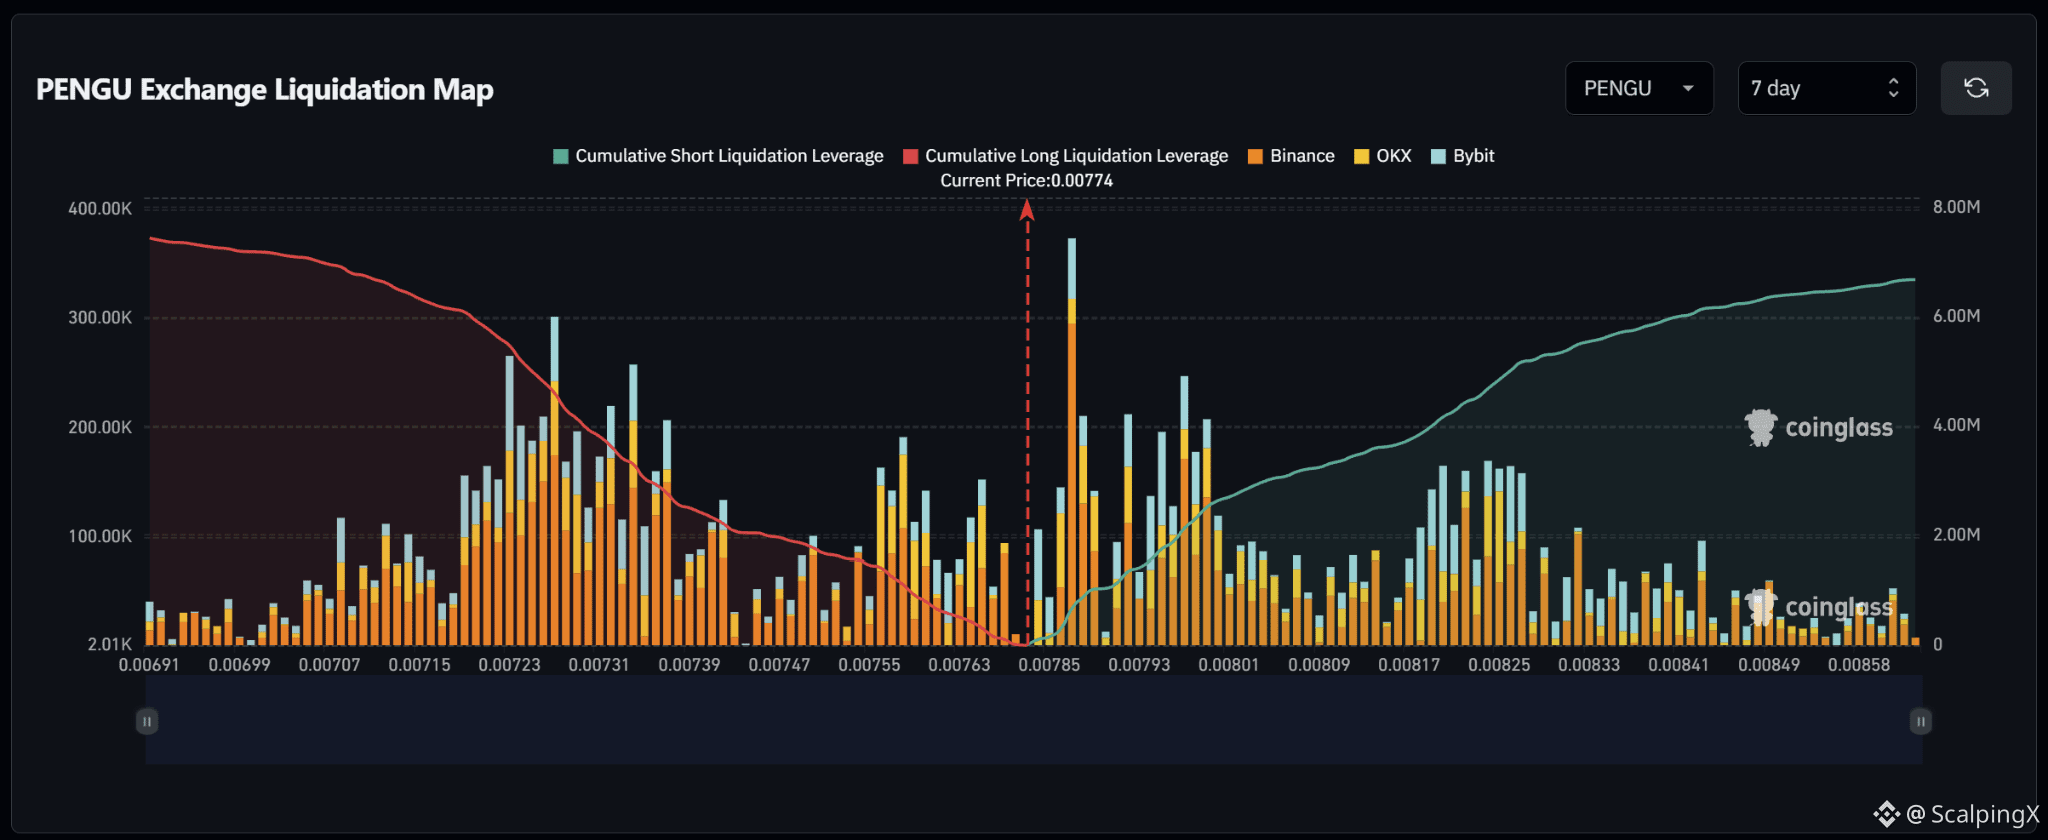
$PENGU – Liquidation Map (7 days) – Index ~0.00774
🧭 PENGU favors an upside short sweep first. Cumulative liquidation exposure is fairly balanced, but the map’s largest liquidation spike sits just overhead near 0.00787, followed by the 0.00793–0.00800 cluster.
🔺 The first target is 0.00785–0.00790. A break and hold above 0.00790 shifts attention to 0.00793–0.00800. Short liquidations across these adjacent clusters could amplify the advance.
🎯 Holding above 0.00800 opens the farther target at 0.00818–0.00826. Liquidation density is lower between these zones, making sustained price strength after the first cluster key to an extended move.
⚖️ Losing 0.00763 without a reclaim weakens the upside bias and shifts attention to 0.00755–0.00759, then the large long cluster at 0.00723–0.00737. Avoid chasing if price sweeps near 0.00787 and falls back below 0.00785.
#LiquidationMap
9
·
--
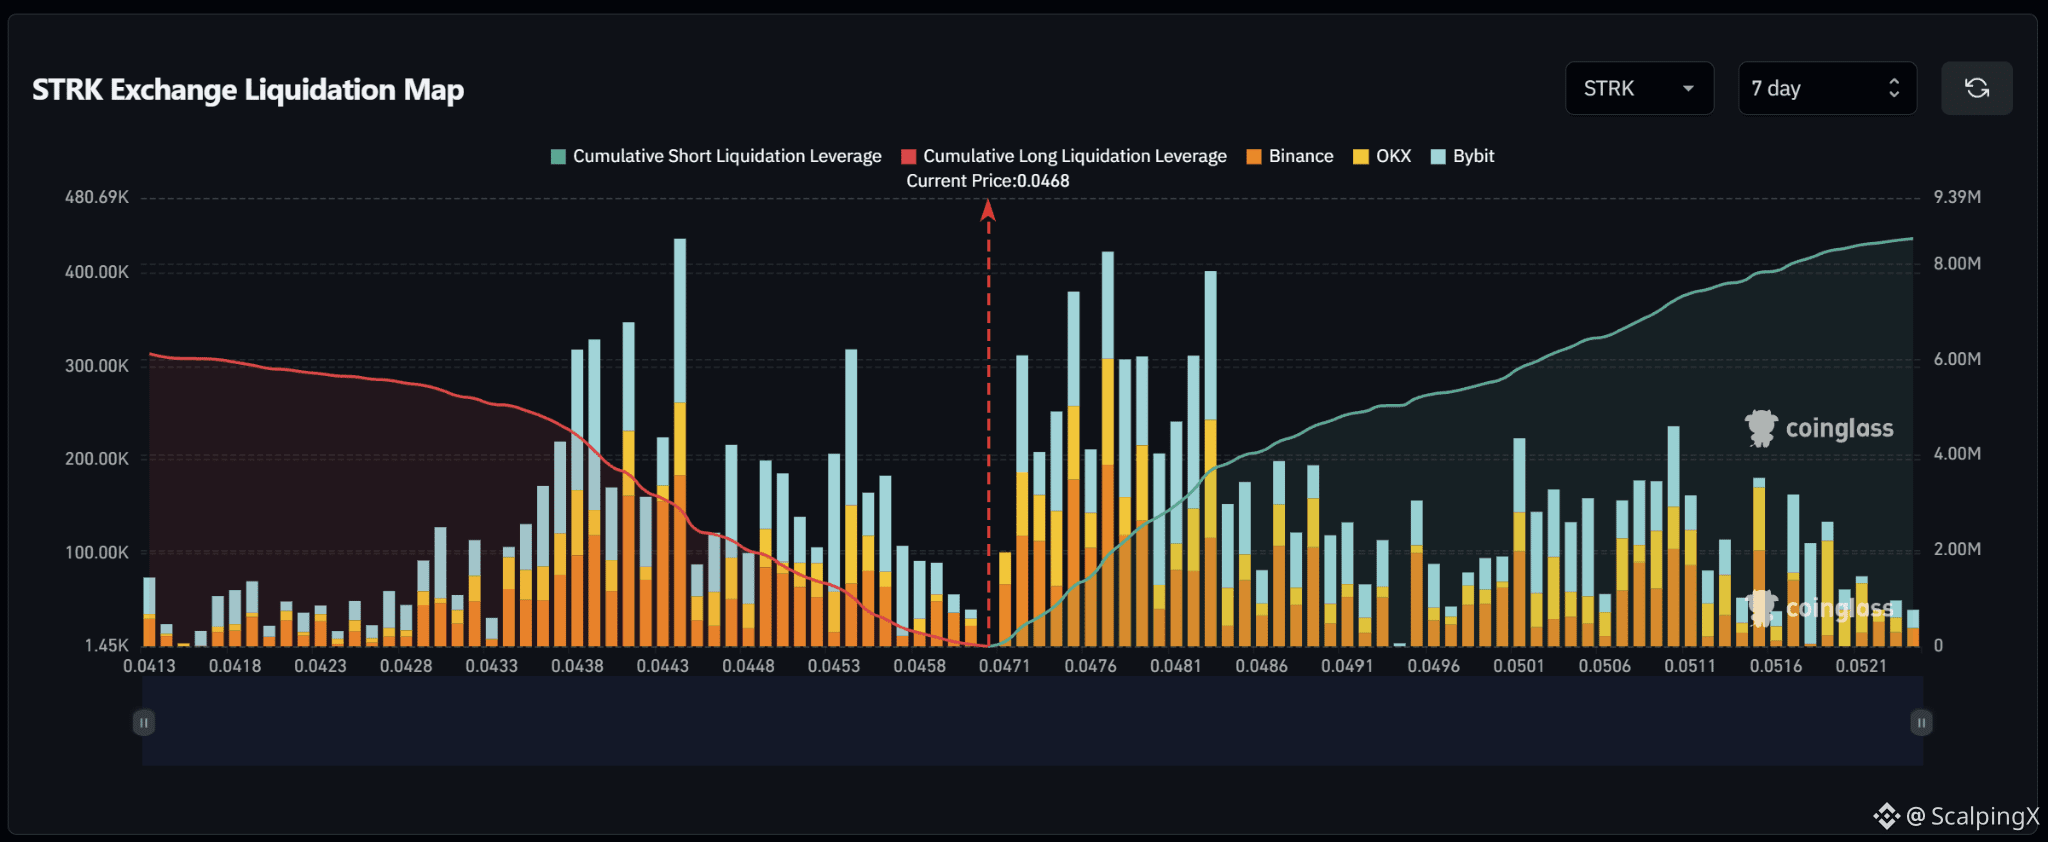
$STRK – Liquidation Map (7 days) – Index ~0.0468
🧭 STRK favors an upside short sweep first. Estimated cumulative short liquidations reach roughly $8.5M versus just over $6M in longs across the displayed range. The dense short cluster at 0.0471–0.0483 sits close to price.
🔺 The first target is 0.0471–0.0477. A break and hold above 0.0477 shifts attention to 0.0481–0.0483. Successive large liquidation spikes could amplify the squeeze through this zone.
🎯 Holding above 0.0483 opens targets at 0.0486–0.0490, then 0.0501–0.0511. Density decreases beyond the first cluster, making the reaction around 0.0483 key to expectations for an extended move.
⚖️ Losing 0.0465 without a reclaim weakens the upside bias and shifts attention to 0.0453–0.0458, then the large long cluster at 0.0438–0.0444. Avoid chasing if price sweeps 0.0477 and falls back below 0.0471.
#LiquidationMap
1
108
·
--
Рост
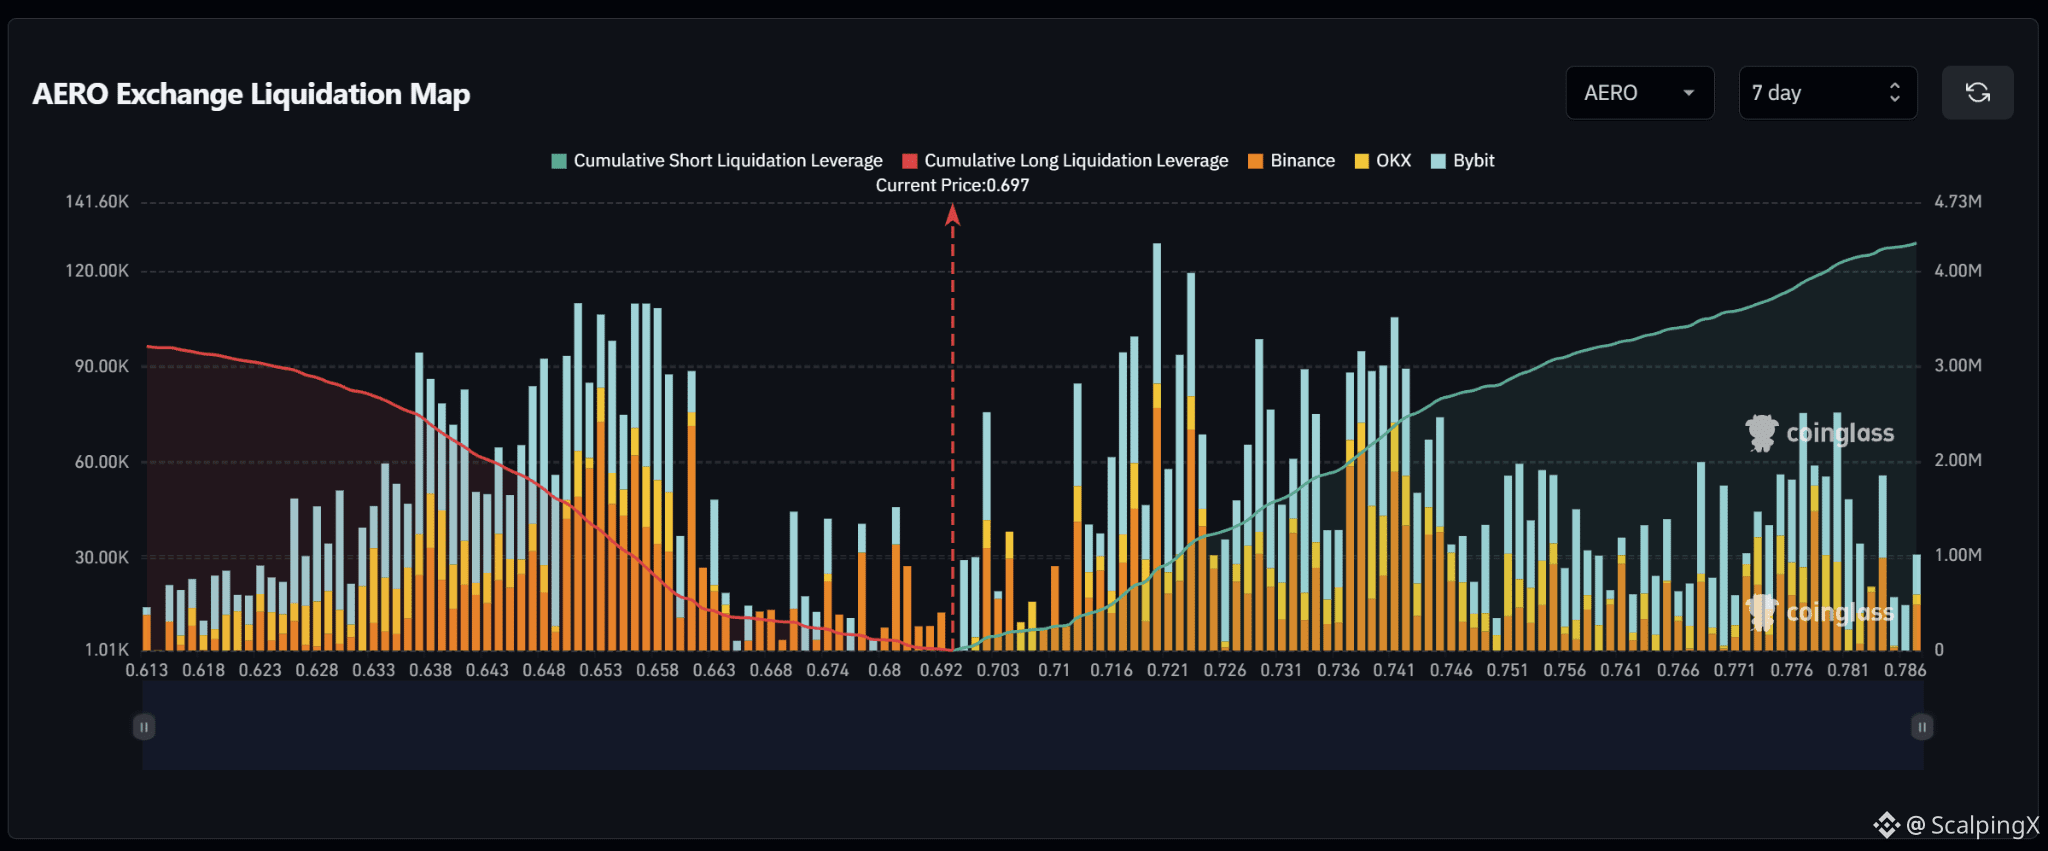
$AERO – Liquidation Map (7 days) – Index ~0.697
🧭 AERO favors an upside short sweep first. Estimated cumulative short liquidations total roughly $4.3M versus $3.2M in longs across the displayed range. The large short cluster at 0.713–0.723 also sits closer than the heaviest long zone at 0.648–0.662.
🔺 The nearest target is 0.700–0.703. A break and hold above 0.703 shifts attention to 0.713–0.723, particularly around 0.719 and 0.722. Short liquidations within this band could amplify the advance.
🎯 Holding above 0.723 opens the next target at 0.737–0.745, where several large liquidation spikes sit together. Density eases beyond that cluster before another concentration around 0.776–0.781.
⚖️ Losing 0.692 without a reclaim weakens the upside bias and shifts attention to 0.674–0.683, then 0.648–0.662. A sweep of 0.719–0.723 followed by a drop below 0.713 would also weaken continuation and argue against chasing a fading squeeze.
#LiquidationMap
9
·
--
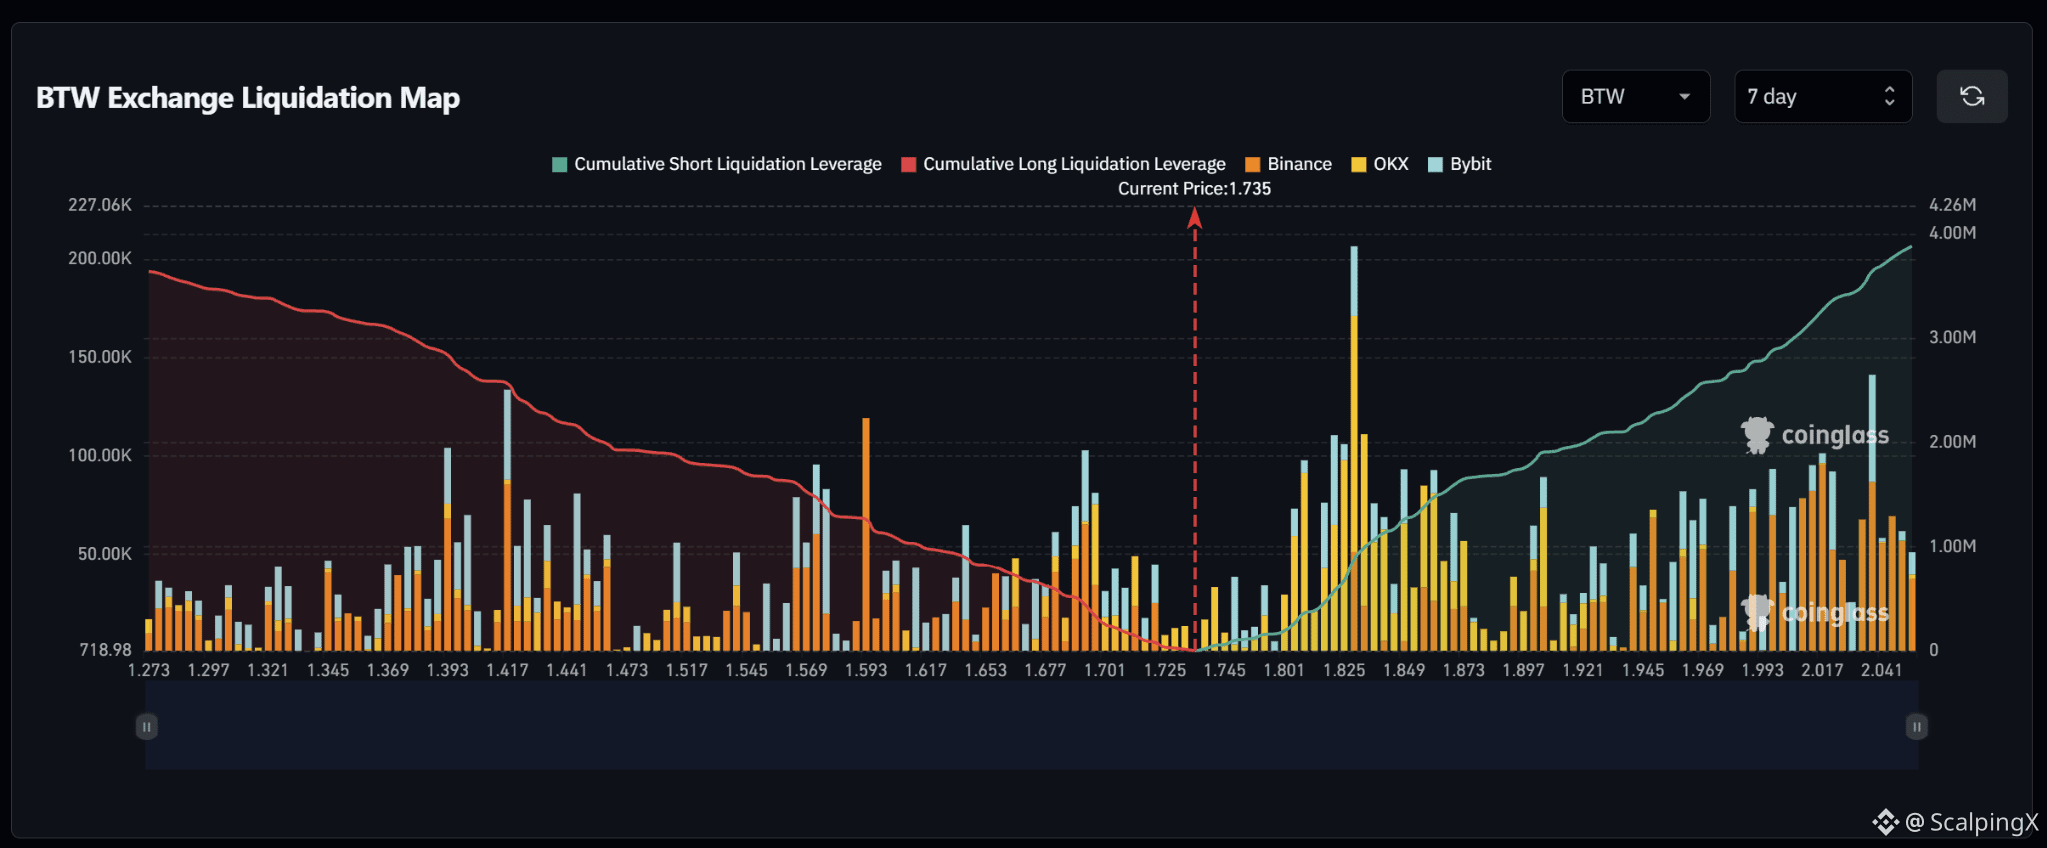
$BTW – Liquidation Map (7 days) – Index ~1.735
🧭 BTW favors a downside long sweep first. Cumulative liquidation exposure is fairly balanced, but the long cluster at 1.68–1.71 sits closer than the large short cluster at 1.80–1.87. That proximity makes the downside more relevant for the initial move.
🔻 Losing 1.725 without a reclaim opens targets at 1.70–1.71, then 1.68–1.69. Concentrated liquidation spikes near 1.69 could amplify the decline as price enters the zone.
🎯 A break below 1.68 opens targets at 1.65, then 1.57–1.60. However, sweeping the nearby cluster and reclaiming 1.71 would weaken expectations for further downside; avoid chasing after those longs have been liquidated.
⚖️ A break and hold above 1.80 invalidates the downside priority and shifts attention to shorts at 1.82–1.87. The map’s largest liquidation spike sits near 1.83, making this a potential squeeze acceleration zone if reached.
#LiquidationMap
100
·
--
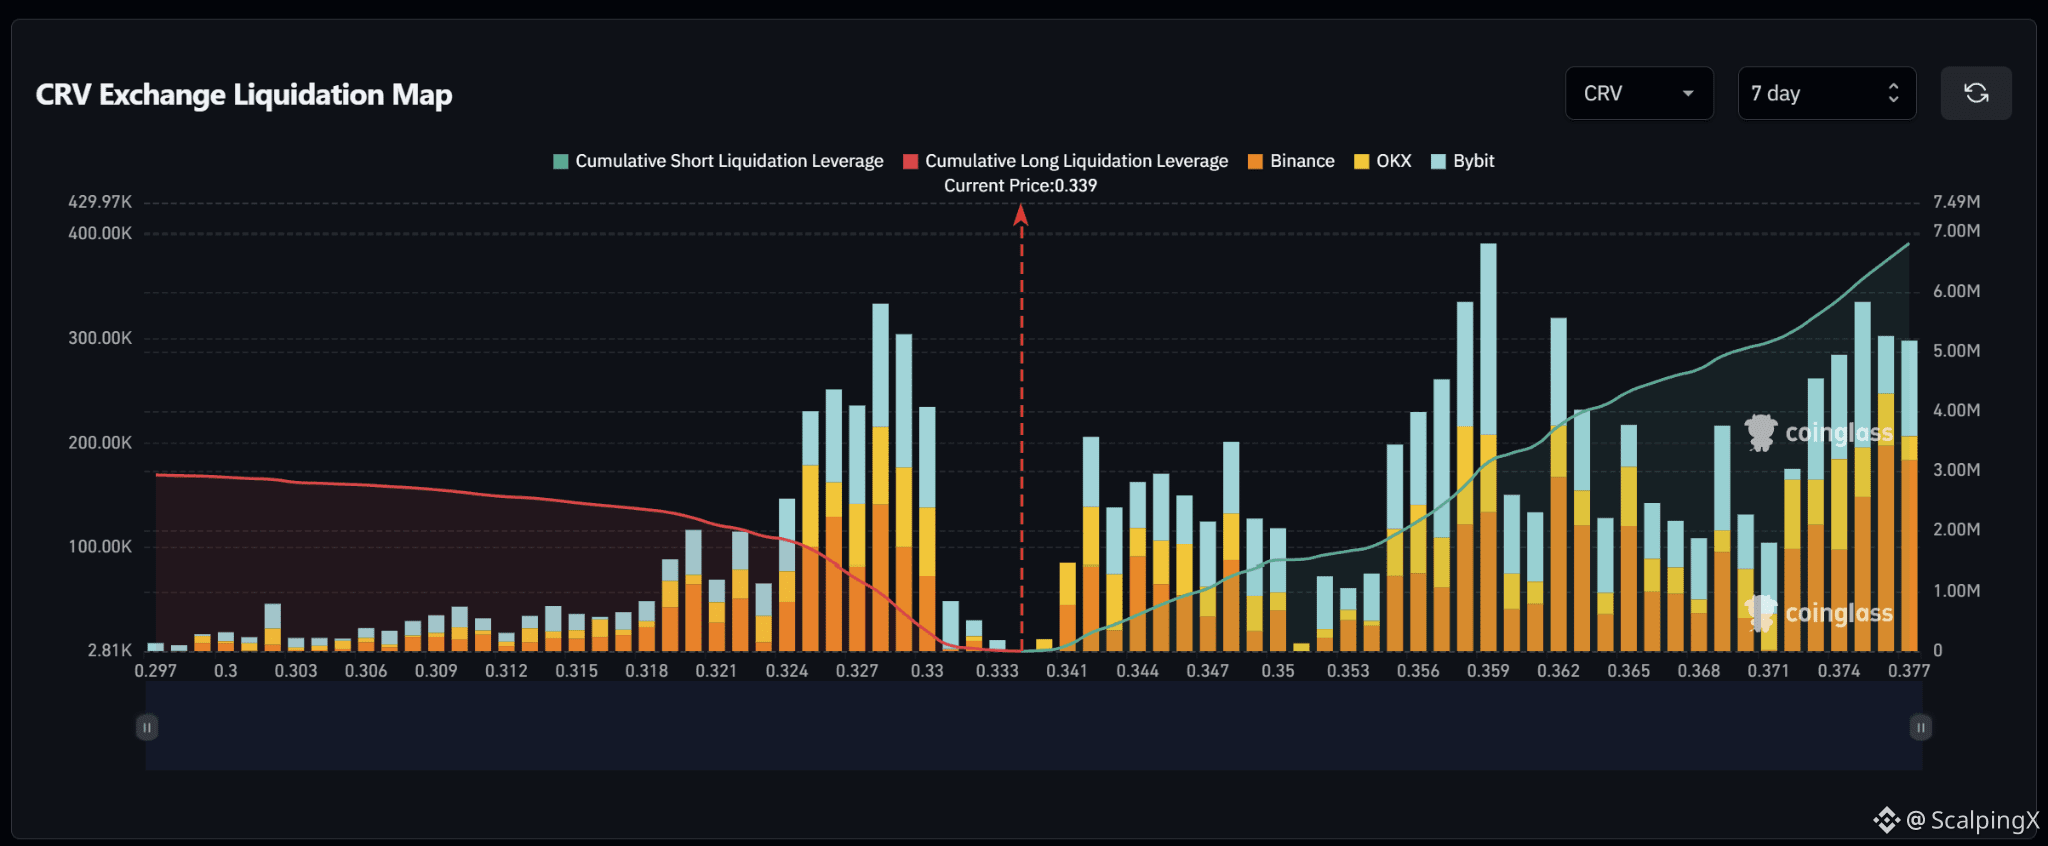
$CRV – Liquidation Map (7 days) – Index ~0.339
🧭 CRV favors an upside short sweep. Estimated cumulative short liquidations reach roughly $6.8M, more than twice the nearly $3M in longs across the displayed range. Successive overhead clusters stand out, particularly at 0.355–0.363.
🔺 The first target is 0.341–0.350. A break and hold above 0.350 shifts attention to 0.355–0.359, featuring the map’s largest liquidation spike near 0.359. Short liquidations there could amplify the advance.
🎯 Holding above 0.359 opens targets at 0.362–0.365, then 0.372–0.377. Liquidation density increases again in the latter zone, but continuation requires holding reclaimed levels.
⚖️ Losing 0.333 without a reclaim weakens the upside bias and shifts attention to the long cluster at 0.324–0.330. A sweep of 0.355–0.359 followed by a drop below 0.355 would also reduce expectations for continuation and argue against chasing a fading squeeze.
#LiquidationMap
10
·
--
Рост
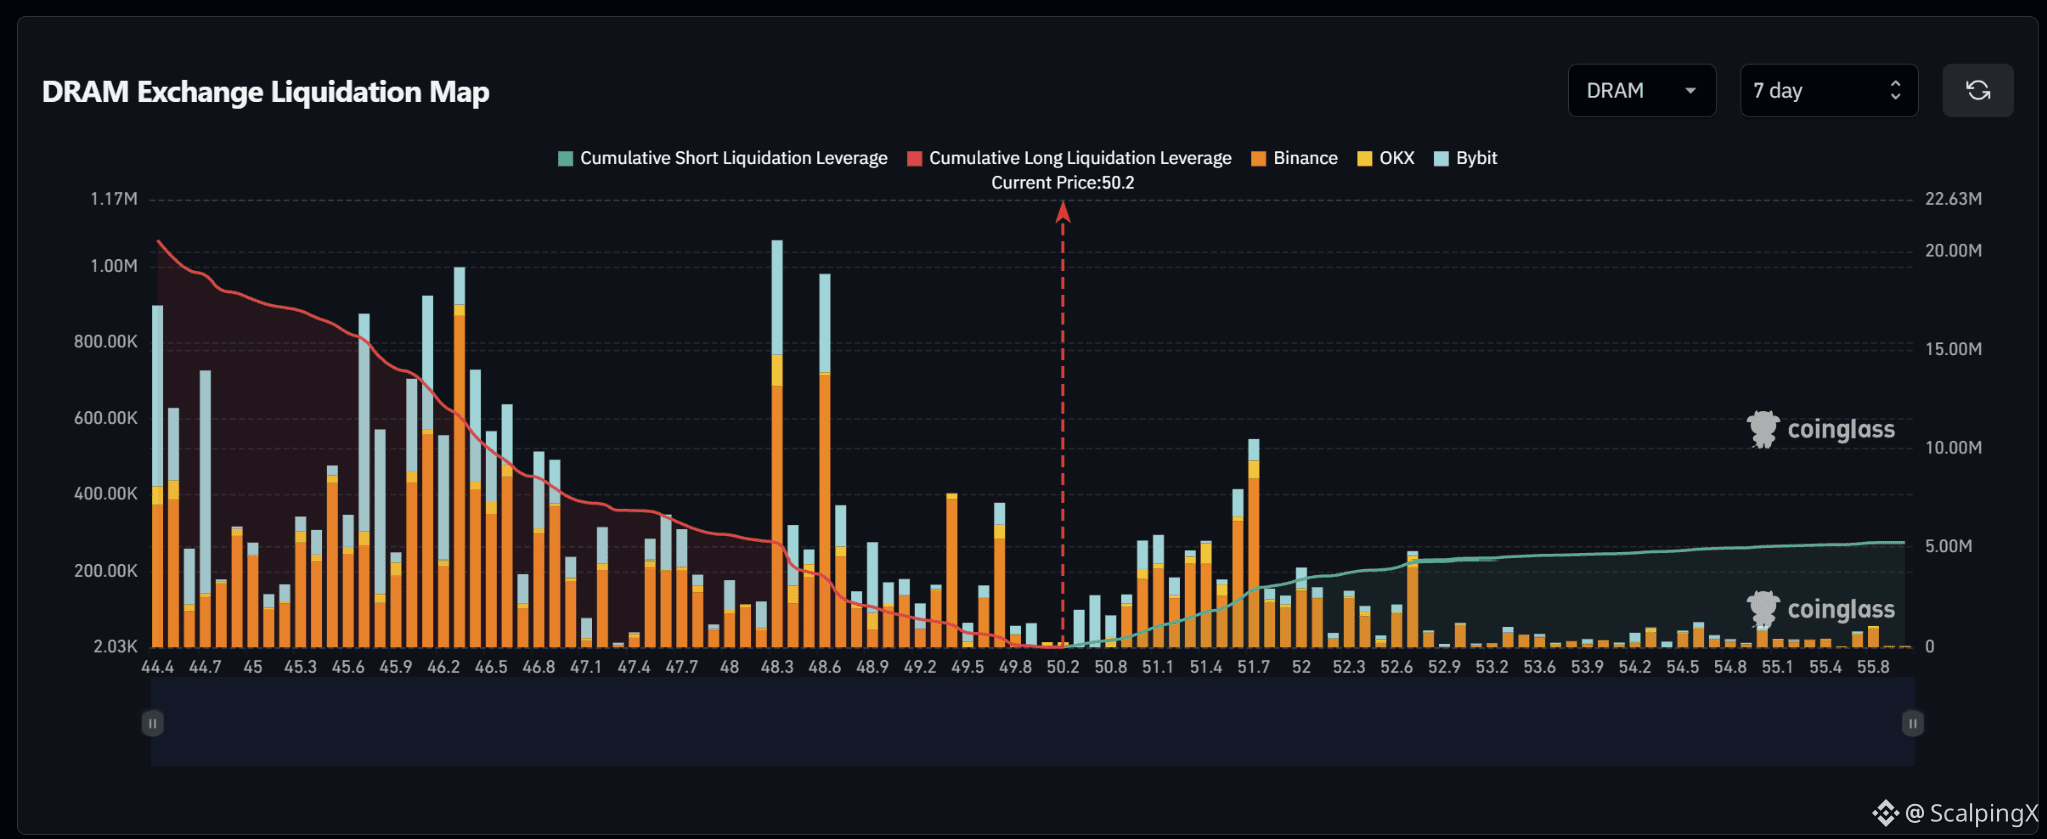
$DRAM – Liquidation Map (7 days) – Index ~50.2
🧭 DRAM favors a downside long sweep. Estimated cumulative long liquidations exceed $20M, roughly four times short exposure across the displayed range. Several large clusters sit below, while short liquidations concentrate mainly below 52.7.
🔻 The first target is 49.5–49.8. Losing 49.5 without a reclaim shifts attention to 48.3–48.6, featuring two prominent liquidation spikes. Long liquidations there could amplify the decline.
🎯 A break below 48.3 opens the extended target at 46.0–46.5. However, sweeping 48.3 and reclaiming 48.6 would weaken expectations for further downside; the reaction after the large cluster matters more than chasing price.
⚖️ Overhead, 50.8–51.7 is the short-liquidation zone to watch. A break and hold above 51.7 invalidates the downside priority and shifts attention to 52.0–52.7. Density becomes very thin beyond that zone, limiting further squeeze fuel.
#LiquidationMap
7
Войдите, чтобы посмотреть больше материала
Присоединяйтесь к пользователям криптовалют по всему миру на Binance Square
⚡️ Получайте новейшую и полезную информацию о криптоактивах.
💬 Нам доверяет крупнейшая в мире криптобиржа.
👍 Получите достоверные аналитические данные от верифицированных создателей контента.
Эл. почта/номер телефона
В тренде
1
#$1.5BInLeveragedCryptoBetsLiquidated
Просмотров: 2,241
43 обсуждают
2
#KOSPIFalls3.53%BackBelow6000
Просмотров: 5,017
188 обсуждают
3
#USMidtermElections
Просмотров: 112,755
1,453 обсуждают
4
#StrategySTRCReaches$99.95ForFirstTimeIn165Days
Просмотров: 1,797
56 обсуждают
5
#BinanceWillListPredictPREDICT
Просмотров: 28,634
652 обсуждают
6
#SwitzerlandFirstSpotBitcoinETFExpectedToTradeInNovember
Просмотров: 1,201
68 обсуждают
7
#StrategyReports$21BQ3OperatingProfit
Просмотров: 1,267
41 обсуждают
8
#TwoAddressesHoldingAbout1.28BUSDTFrozen
Просмотров: 14,432
372 обсуждают
9
#FirstDigitalBlacklistsAttackerAddressHoldingAbout3.4MFDUSD
Просмотров: 501
16 обсуждают
10
#BitcoinDropsBelow$80K
Просмотров: 70,292
169 обсуждают