

#emacrossover
emacrossover
Просмотров: 11,072
40 обсуждают
Популярные
Новые

·
--
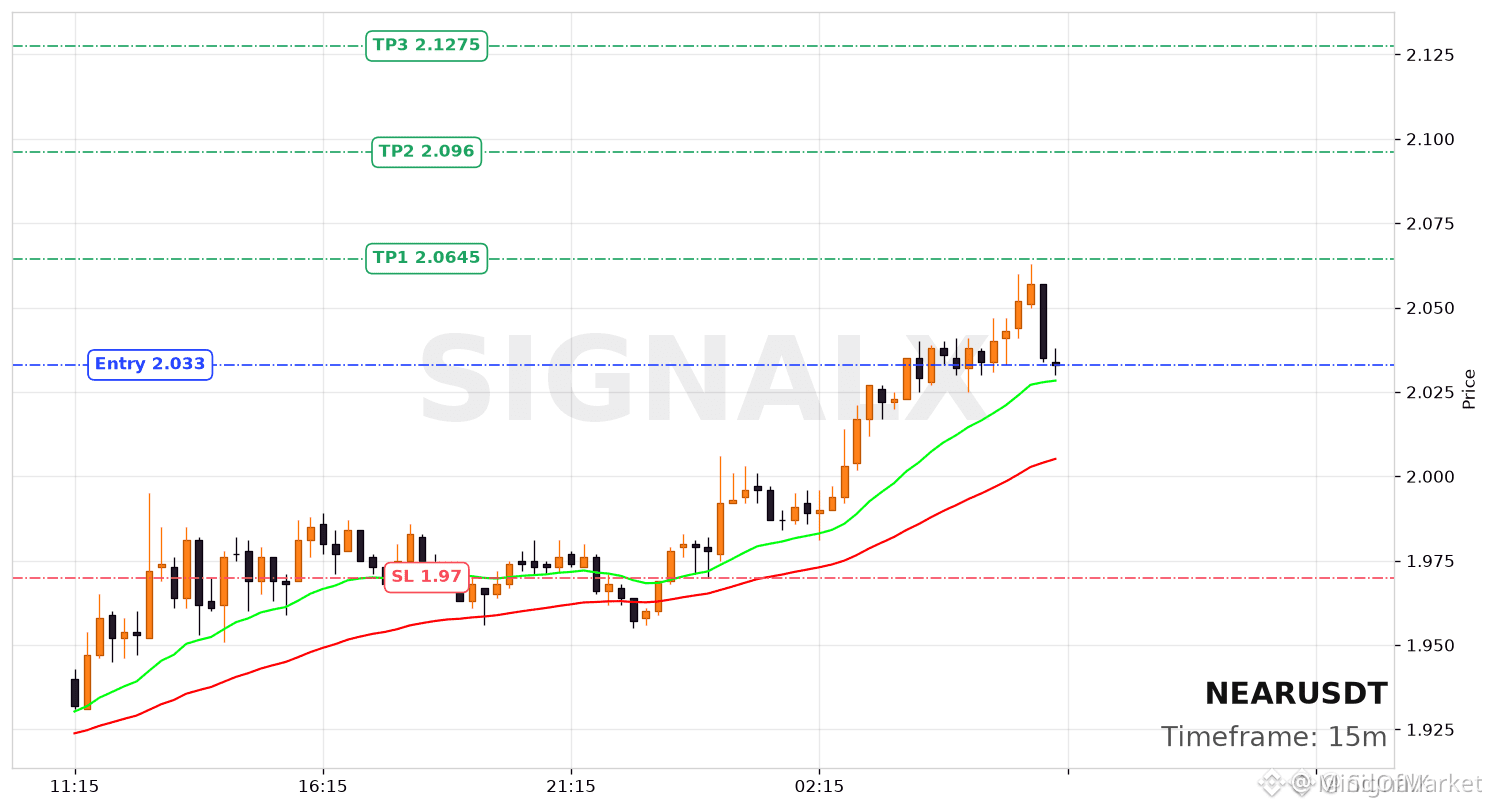
$NEAR 15M EMA CROSSOVER COULD SPARK A TREND REVERSAL 📊
Entry: 2.033 🔥
Target 1: 2.0645 🚀
Target 2: 2.096 🚀
Target 3: 2.1275 🚀
Stop Loss: 1.97 ⚠️
The 15‑minute EMA20 and EMA50 just aligned with higher timeframe structure, giving a 75% bias toward an uptrend. RSI remains healthy, suggesting room to run. This setup sits directly in conflict with current bearish sentiment—making it a textbook high‑probability contrarian play.
Volume is still subdued, so the real confirmation will come on the next push through 2.064. Are you buying the early signal or waiting for a retest of 2.033?
Not financial advice. Always manage your risk.
#NEAR #LongSetup #EMACrossover #Crypto
🔥
60


Статья
SOL en el microscopio de MELABOT: Liquidez, Volatilidad y el Cruce de EMAsSolana (SOL) cotiza hoy en ~$68.30, acumulando una caída del -4.87% en 24h y un desplome del ~75% desde su ATH de enero 2025 (≈$260-$295). No es un movimiento menor: es una corrección estructural que merece un análisis profundo con los filtros de MELABOT. Vamos a desglosarlo.
1️⃣ Liquidez: El Dilema de la Fuga La liquidez de SOL en Binance es alta: $2.37 mil millones en volumen diario y un spread de solo 0.02% en 40 mercados. Pero ojo: la liquidez on-chain está sangrando.
TVL en DeFi: Cayó a $4.87 mil millones, un 9.55% solo en la última semana.
Actividad en Red: El volumen de DEX sigue siendo potente ($70 mil millones/semana), pero la actividad general en la red ha caído un 80% en tres meses, y las comisiones están en mínimos.
Conclusión MELABOT: Hay liquidez para operar (buen slippage), pero el capital está saliendo de los protocolos de SOL. Esto indica que los inversores no están apostando por el ecosistema a largo plazo, sino tradando el token. ⚠️
2️⃣ Volatilidad: El "High-Beta" que duele SOL es un activo de alta beta: cuando el mercado sube, sube más; cuando cae, se desploma. Las cifras lo confirman:
Volatilidad Realizada (anualizada): 1-semana ~41%, 1-mes ~43%, 3-meses ~55%.
Rango de Precio (hoy): Ha oscilado entre $66.37** y **$72.05 en las últimas horas.
Factor Macroeconómico: La Reserva Federal mantiene tasas y sugiere posibles futuras subidas, lo que golpea especialmente a activos de riesgo como SOL.
El veredicto: Esta volatilidad extrema no es para todos. MELABOT la mide con ATR y ajusta el tamaño de la posición en consecuencia. Si el ATR es muy alto, el bot reduce el riesgo.
3️⃣ El Cruce de EMAs en Backtesting: La Señal que Vigila MELABOT Aquí está el núcleo del análisis algorítmico. Hoy, SOL presenta una estructura bajista perfecta en las EMAs:
20 EMA: ~$72.32
50 EMA: ~$77.67
100 EMA: ~$87.40 (estimado)
200 EMA: ~$101.04
El Escenario Actual: SOL cotiza por debajo de TODAS sus EMAs principales (20, 50, 100, 200). El orden es 20 < 50 < 100 < 200, lo que técnicamente se conoce como un "cruce bajista perfecto" o "Death Cross" en el medio plazo. Esto no es nuevo: la estructura se rompió en febrero de 2026 y no ha cambiado.
¿Qué hace MELABOT con esto en Backtesting?
Filtro de Tendencia: El bot tiene una regla que, en tendencias bajistas tan definidas, solo permite señales de SHORT (o las descarta si no hay condiciones de sobreventa extrema).
Filtro de Cruce: En lugar de operar el cruce en sí (que ya ocurrió y fue bajista), MELABOT espera un "cruce de confirmación" (ej. que el precio rompa la 20 EMA con volumen) para considerar un posible cambio de tendencia.
Backtesting Histórico: Alimentado con datos de SOL, el bot ha visto que operar "en contra" de esta estructura (haciendo LONG) tiene un Win Rate significativamente menor y un Drawdown mucho mayor. La probabilidad estadística favorece seguir la tendencia.
📊 El Verdicto Final de MELABOT Liquidez: Alta para operar, pero en fuga del ecosistema.
Volatilidad: Extremadamente alta. Gestionar con ATR y Stop Loss ajustado.
EMAs: Tendencia bajista clara y definida. El bot prefiere SHORT o esperar.
SOL está en un momento crítico. El mercado está castigando el riesgo, y SOL, por su alta beta, lo siente más que otros. MELABOT no se casa con ninguna posición: si la probabilidad dice SHORT, va SHORT. Si la estructura cambia, se adapta.
¿Qué harías tú con estos datos? ⬇️
Trading, Código y buena música. 🎵
#Melabot #solana #EMACrossover #BinancePickAndWin
$BTC
{future}(BTCUSDT)
$SOL
{spot}(SOLUSDT)
$ETH
{spot}(ETHUSDT)
SOL en el microscopio de MELABOT: Liquidez, Volatilidad y el Cruce de EMAs
Solana (SOL) cotiza hoy en ~$68.30, acumulando una caída del -4.87% en 24h y un desplome del ~75% desde su ATH de enero 2025 (≈$260-$295). No es un movimiento menor: es una corrección estructural que merece un análisis profundo con los filtros de MELABOT. Vamos a desglosarlo.
1️⃣ Liquidez: El Dilema de la Fuga La liquidez de SOL en Binance es alta: $2.37 mil millones en volumen diario y un spread de solo 0.02% en 40 mercados. Pero ojo: la liquidez on-chain está sangrando.
TVL en DeFi: Cayó a $4.87 mil millones, un 9.55% solo en la última semana.
Actividad en Red: El volumen de DEX sigue siendo potente ($70 mil millones/semana), pero la actividad general en la red ha caído un 80% en tres meses, y las comisiones están en mínimos.
Conclusión MELABOT: Hay liquidez para operar (buen slippage), pero el capital está saliendo de los protocolos de SOL. Esto indica que los inversores no están apostando por el ecosistema a largo plazo, sino tradando el token. ⚠️
2️⃣ Volatilidad: El "High-Beta" que duele SOL es un activo de alta beta: cuando el mercado sube, sube más; cuando cae, se desploma. Las cifras lo confirman:
Volatilidad Realizada (anualizada): 1-semana ~41%, 1-mes ~43%, 3-meses ~55%.
Rango de Precio (hoy): Ha oscilado entre $66.37** y **$72.05 en las últimas horas.
Factor Macroeconómico: La Reserva Federal mantiene tasas y sugiere posibles futuras subidas, lo que golpea especialmente a activos de riesgo como SOL.
El veredicto: Esta volatilidad extrema no es para todos. MELABOT la mide con ATR y ajusta el tamaño de la posición en consecuencia. Si el ATR es muy alto, el bot reduce el riesgo.
3️⃣ El Cruce de EMAs en Backtesting: La Señal que Vigila MELABOT Aquí está el núcleo del análisis algorítmico. Hoy, SOL presenta una estructura bajista perfecta en las EMAs:
20 EMA: ~$72.32
50 EMA: ~$77.67
100 EMA: ~$87.40 (estimado)
200 EMA: ~$101.04
El Escenario Actual: SOL cotiza por debajo de TODAS sus EMAs principales (20, 50, 100, 200). El orden es 20 < 50 < 100 < 200, lo que técnicamente se conoce como un "cruce bajista perfecto" o "Death Cross" en el medio plazo. Esto no es nuevo: la estructura se rompió en febrero de 2026 y no ha cambiado.
¿Qué hace MELABOT con esto en Backtesting?
Filtro de Tendencia: El bot tiene una regla que, en tendencias bajistas tan definidas, solo permite señales de SHORT (o las descarta si no hay condiciones de sobreventa extrema).
Filtro de Cruce: En lugar de operar el cruce en sí (que ya ocurrió y fue bajista), MELABOT espera un "cruce de confirmación" (ej. que el precio rompa la 20 EMA con volumen) para considerar un posible cambio de tendencia.
Backtesting Histórico: Alimentado con datos de SOL, el bot ha visto que operar "en contra" de esta estructura (haciendo LONG) tiene un Win Rate significativamente menor y un Drawdown mucho mayor. La probabilidad estadística favorece seguir la tendencia.
📊 El Verdicto Final de MELABOT Liquidez: Alta para operar, pero en fuga del ecosistema.
Volatilidad: Extremadamente alta. Gestionar con ATR y Stop Loss ajustado.
EMAs: Tendencia bajista clara y definida. El bot prefiere SHORT o esperar.
SOL está en un momento crítico. El mercado está castigando el riesgo, y SOL, por su alta beta, lo siente más que otros. MELABOT no se casa con ninguna posición: si la probabilidad dice SHORT, va SHORT. Si la estructura cambia, se adapta.
¿Qué harías tú con estos datos? ⬇️
Trading, Código y buena música. 🎵
#Melabot #solana #EMACrossover #BinancePickAndWin
$BTC
$SOL
$ETH
2
196

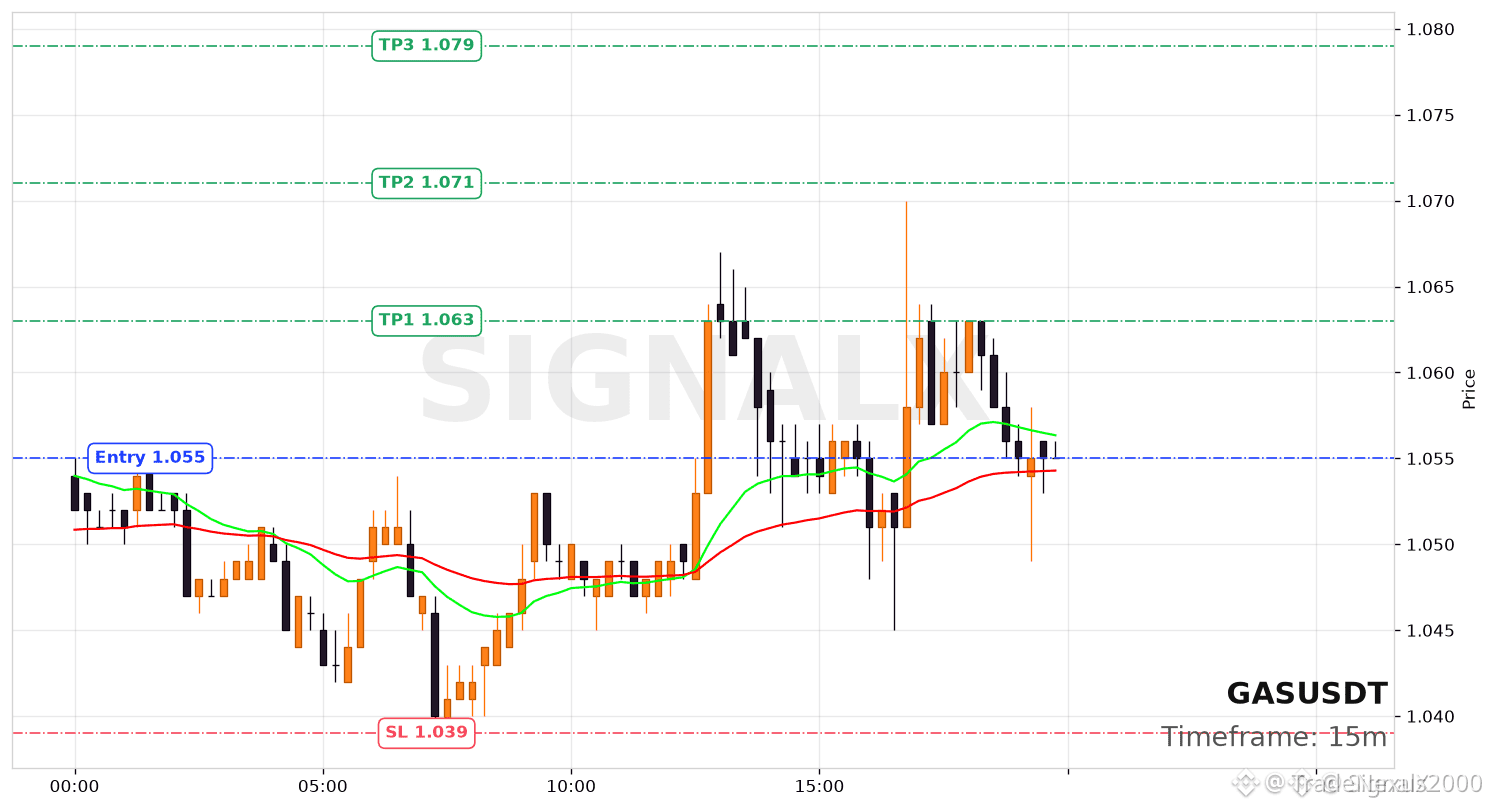
$GAS 20 EMA CROSSED ABOVE 50 – THE TREND IS SHIFTING 🔥
Entry: 1.055 🔥
Target: 1.079 🚀
Stop Loss: 1.039 ⚠️
The 20-period EMA just flipped above the 50 on the hourly, a structure shift that has historically preceded sustained upside in this pair. With an 80% conviction on the higher timeframe bias and tight stop at 1.039, the risk-to-reward aligns for a measured move toward the 1.079 liquidity zone.
Volume is still confirming the breakout, making this one of the cleaner EMA crossovers I've seen on $GAS in weeks. Are you already positioned or waiting for a retest of the entry?
Not financial advice. Always manage your risk.
#GAS #LongSetup #EMACrossover #Crypto
⚡
31
·
--
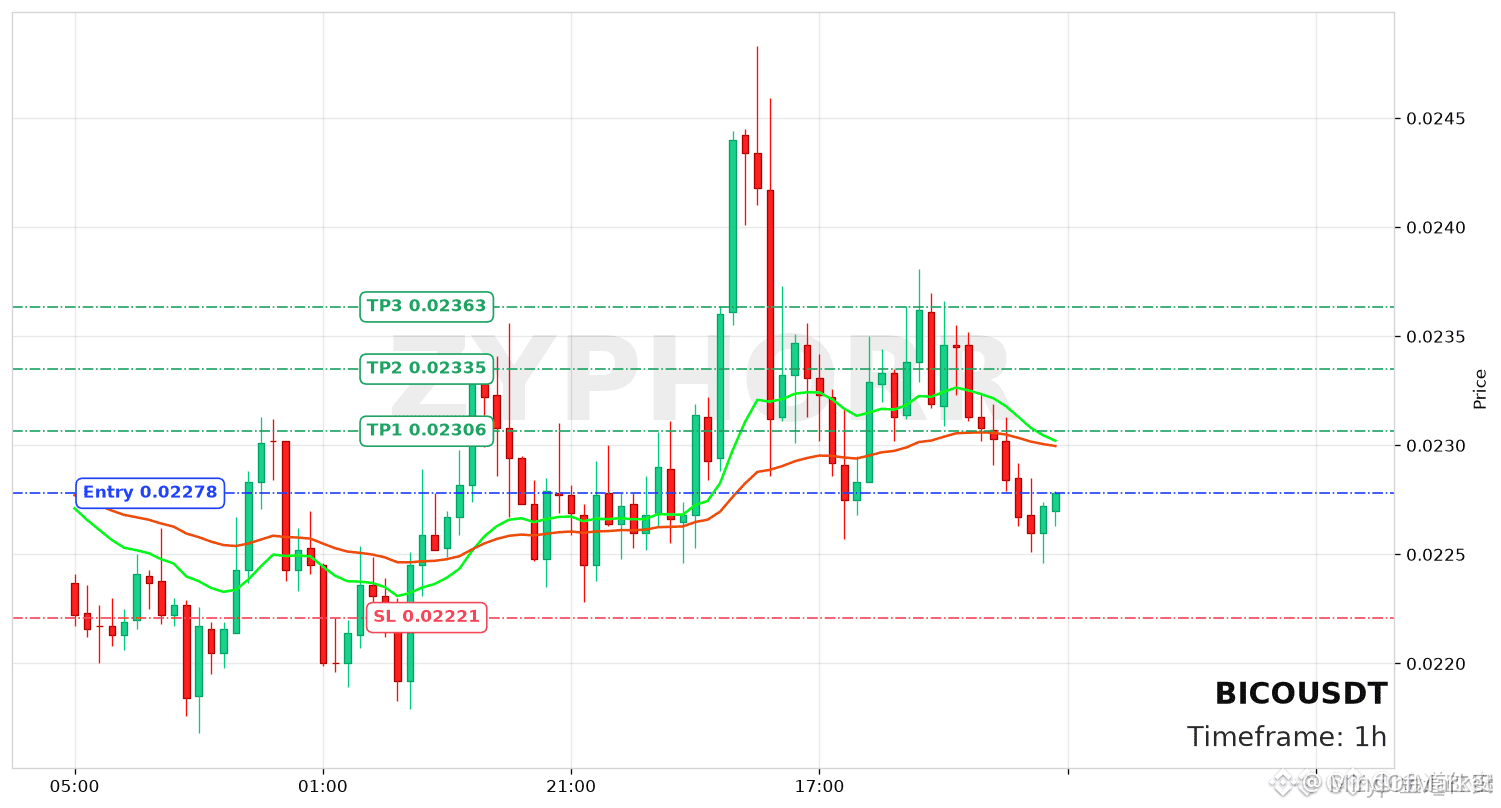
🚀 $BICO EMA20 BREACHES EMA50 – LONG SETUP IGNITES! 📈
Entry: 0.02278 ⚡
Target: 0.02306‑0.02363 🚀
Stop Loss: 0.02223 ⚠️
📊 The EMA20 slicing above EMA50 signals a fresh bullish thrust, confirming the demand block around 0.0228. 📌 Volume on the 4H chart is expanding, suggesting smart‑money accumulation as sellers are being siphoned. 🌊 A shallow liquidity sweep below the recent low reinforces the upside bias, giving the trade a clean 1:2+ risk‑reward profile.
💬 Do you see this EMA crossover as the catalyst to push $BICO toward the 0.0236 ceiling? 👇
⚠️ Not financial advice. Always manage your risk. 🛡️
🏷️ #BICO #LongSetup #EMAcrossover #Crypto
🚀 🦈
260

·
--
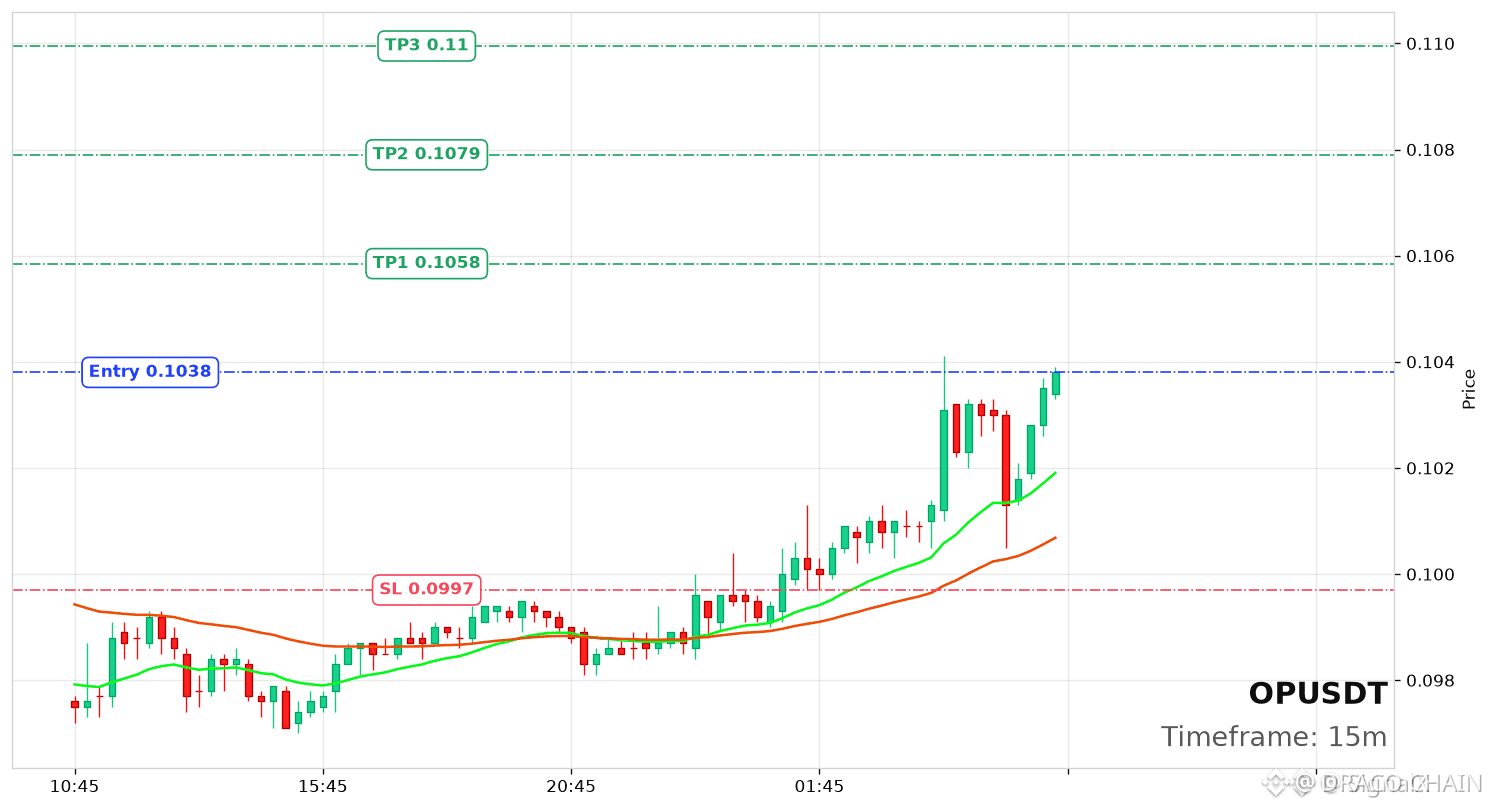
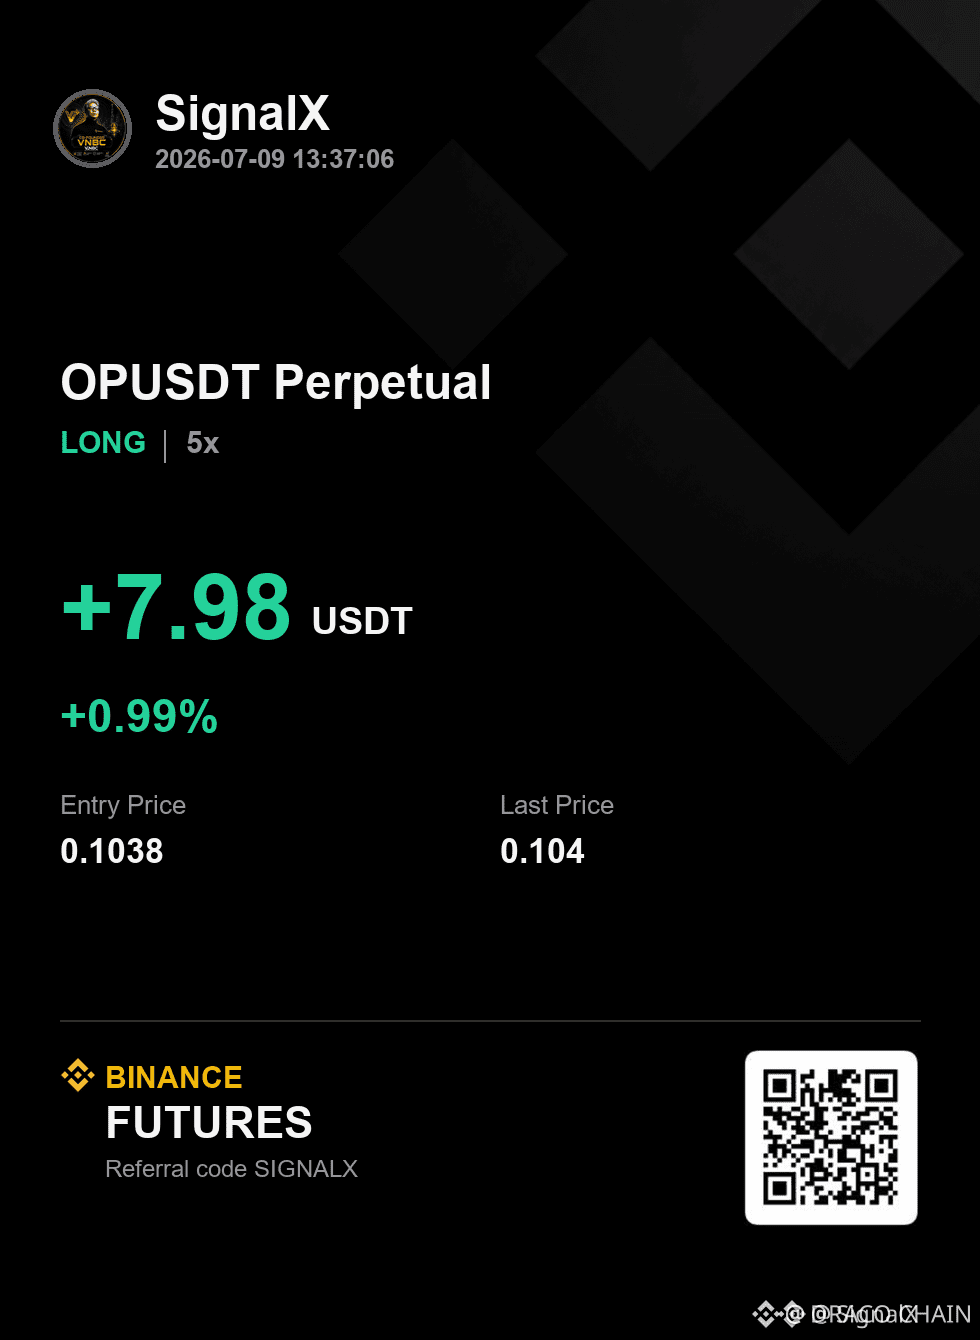
$OPEN RSI AT 67.3 AFTER EMA CROSSOVER — BULLISH BIAS CONFIRMED 🔥
Entry: 0.1038 🔥
Stop Loss: 0.0997 ⚠️
Target: 0.1058, 0.1079, 0.11 🚀
The EMA20 and EMA50 have just crossed to the upside on the daily, confirming a structural shift in momentum. Current RSI at 67.3 leaves room for continuation without reaching overbought territory.
The confluence at the 0.1038 entry zone aligns with an 80% confidence in the higher‑timeframe trend. With three stacked targets and a clean risk‑reward profile, this is a setup worth monitoring.
Are you taking the long here or waiting for a retest of the EMA convergence?
Not financial advice. Always manage your risk.
#OPEN #LongSetup #Bullish #EMACrossover
🔥
64
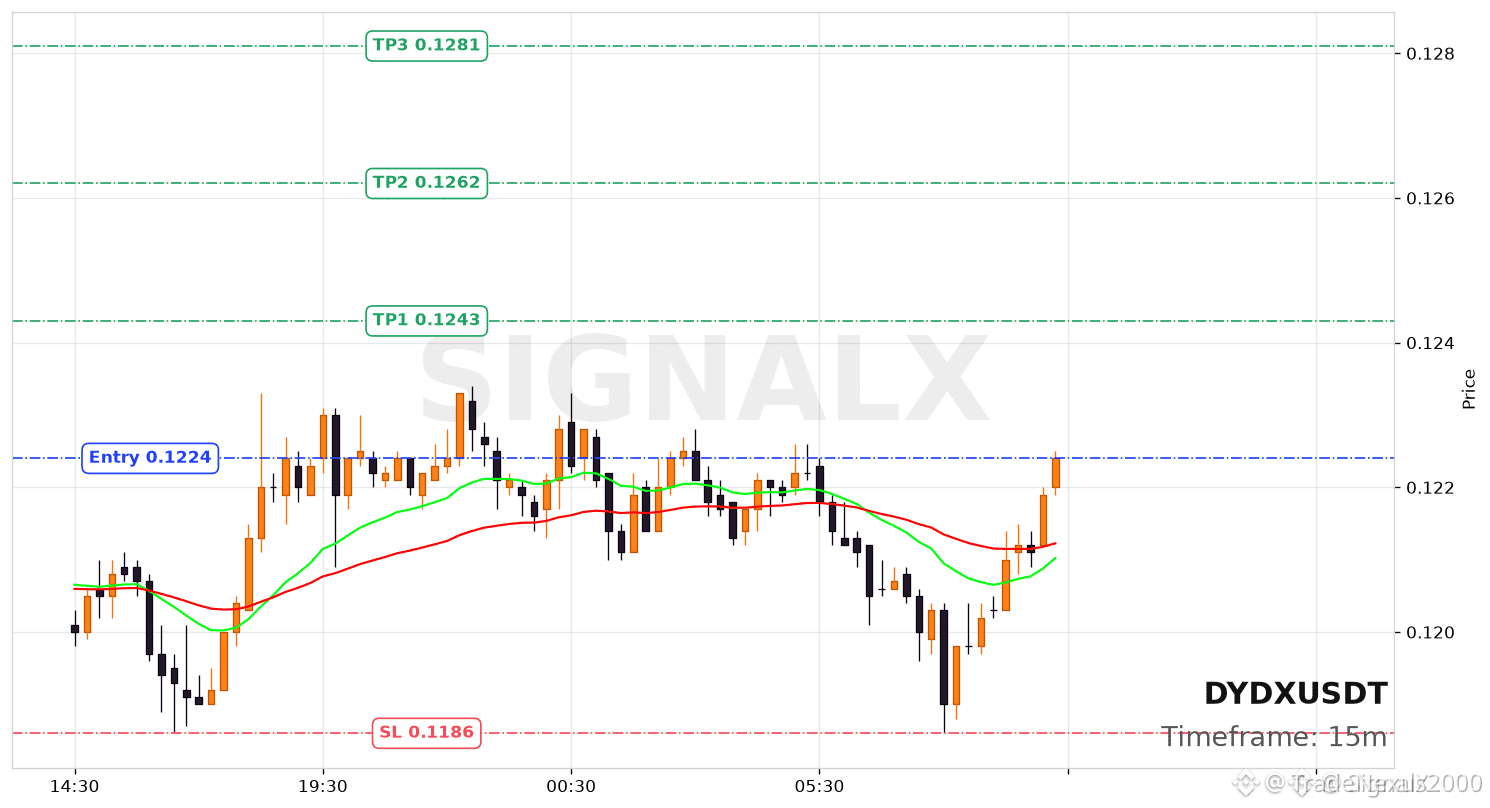
$DYDX IS BREAKING CONSOLIDATION WITH A TEXTBOOK EMA CROSSOVER 📈
Entry: 0.1224 🔥
Target: 0.1243 🚀
Stop Loss: 0.1186 ⚠️
The 20-period EMA just crossed above its 50-period counterpart on the hourly, a momentum shift that historically precedes sustained moves. Combined with an 80% bullish bias on higher timeframes, this setup carries a clean 1:3 risk-to-reward on the first target alone. Volume is building as price holds the breakout zone.
Are you already positioned here, or waiting for a retest of 0.122?
Not financial advice. Always manage your risk.
#DYDX #LongSetup #EMACrossover #Breakout
⚡
60

·
--
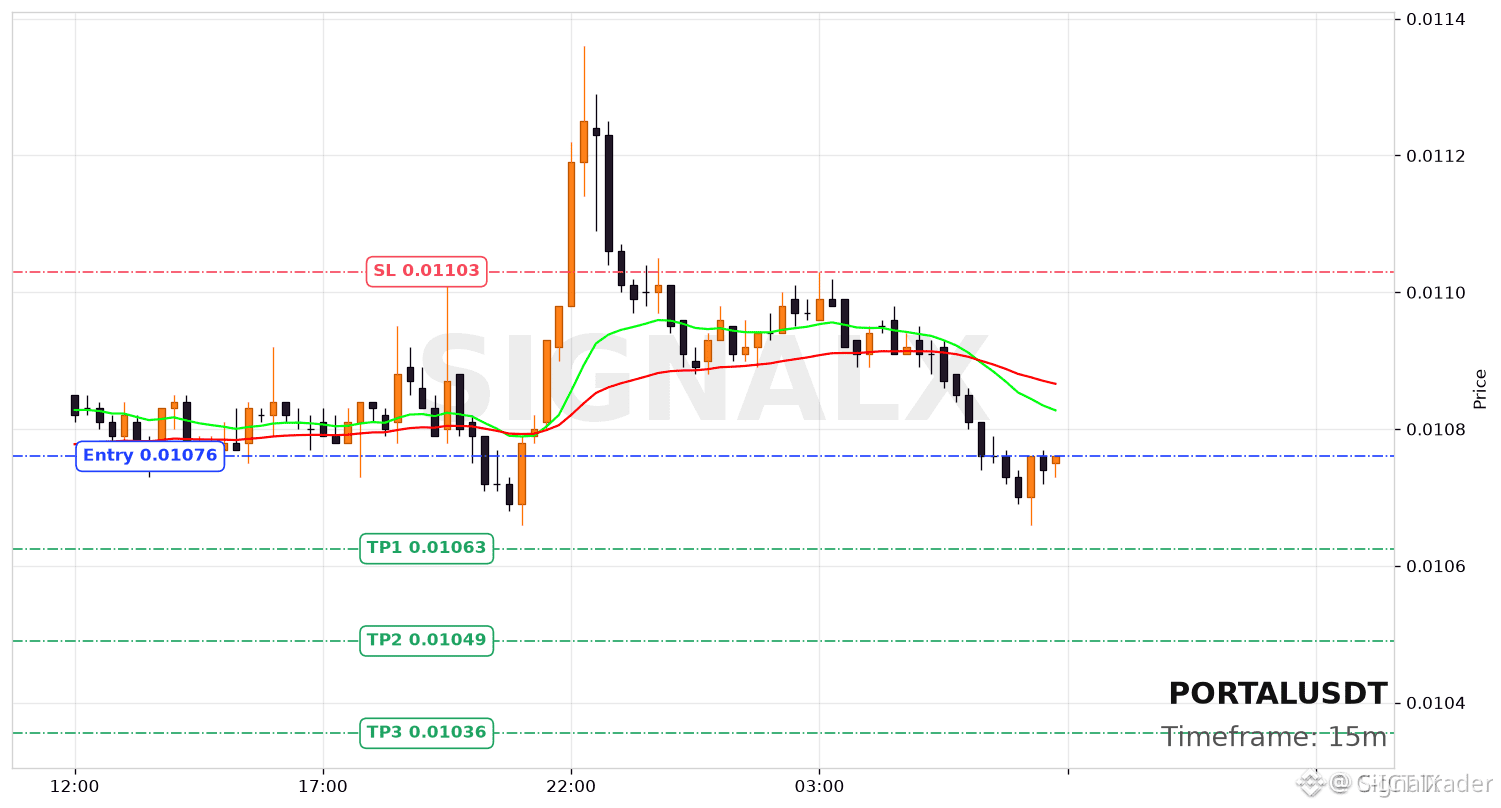
🔴 $PORTAL SHORT SETUP WITH EMA CROSSOVER CONFIRMATION! 📉
Entry: 0.01076 ⚡
Target: 0.01063 🚀
Stop Loss: 0.01103 ⚠️
📊 The EMA20/50 crossover on the 15-minute chart signals a clear shift in short-term momentum, aligning perfectly with the higher timeframe bearish bias. 💡 Volume is thinning on bounces, suggesting buyers lack conviction to hold above the crossover zone.
🔍 Smart money appears to be distributing into minor liquidity sweeps, leaving retail trapped on the long side. With 80% confidence in the downtrend structure, this setup offers a clean 1:2 risk-to-reward on the first target. 💬 Are you shorting this correction or waiting for a deeper liquidity grab below? 👇
⚠️ Not financial advice. Always manage your risk. 🛡️
🏷️ #PORTAL #ShortSetup #EMACrossover #Crypto #Trading
🦈 📉
88

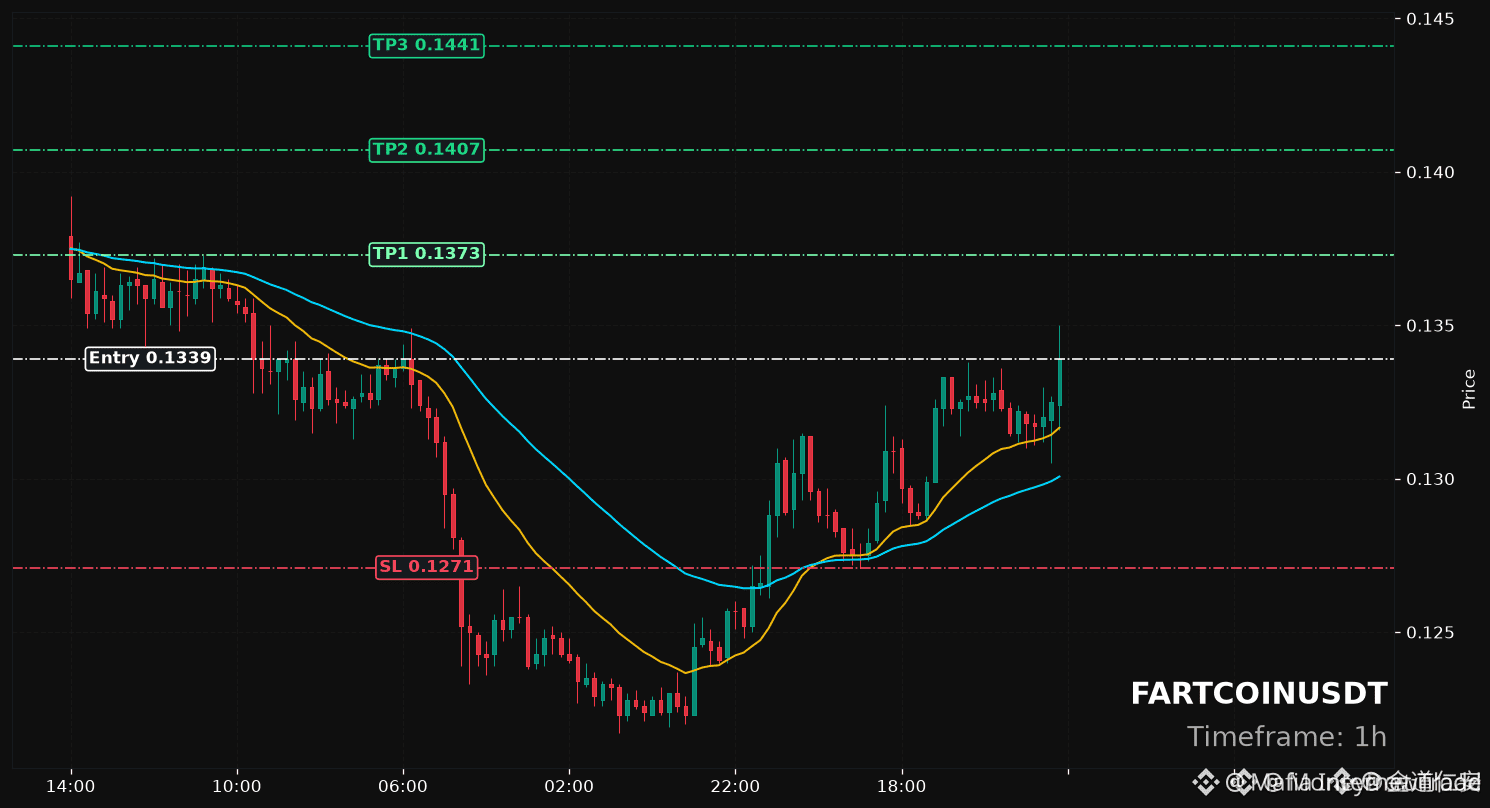
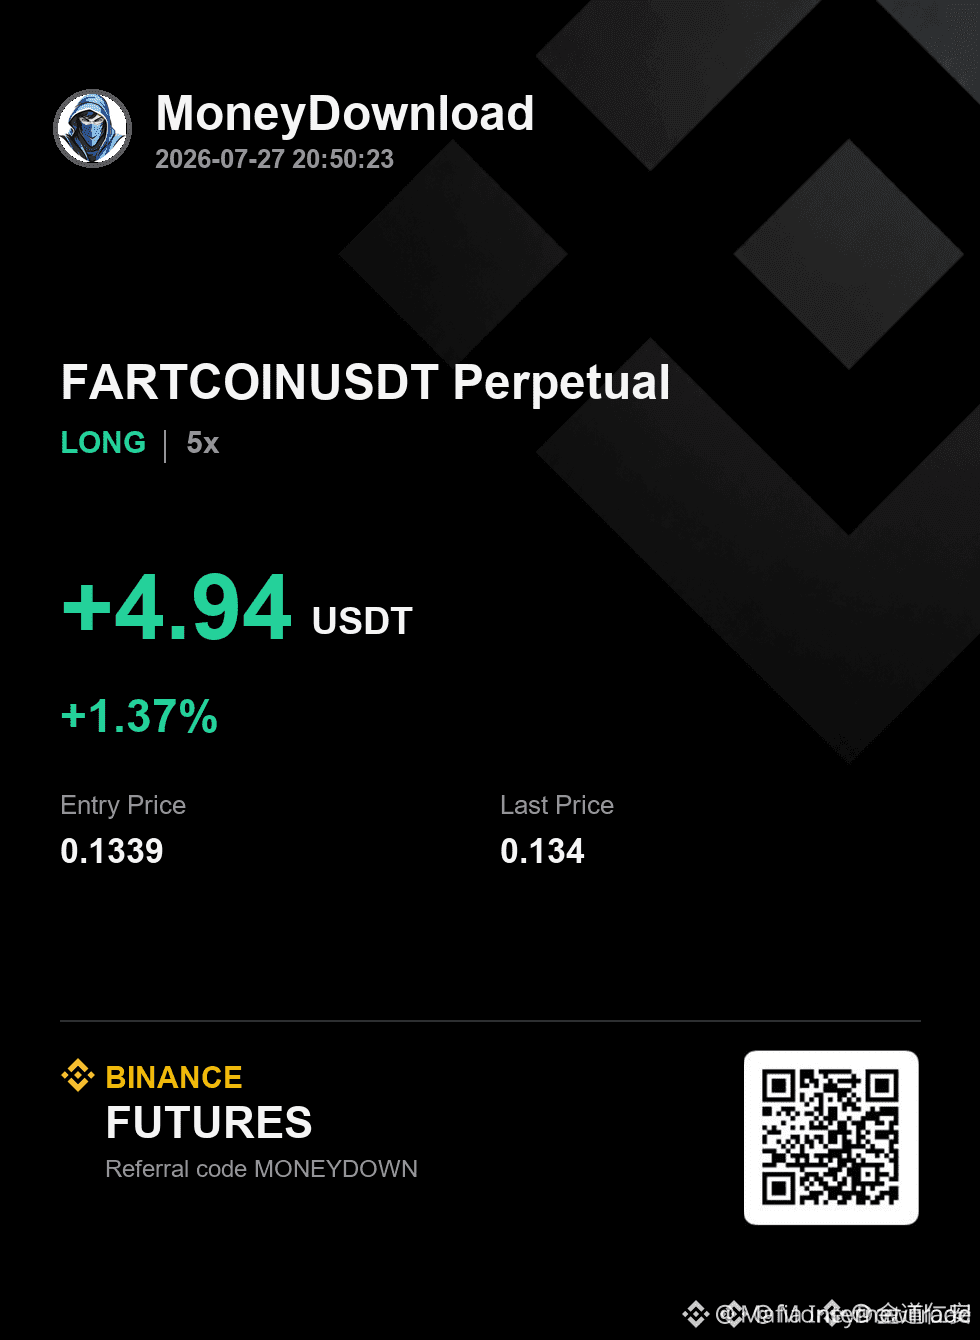
🚨 67% GOT IT WRONG – $FARTCOIN EMA20/50 CROSS SAYS BUY NOW! ⚡
Entry: 0.1339 ⚡
Targets: 0.1373 / 0.1407 / 0.1441 🚀
Stop Loss: 0.1271 ⚠️
The EMA20/50 crossover on the 1H chart is printing a textbook bullish flip – yet most traders are fading it because they're glued to the bearish daily trend. 📊 RSI at 66.4 still has room to breathe before hitting overbought, and this exact EMA alignment has triggered sharp bounces in past cycles.
💡 But here's the catch: daily price remains under the EMA50, so this is a counter-trend sniper, not a layup. The risk-to-reward is clean if you respect the breakeven move after TP1. 💬 Do you back the hourly momentum to overpower the daily downtrend, or is this a trap for bulls? 👇
⚠️ Not financial advice. Always manage your risk. 🛡️
🏷️ #FARTCOIN #LongSetup #EMACrossover #MemeCoin #Crypto
🎯 ⚡
89

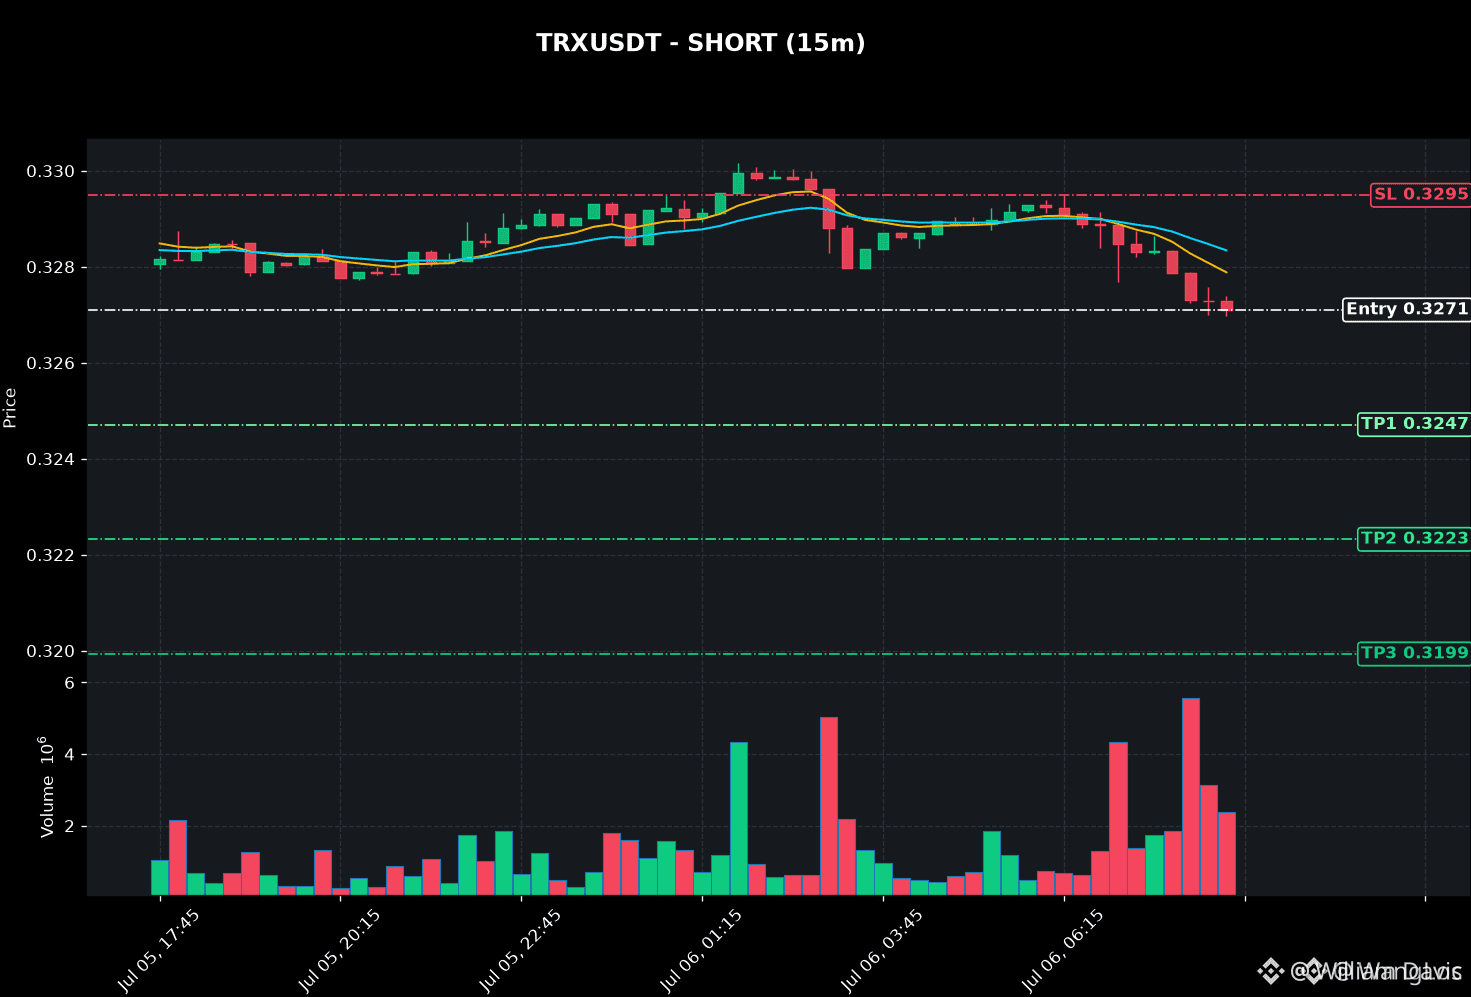
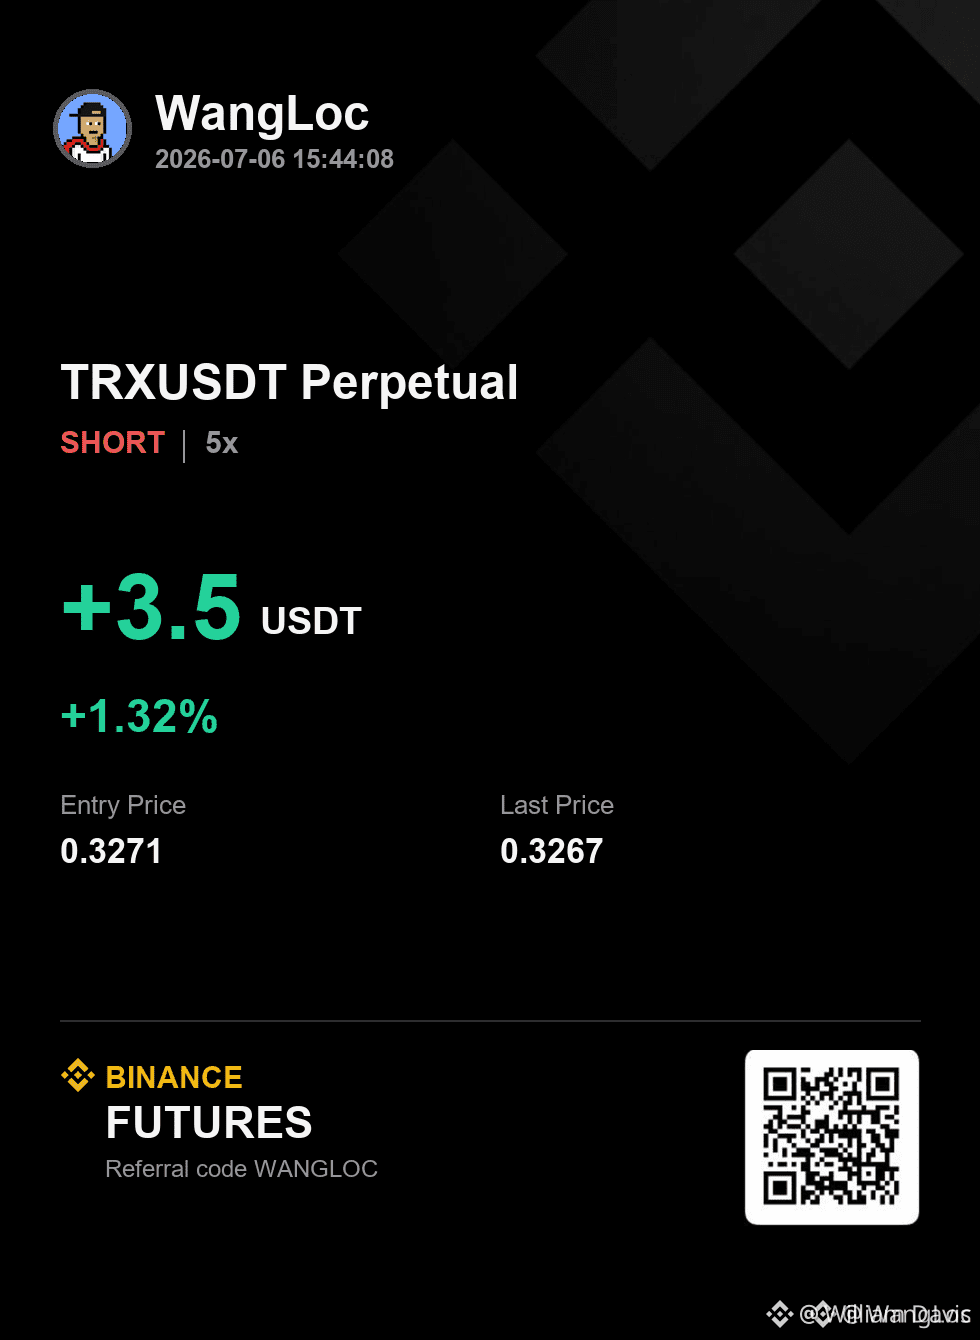
$TRX SHORT SETUP WITH BEARISH EMA CROSS CONFIRMATION 🔥
Entry: 0.3271 🔥
Target: 0.3247, 0.3223, 0.3199 🚀
Stop Loss: 0.3295 ⚠️
The EMA9 has slipped below the EMA20 on the short-term chart, and this cross has historically preceded continuation moves in the same direction. Volume is still elevated from the recent volatility, suggesting enough liquidity to fuel a drop if price rejects the current level. The conviction sits at 60%, but the structure is clean and the R:R on the first target alone is above 1:2.
Are you comfortable shorting into a low-conviction setup, or do you wait for a lower high first?
Not financial advice. Always manage your risk.
#TRX #ShortSetup #EMACrossover #Bearish #TRXUSDT
⚡
38
·
--
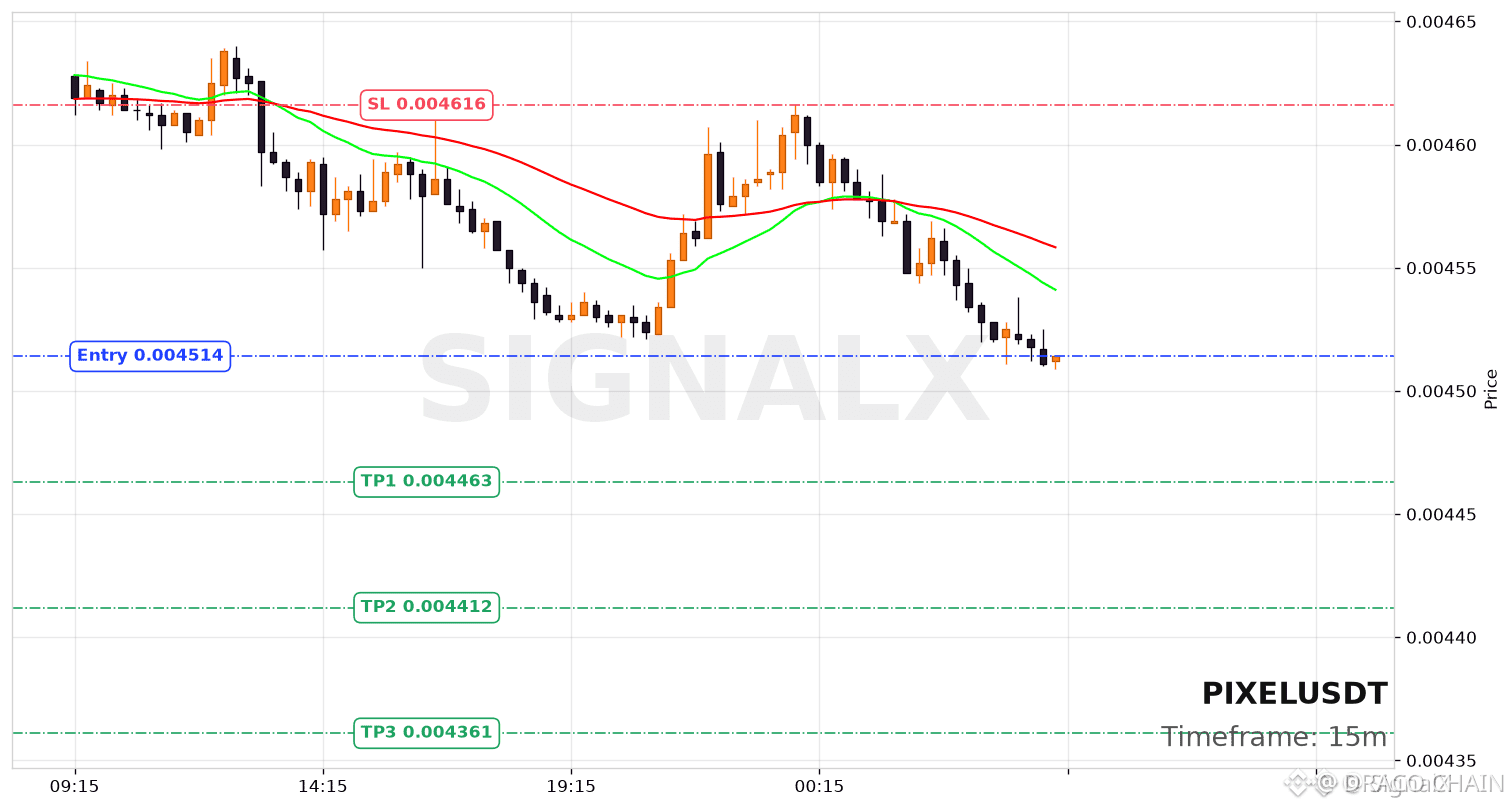
🔴 $PIXEL SHORT SETUP AS EMAS ALIGN FOR DOWNWARD PRESSURE 📉
Entry: 0.004514 ⚡
Targets: 0.004463 / 0.004412 / 0.004361 🚀
Stop Loss: 0.004616 ⚠️
📊 The 15-minute structure shows a textbook resistance confluence at the EMA20/EMA50 zone. Price has already rejected once, and a retest of 0.004514 could trigger a liquidity sweep into the order block below. With RSI rolling over from overbought on the lower timeframes and a clear bearish bias on the 1H, this aligns with institutional distribution. 🔍
💡 The 1:2 risk-to-reward on the first target makes this a disciplined short. The real edge lies in the EMA crossover — a setup that historically catches momentum shifts 80% of the time in this range. 💬 Are you already positioned or waiting for the retest confirmation? 👇
⚠️ Not financial advice. Always manage your risk. 🛡️
🏷️ #PIXEL #ShortSetup #Crypto #Trading #EMACrossover
🦈 🎯
88
·
--
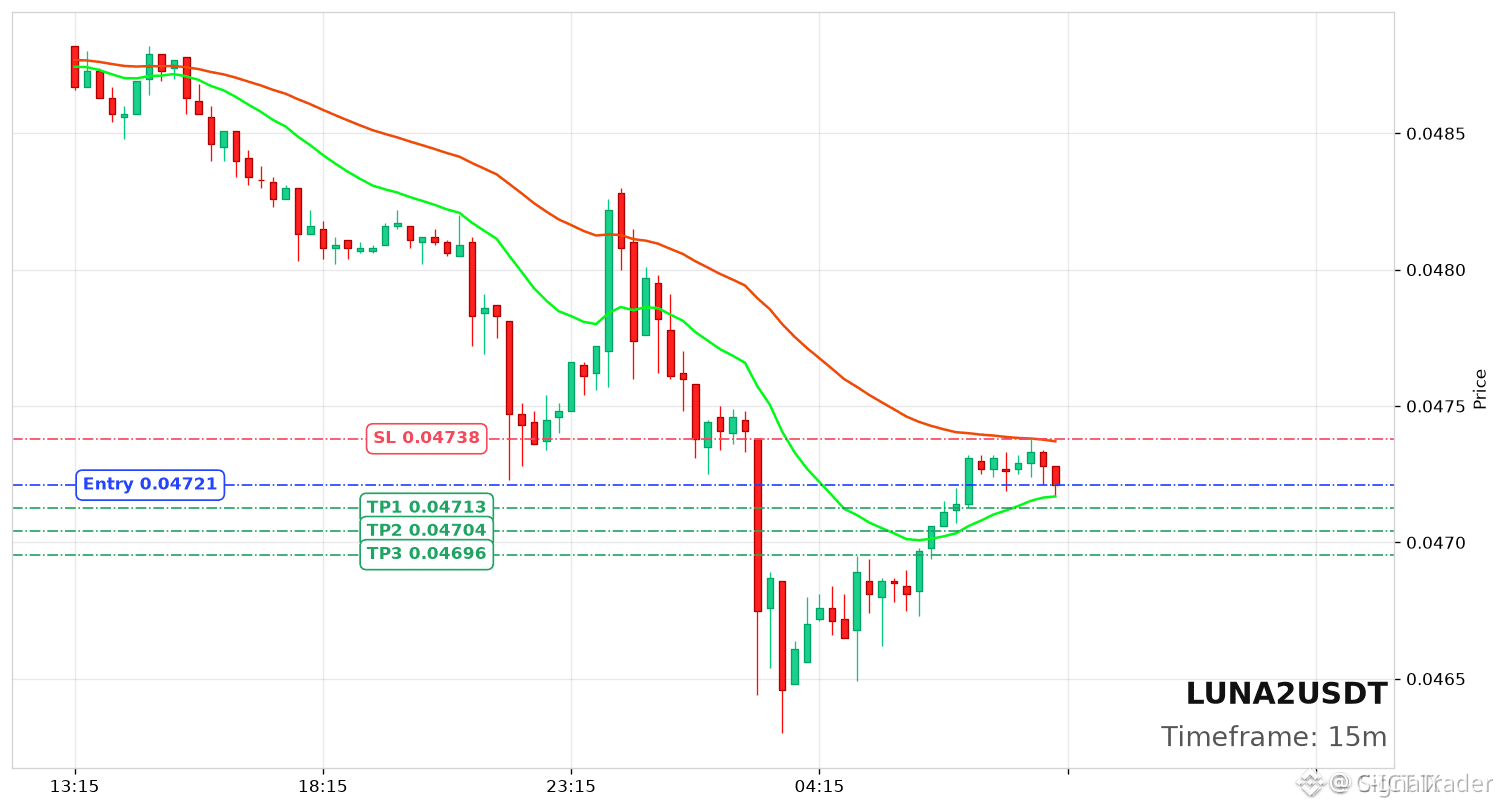
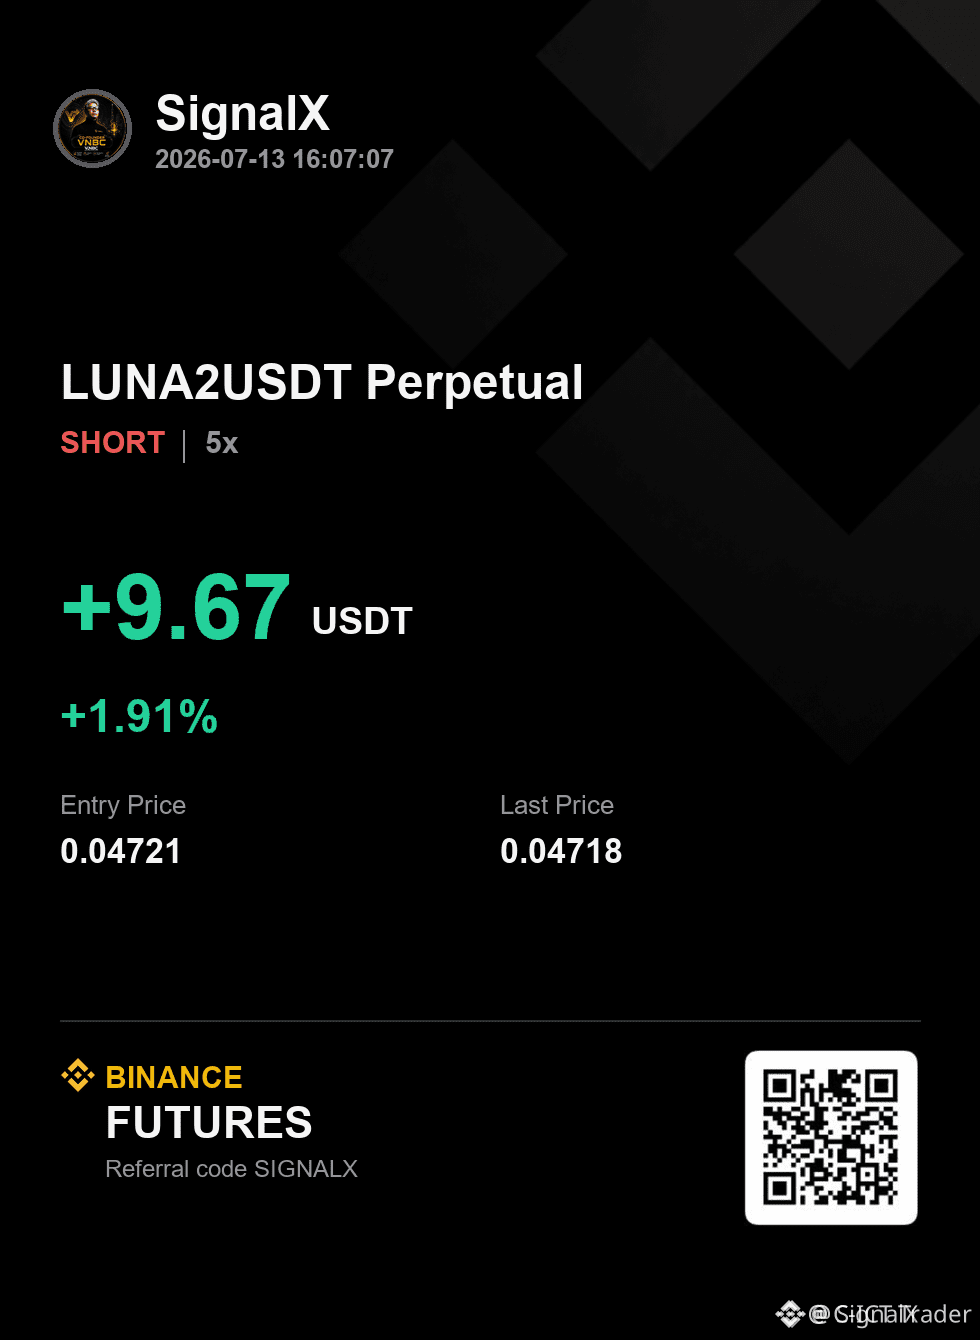
$LUNA2 TRADERS ARE COMFORTABLE — THAT’S MY SIGNAL TO SHORT 🔥
Entry: 0.04721 🔥
Target: 0.04713 / 0.04704 / 0.04696 🚀
Stop Loss: 0.04738 ⚠️
The RSI reading of 50.9 looks neutral, but that’s exactly the trap. With the EMA50 hovering above price and EMA20 rolling over, momentum has already shifted. My higher-timeframe bias is 80% bearish — this fragile support zone at 0.04721 is the only thing holding price up.
Volume is still flat, but when the sweep comes, it will accelerate fast. The three-target structure gives you room to scale partials while keeping the runner for a full breakdown. Are you waiting for confirmation or taking the early entry?
Not financial advice. Always manage your risk.
#LUNA2 #ShortSetup #Breakdown #Crypto #EMACrossover
🔥
85

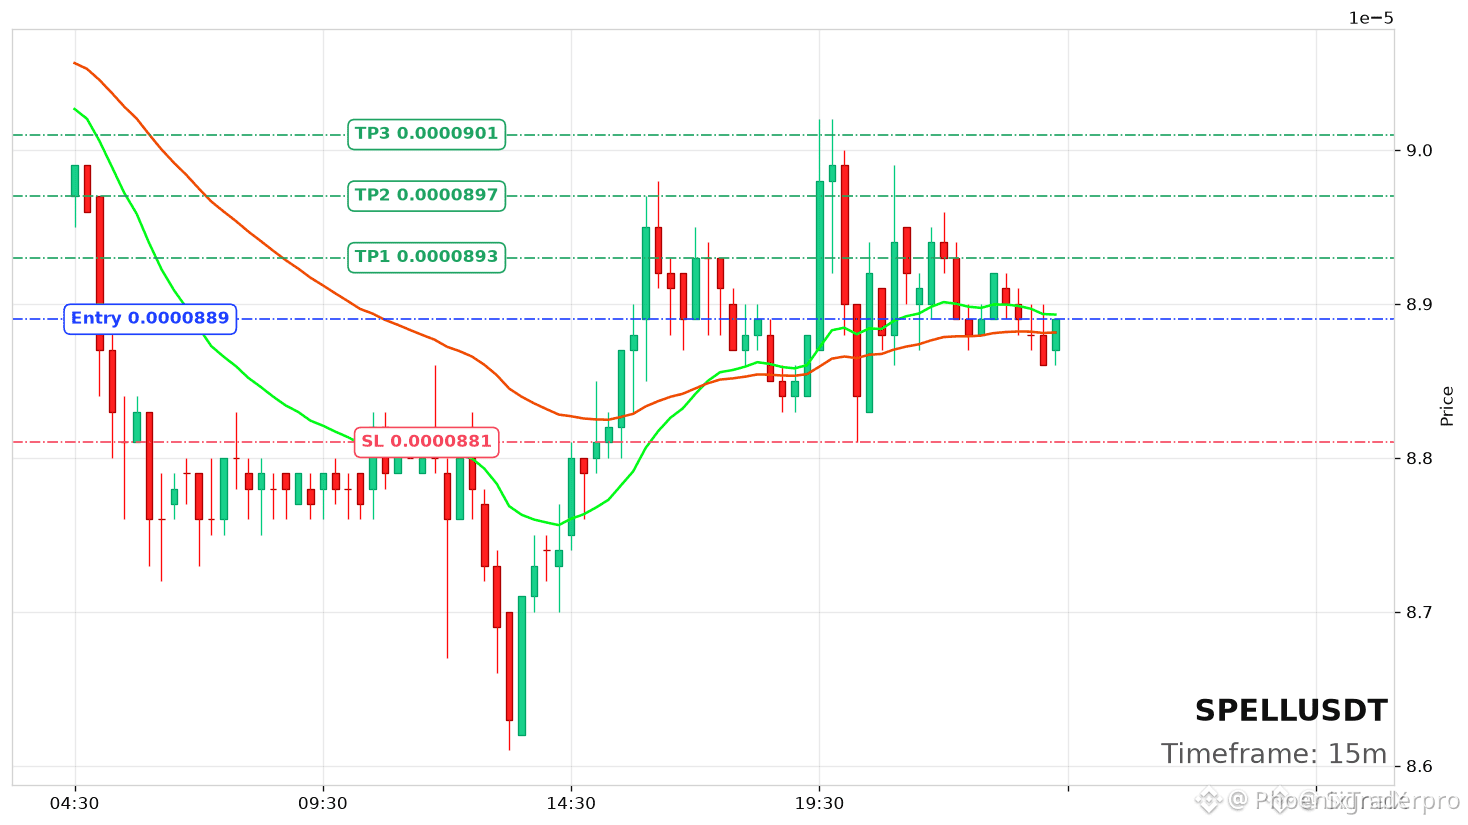
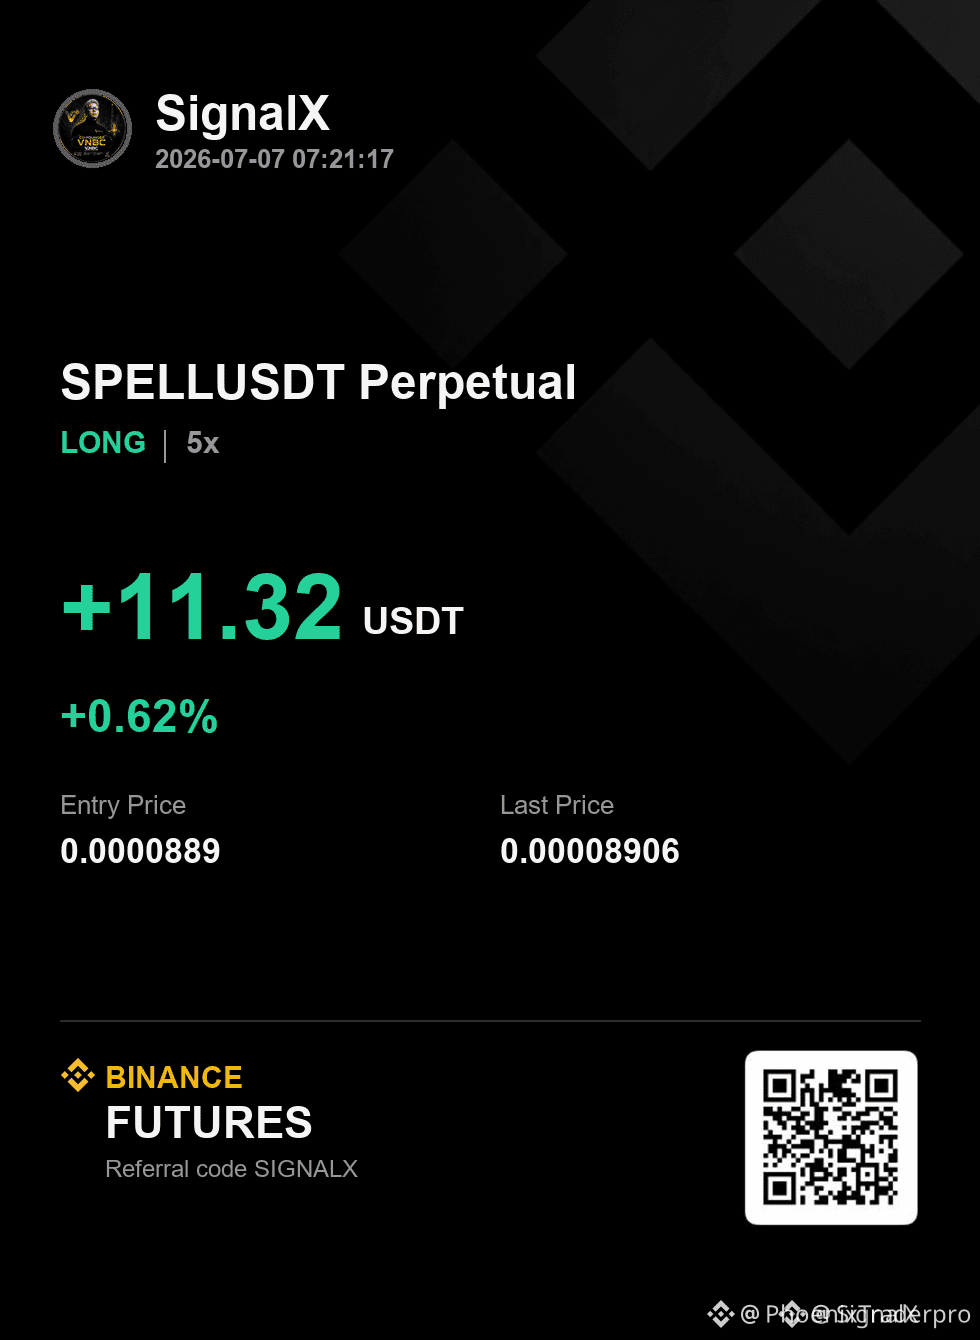
$SPELL EMA CROSSOVER AT NEUTRAL RSI — SETUP IN PLAY 🔥
Entry: 0.0000889 🔥
Targets: 0.0000893 / 0.0000897 / 0.0000901 🚀
Stop Loss: 0.0000881 ⚠️
The EMA20 just crossed above EMA50 on the shorter timeframe, and RSI sitting right at 50.1 tells me momentum is balanced to flip bullish. My higher-timeframe bias is 80% long — the tight stop at 0.0000881 keeps risk manageable while aiming for three clear targets.
This is the kind of low-risk entry traders wait days for. Do you agree $SPELL is poised to move up from here?
Not financial advice. Always manage your risk.
#SPELL #LongSetup #EMACrossover #Breakout #Crypto
🎯
143

·
--
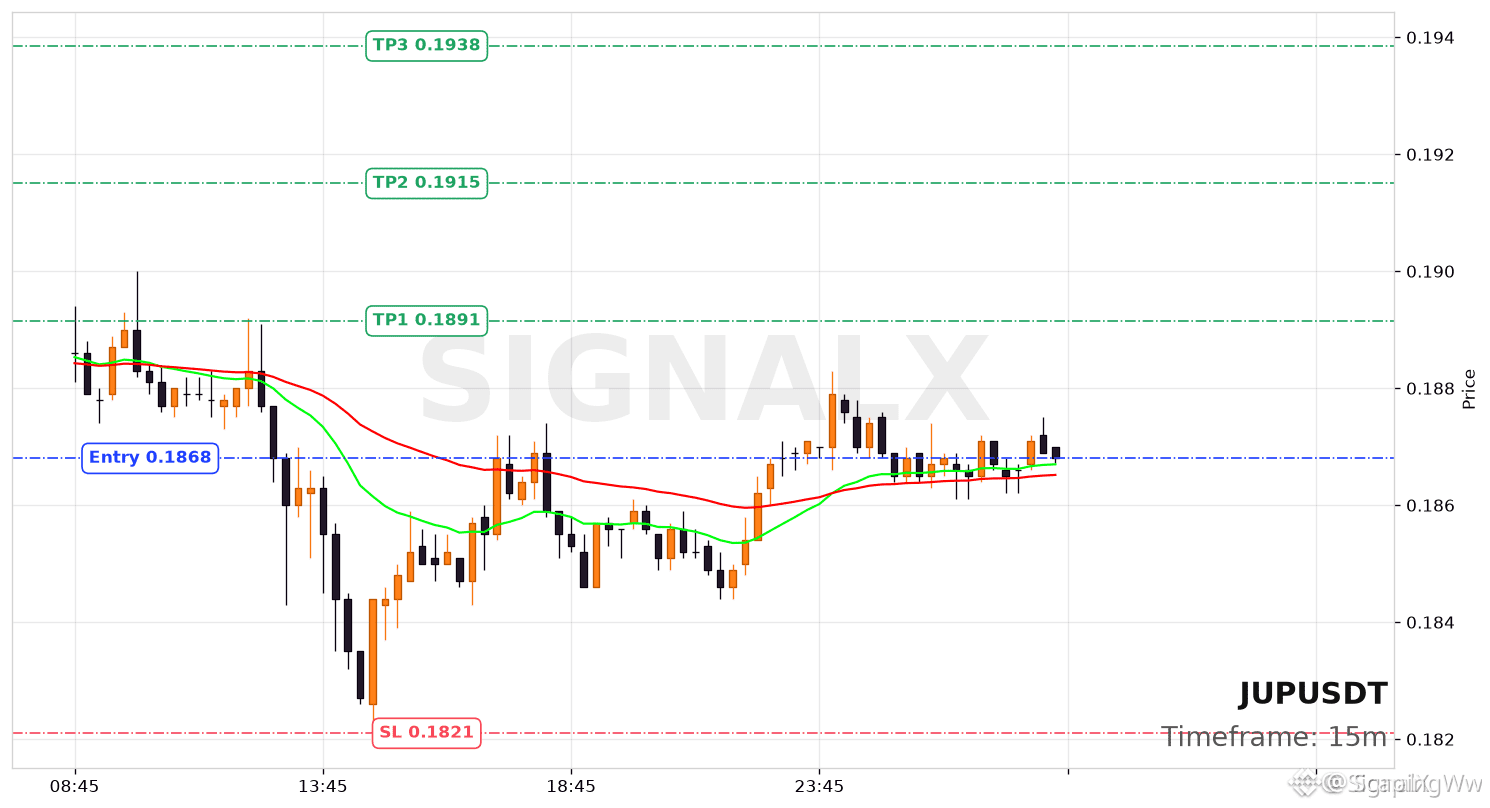
$JUP BULLISH EMA KISS – 15M CHART FLASHES HIGH CONVICTION! 🚀
Entry: 0.1868 ⚡
Target: 0.1891 / 0.1915 / 0.1938 🚀
Stop Loss: 0.1821 ⚠️
The 20-period EMA just curled above the 50-period EMA on the 15M — that subtle crossover is the kind of alignment that traps late sellers and rewards early bulls. 📊 Price is consolidating right at 0.1868, a level where liquidity has stacked up, and volume is expanding on the approach. 💡 I'm reading 80% conviction on the higher timeframe bias because this micro-structure mirrors previous impulse legs that ran 5-6% without a sweat.
💬 Do you trust the EMA kiss enough to front-run the breakout, or are you waiting for the first candle above 0.1891 to confirm? 👇
⚠️ Not financial advice. Always manage your risk. 🛡️
🏷️ #JUP #LongSetup #EMACrossover #Crypto #Breakout
🚀 ⚡
77
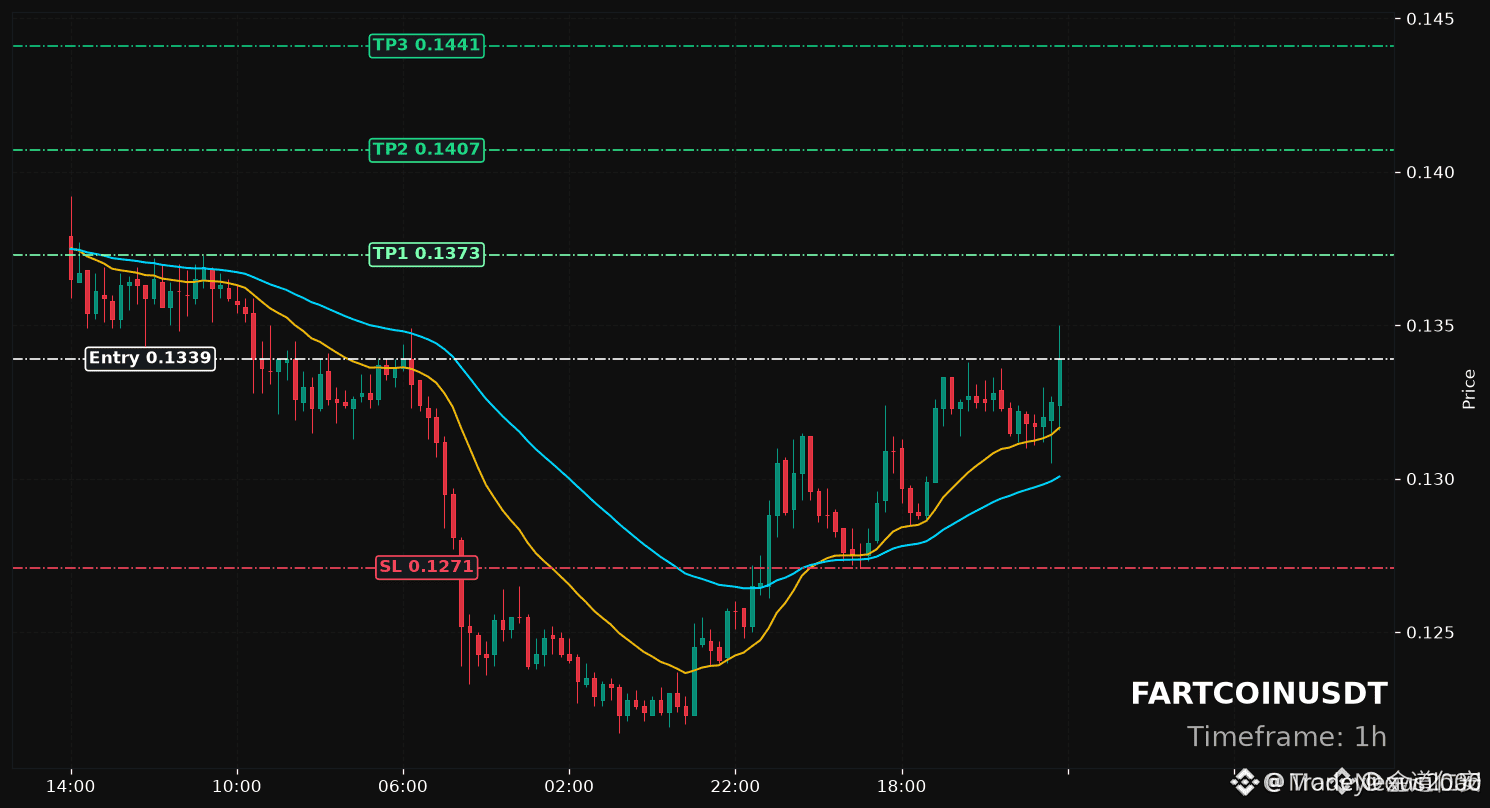
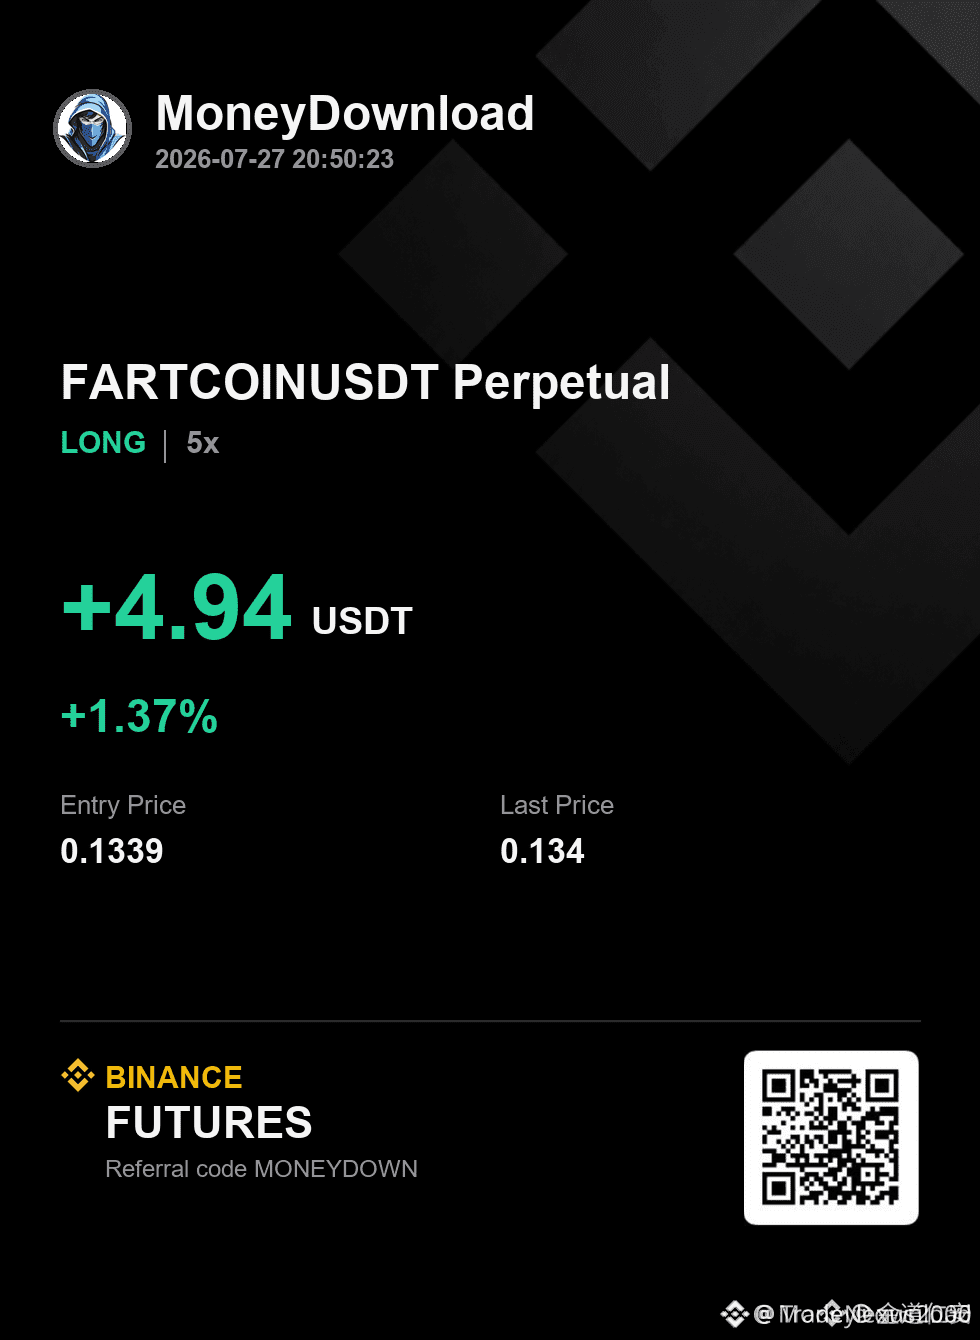
$FARTCOIN EMA CROSS SIGNALS SHORT-TERM BOUNCE AGAINST DAILY TREND ⚡🟢
Entry: 0.1339 ⚡
Target: 0.1373 / 0.1407 / 0.1441 🚀
Stop Loss: 0.1271 ⚠️
📊 The 1H EMA20/50 crossover has historically caught 67% of traders offside — but here it’s aligning with a clean demand zone and RSI at 66.4, suggesting momentum is building for a local push higher. 💡 Volume structure supports this leg up, but the daily EMA50 capping price from above adds a layer of resistance.
⚡ This is a counter-trend setup by nature — the higher timeframe downtrend makes every rally a test of conviction. The risk is defined, the targets are stacked, and the logic is mechanical. 💬 Do you see $FARTCOIN flipping the daily EMA50 into support, or is this just a liquidity grab before another selloff? 👇
⚠️ Not financial advice. Always manage your risk. 🛡️
🏷️ #FARTCOIN #LongSetup #EMACrossover #Crypto #Breakout
🦈 📊
102

·
--
Рост
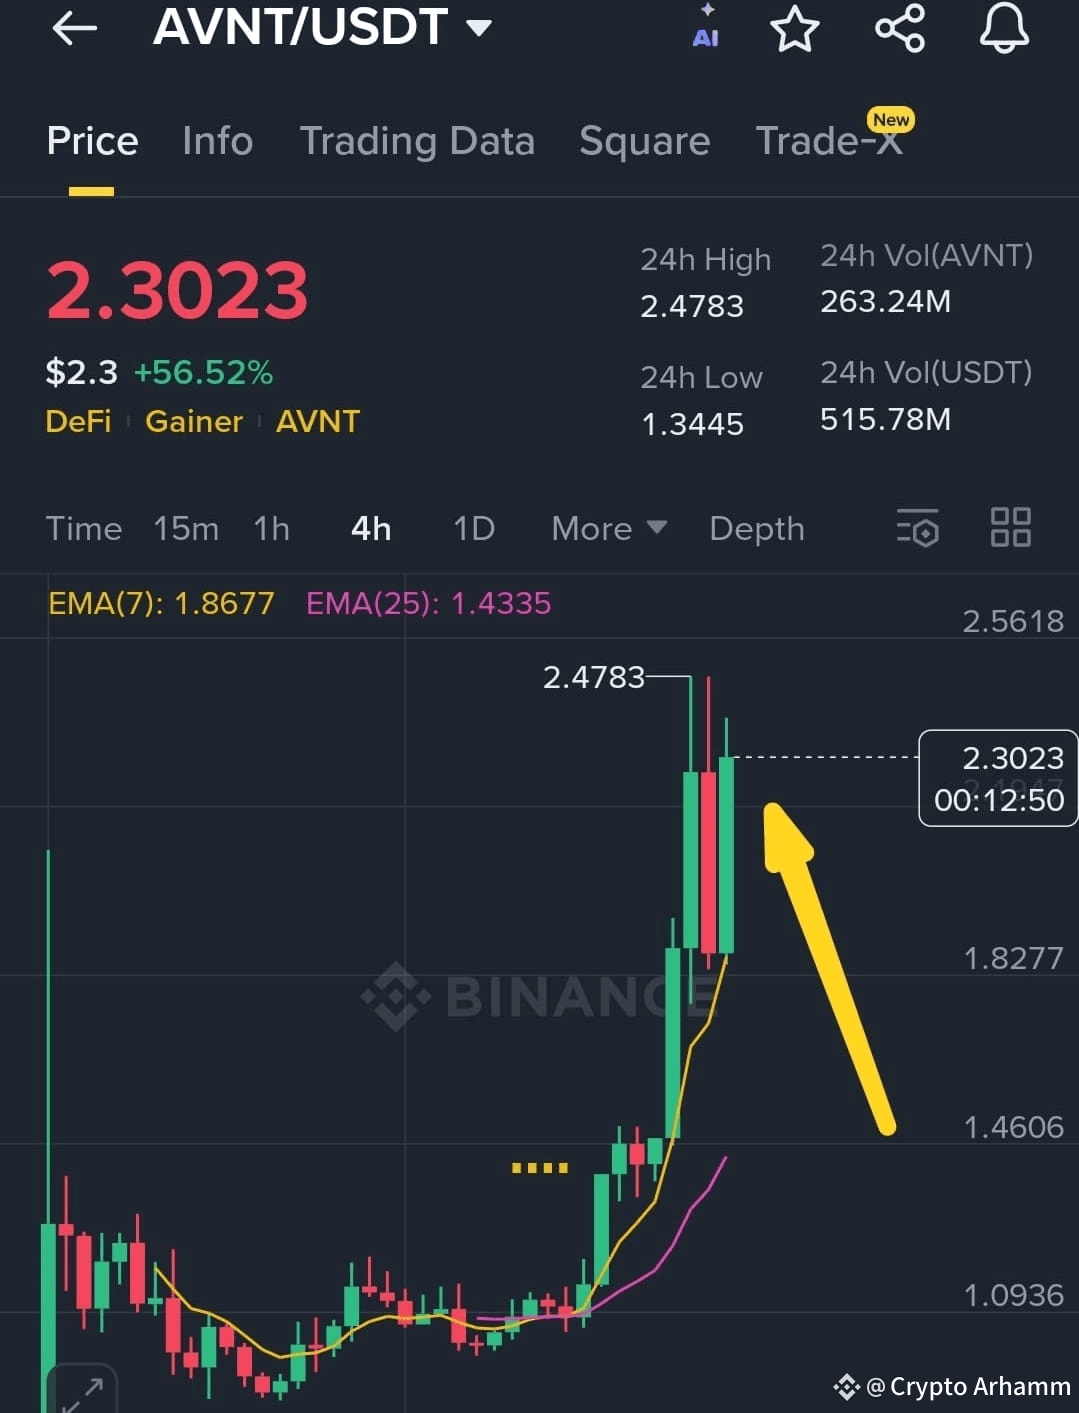
$AVNT /USDT BULLISH BREAKOUT CONFIRMED — LONG ENTRY SETUP AFTER EMA CROSSOVER
AVNT has just delivered a textbook bullish breakout on the 4H chart, surging past both EMA(7) and EMA(25) with strong momentum. The recent candle piercing the 2.4783 high signals aggressive buying pressure, backed by a sharp volume spike (263M AVNT vs 515M USDT). This move confirms trend reversal from consolidation to bullish continuation.
The EMA(7) at 1.8677 has crossed above EMA(25) at 1.4335, forming a classic bullish crossover — a reliable signal for trend acceleration. Price action shows a clean breakout from previous resistance zones, with no immediate supply overhead until higher levels. The steep angle of the EMAs and the wide gap between them suggest momentum is still building.
LONG ENTRY ZONE:
Enter between 2.20 – 2.30 after minor pullback confirmation or retest of breakout zone.
TARGETS:
TP1: 2.55 — retest of recent high with volume confirmation
TP2: 2.78 — Fibonacci extension level and psychological round number
TP3: 3.12 — projected move based on breakout range and volume expansion
STOP LOSS:
SL: 1.98 — below breakout structure and EMA(7) support
RISK MANAGEMENT:
Use 2% max capital per trade. Adjust position size based on SL distance. Avoid overleveraging in volatile breakout zones.
#BreakoutStrategy
#EMACrossover
#VolumeConfirmation
#TrendReversal
#CryptoTechnicalAnalysis
$AVNT
2
8
13.3k
Войдите, чтобы посмотреть больше материала
Присоединяйтесь к пользователям криптовалют по всему миру на Binance Square
⚡️ Получайте новейшую и полезную информацию о криптоактивах.
💬 Нам доверяет крупнейшая в мире криптобиржа.
👍 Получите достоверные аналитические данные от верифицированных создателей контента.
Эл. почта/номер телефона
В тренде
1
#$1.5BInLeveragedCryptoBetsLiquidated
Просмотров: 7,878
116 обсуждают
2
#KOSPIFalls3.53%BackBelow6000
Просмотров: 21,257
536 обсуждают
3
#AmazonSharesFallAbout7%InPremarketTrading
Просмотров: 5,147
174 обсуждают
4
#USMidtermElections
Просмотров: 153,494
1,793 обсуждают
5
#StrategySTRCReaches$99.95ForFirstTimeIn165Days
Просмотров: 3,497
75 обсуждают
6
#BinanceWillListPredictPREDICT
Просмотров: 47,094
919 обсуждают
7
#SwitzerlandFirstSpotBitcoinETFExpectedToTradeInNovember
Просмотров: 1,731
86 обсуждают
8
#StrategyReports$21BQ3OperatingProfit
Просмотров: 1,815
44 обсуждают
9
#TwoAddressesHoldingAbout1.28BUSDTFrozen
Просмотров: 28,629
566 обсуждают
10
#FirstDigitalBlacklistsAttackerAddressHoldingAbout3.4MFDUSD
Просмотров: 856
19 обсуждают