

#tradingsignal
tradingsignal
Просмотров: 12.6M
51,508 обсуждают
Популярные
Новые

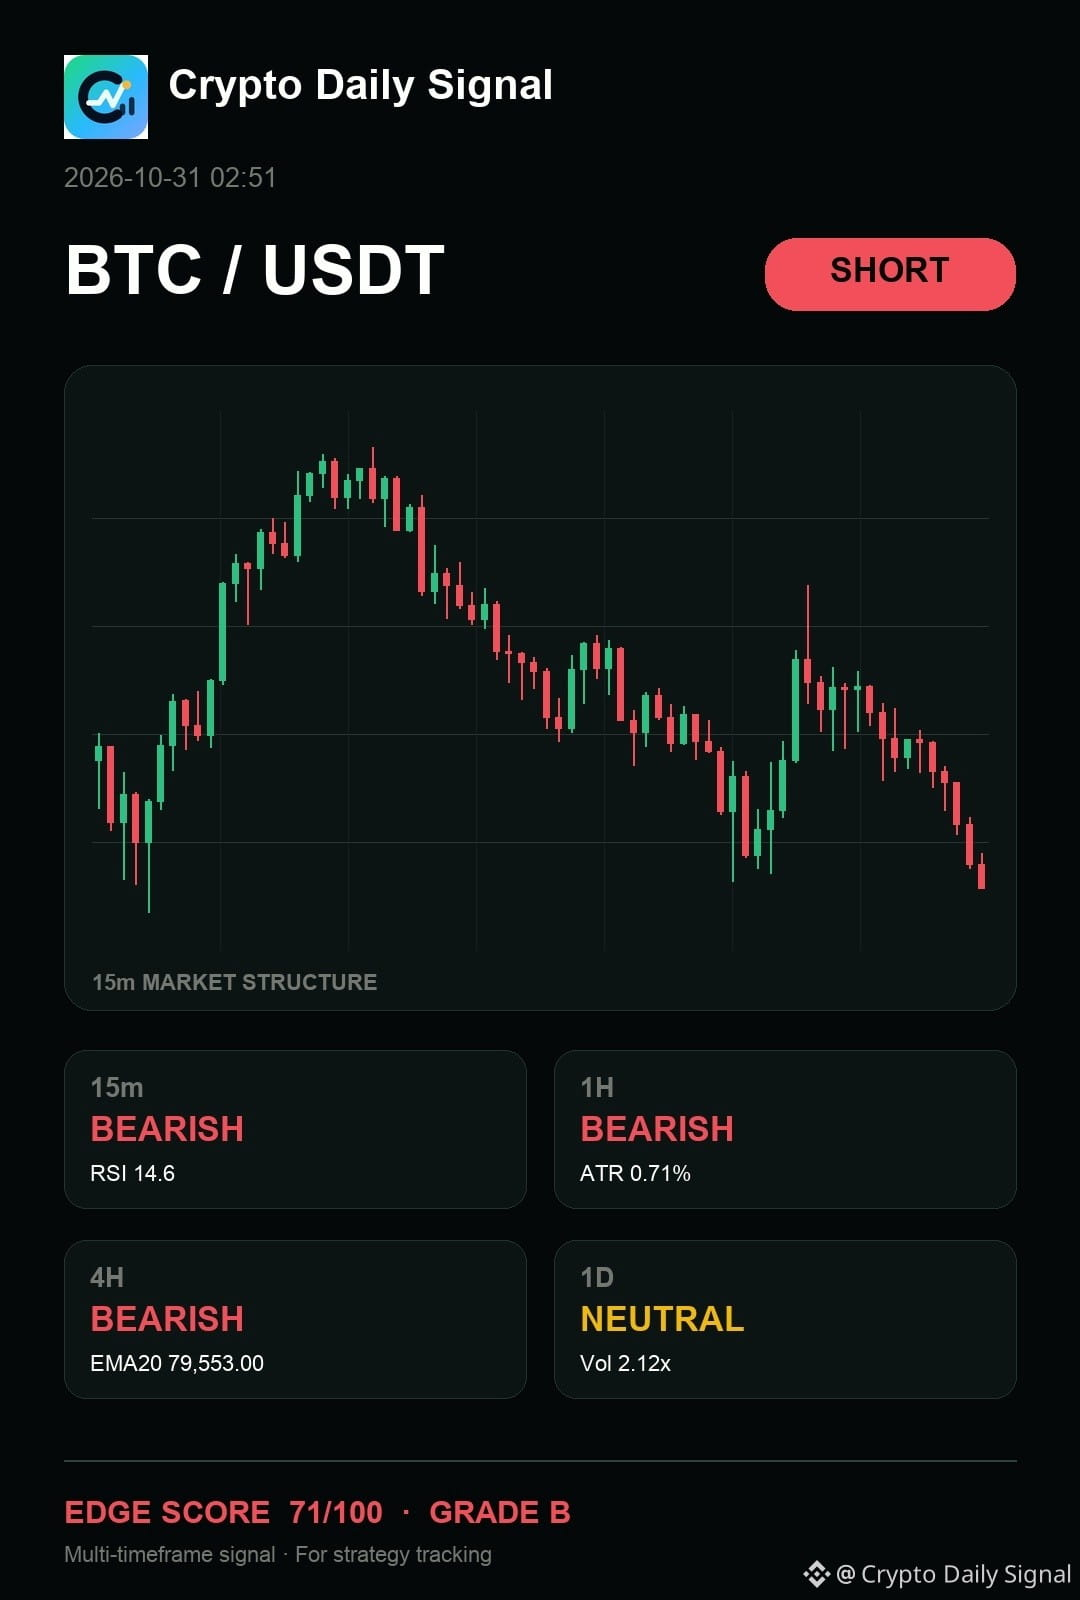
$BTC still has a valid bearish path because of the sequence of lower highs forming on the short-term candles, which is a clear sign of selling pressure. This remains valid as long as the price stays below the immediate range floor. A strong rally above that recent high would certainly kill this outlook.
A clean invalidation ends the thesis — no averaging into it.
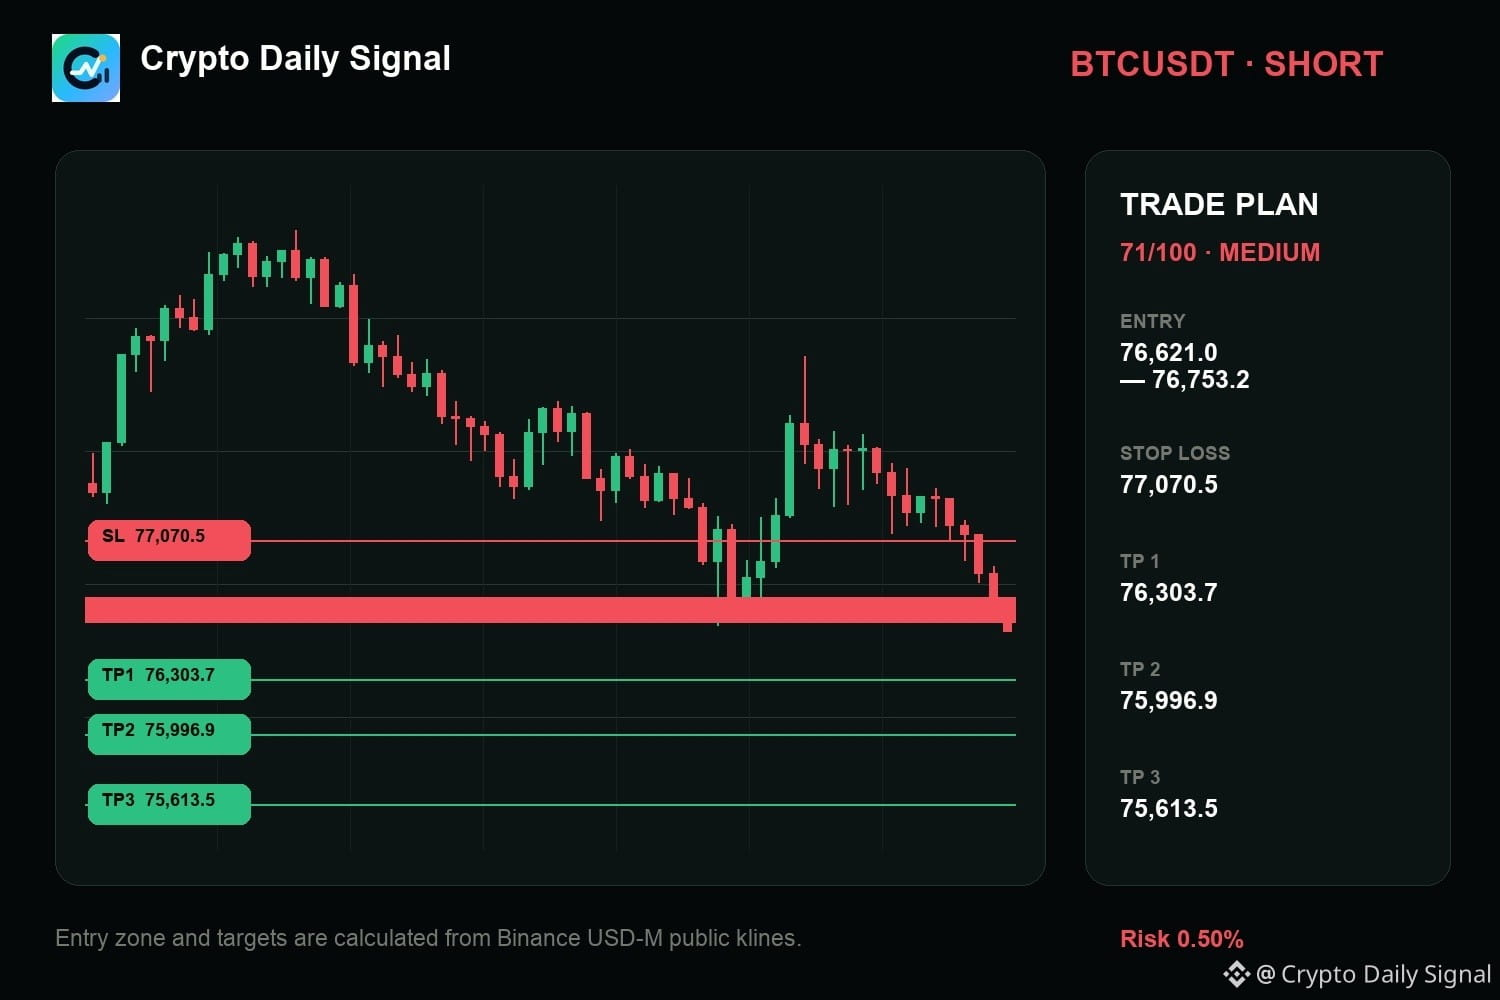
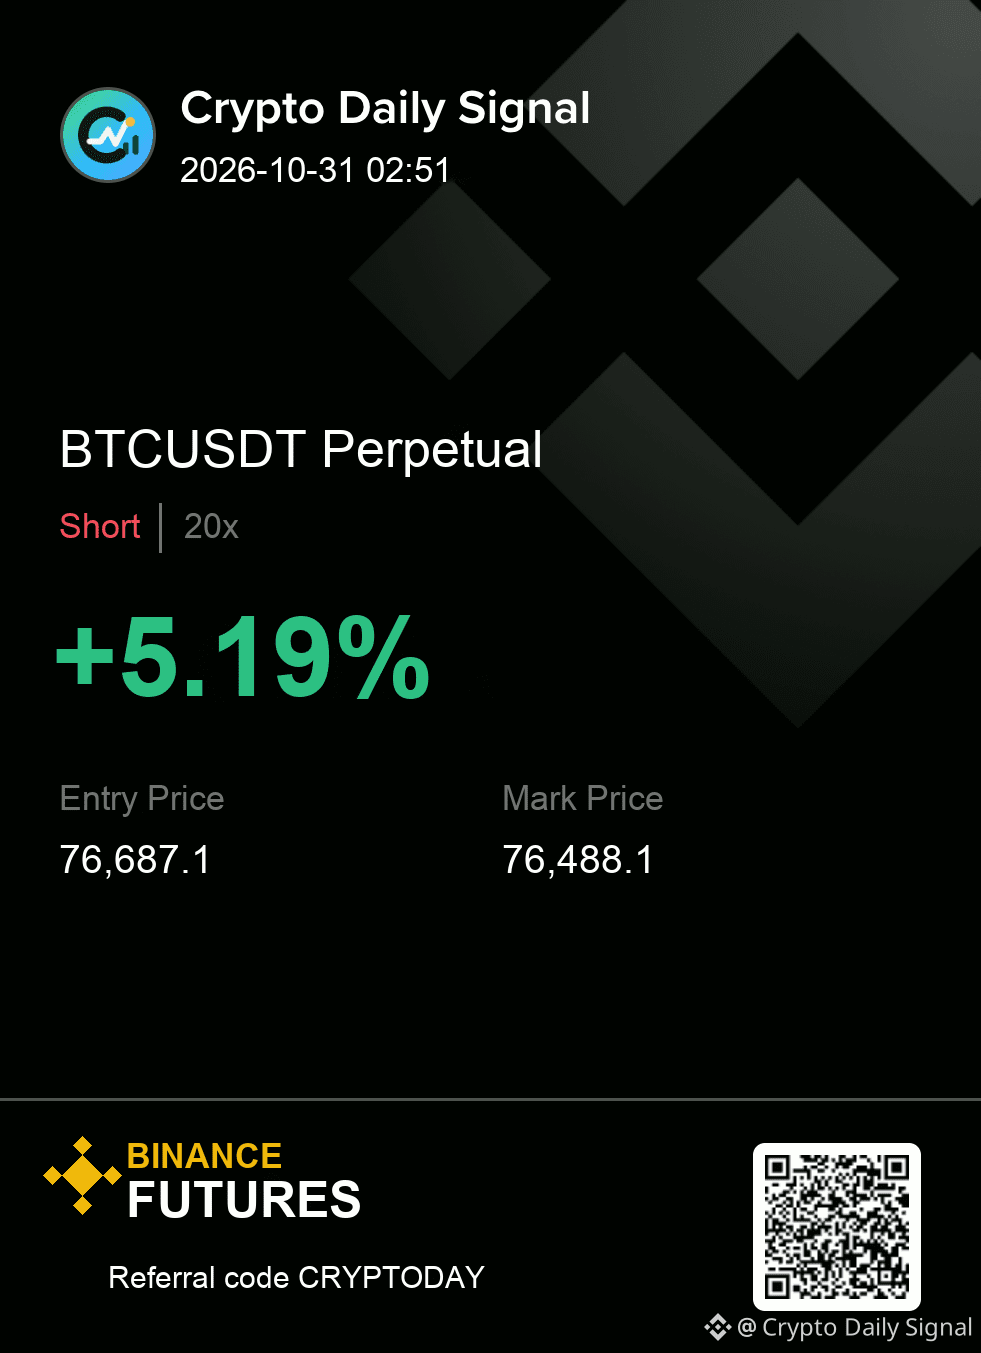
SHORT plan for BTCUSDT
76,621.0 - 76,753.2 entry | 77,070.5 stop
76,303.7 → 75,996.9 → 75,613.5
#TradingSignal
{future}(BTCUSDT)
$BTC still has a valid bearish path because of the sequence of lower highs forming on the short-term candles, which is a clear sign of selling pressure. This remains valid as long as the price stays below the immediate range floor. A strong rally above that recent high would certainly kill this outlook.
A clean invalidation ends the thesis — no averaging into it.
SHORT plan for BTCUSDT
76,621.0 - 76,753.2 entry | 77,070.5 stop
76,303.7 → 75,996.9 → 75,613.5
#TradingSignal
A clean invalidation ends the thesis — no averaging into it.
SHORT plan for BTCUSDT
76,621.0 - 76,753.2 entry | 77,070.5 stop
76,303.7 → 75,996.9 → 75,613.5
#TradingSignal
17

·
--
🔥 HAEDALUSDT LONG setup confirmed.
BIAS: LONG | SCORE: 49.39
Entry: 0.02497 | SL: 0.024673
TP1: 0.025416 | TP2: 0.025714
Strong volume spikes and momentum support a bullish breakout. Remember, this is a setup, not a guaranteed result.
Question: Are you tracking HAEDAL for a breakout? 👀
#CryptoSetup
$HAEDAL #TradingSignal #CryptoAnalysis

7
·
--
🔥 AKEUSDT SHORT SETUP
Combined score: 63.03. Strong bearish breakdown structure. Momentum shifting with volume spikes and price dropping on 5m/15m timeframes.
Entry: 0.013328
SL: 0.013612
TP1: 0.012902
TP2: 0.012617
This is a trading setup, not a guaranteed result.
Question: Are you watching AKE for a breakdown? 📉
#AKEUSDT #CryptoSetup
$AKE #TradingSignal #CryptoAnalysis

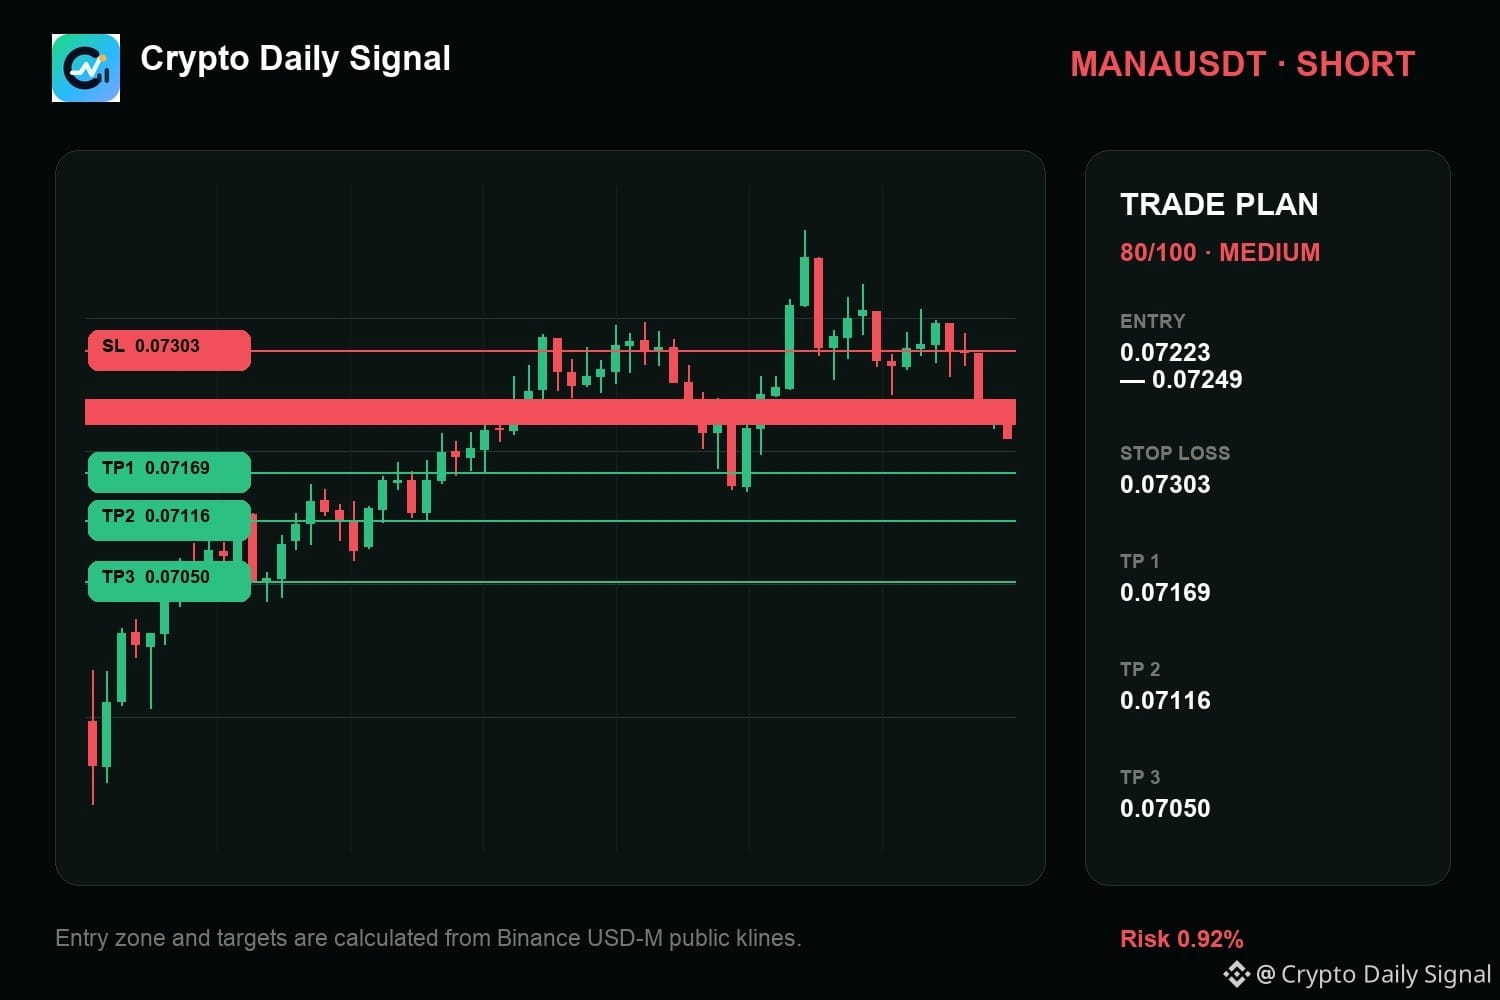
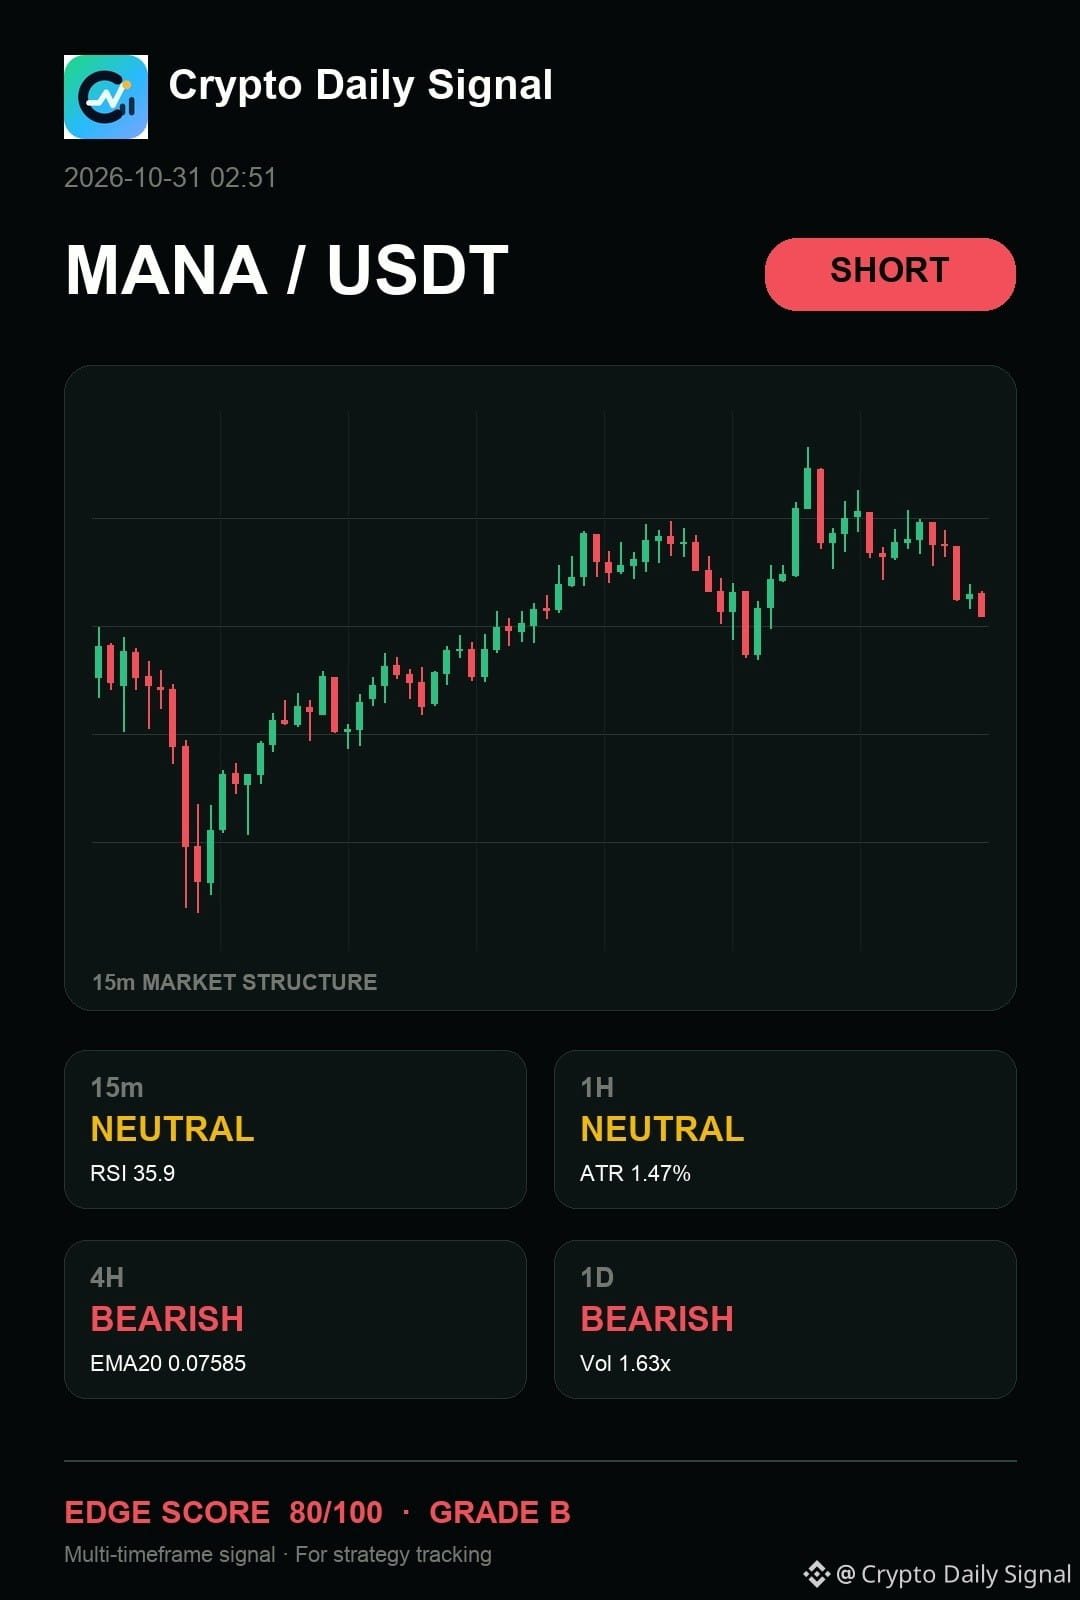
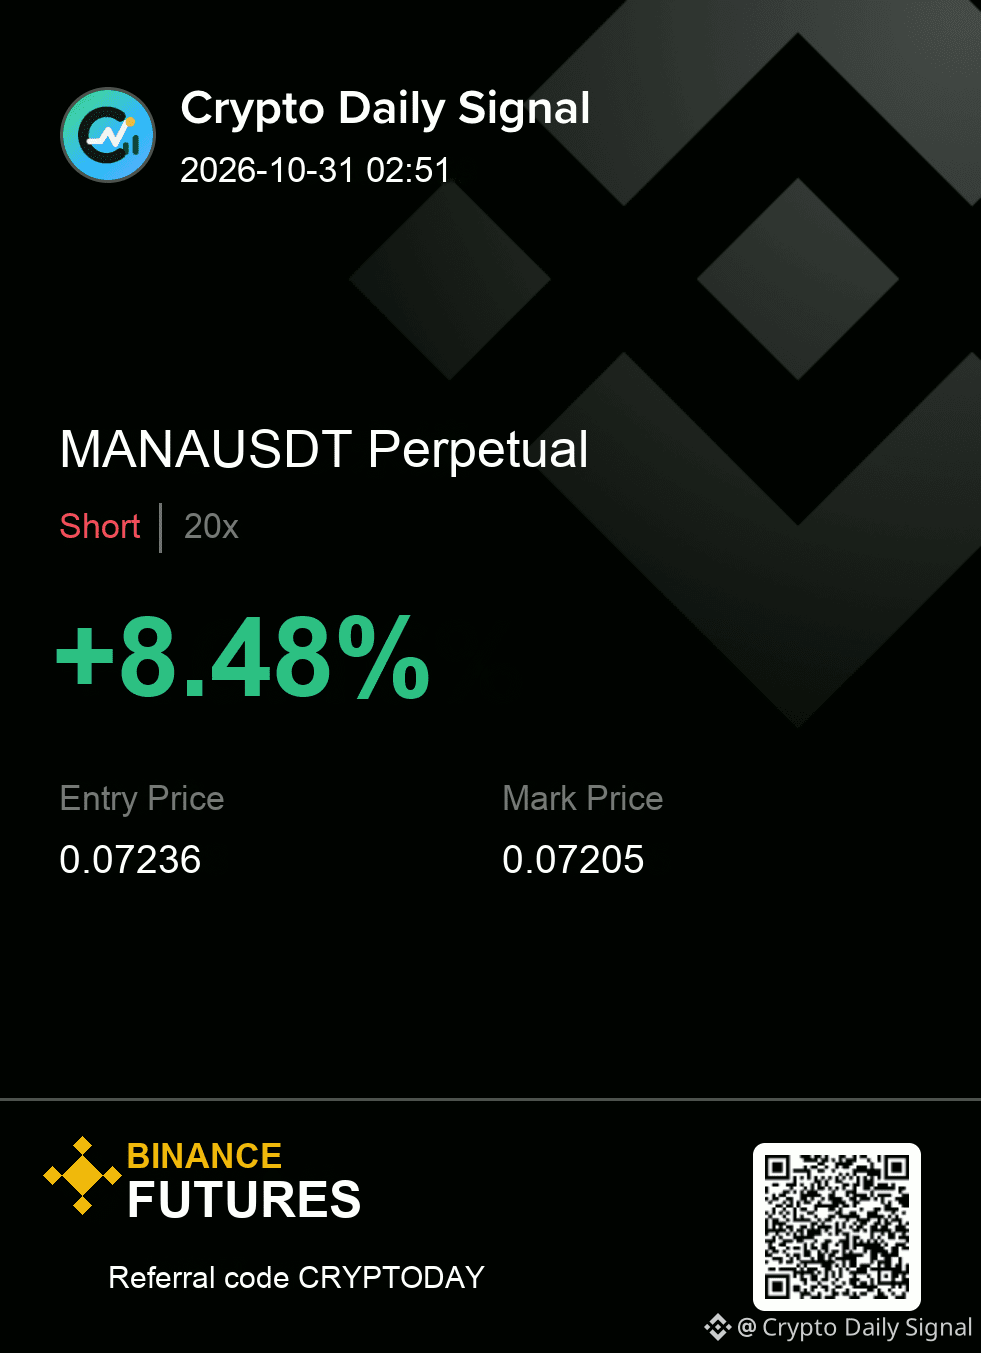
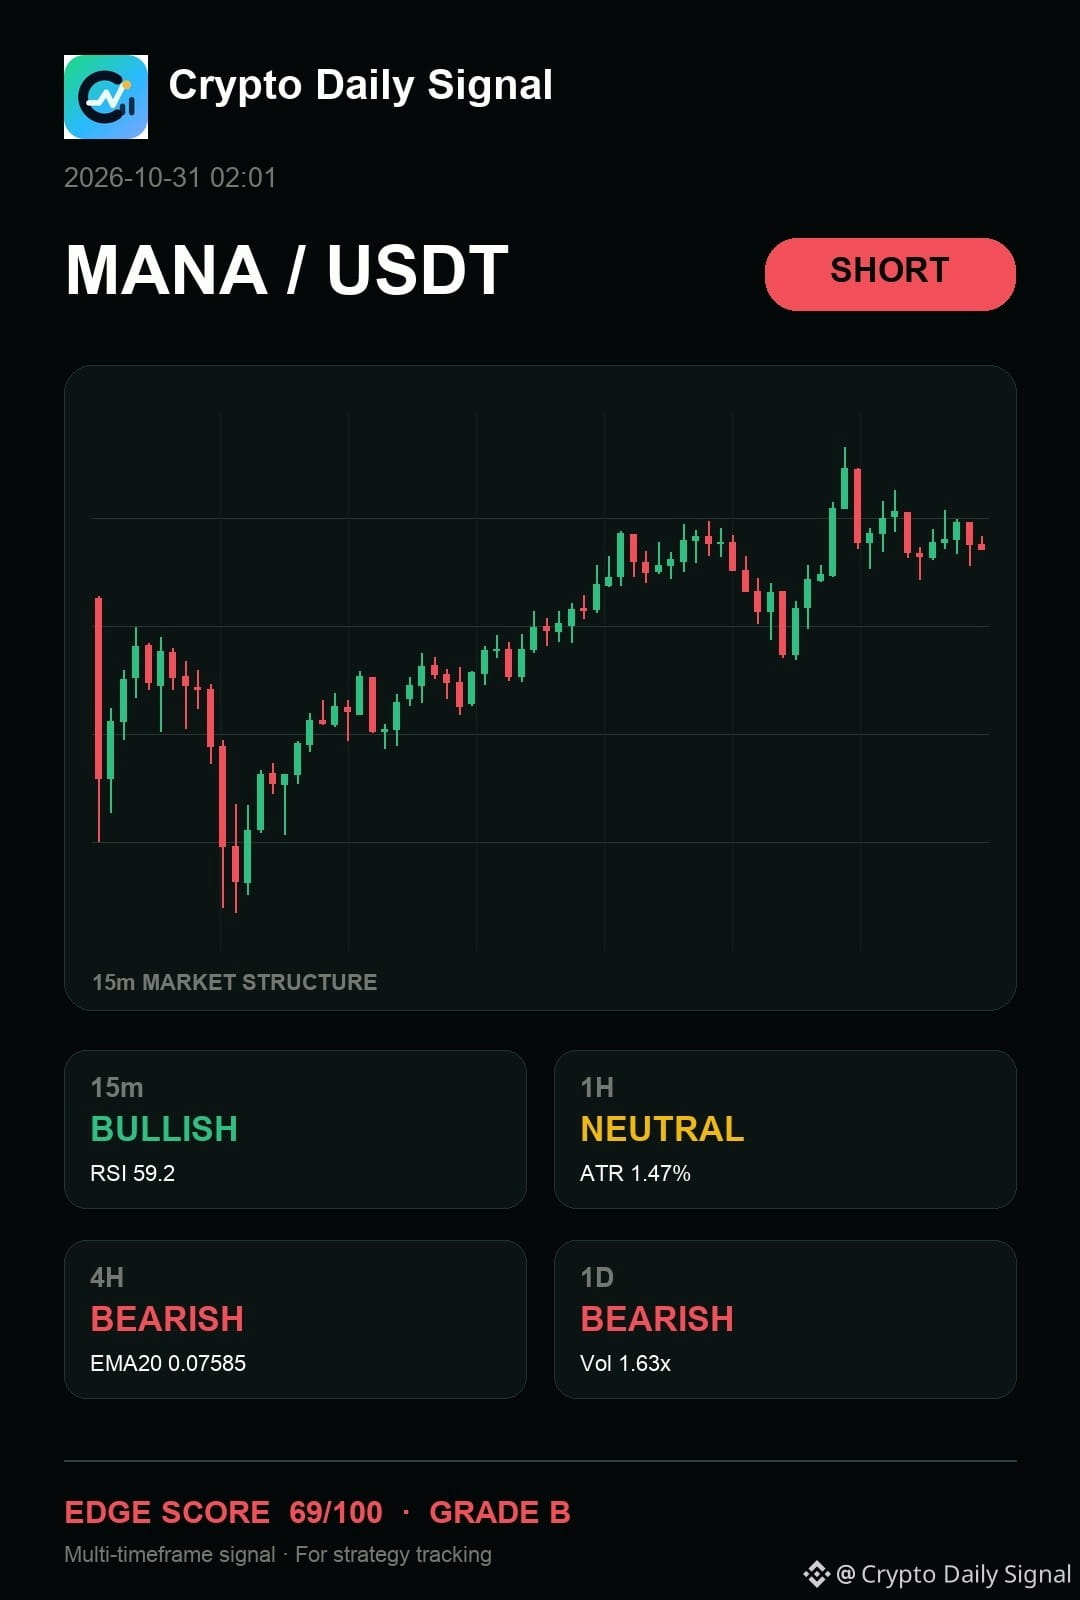
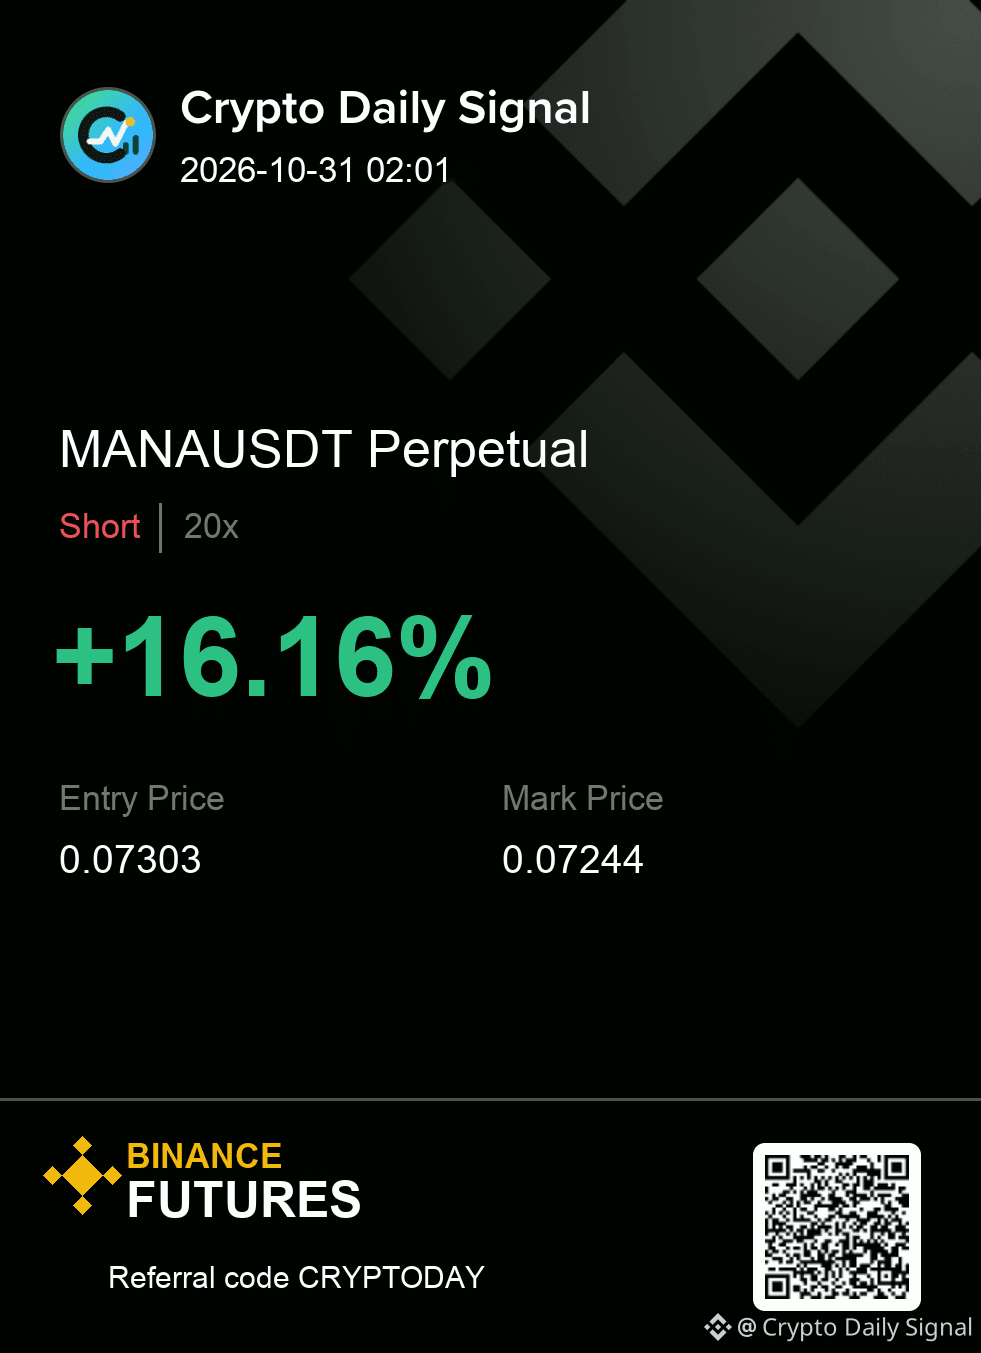
$MANA — man, the part I care about is how it remains a short watch for me, even if some feel the current tight consolidation suggests an imminent bounce. The higher timeframe picture remains bearish, and the recent candles show rejection at higher prices, overriding the short-term range-bound appearance. A strong close above that recent range top would challenge the bearish view, but the underlying weakness holds for now.
SHORT plan for MANAUSDT
0.07223 - 0.07249 entry | 0.07303 stop
0.07169 → 0.07116 → 0.07050
Worth tracking from here, or does the range still need more time?
#TradingSignal
{future}(MANAUSDT)
$MANA — man, the part I care about is how it remains a short watch for me, even if some feel the current tight consolidation suggests an imminent bounce. The higher timeframe picture remains bearish, and the recent candles show rejection at higher prices, overriding the short-term range-bound appearance. A strong close above that recent range top would challenge the bearish view, but the underlying weakness holds for now.
SHORT plan for MANAUSDT
0.07223 - 0.07249 entry | 0.07303 stop
0.07169 → 0.07116 → 0.07050
Worth tracking from here, or does the range still need more time?
#TradingSignal
SHORT plan for MANAUSDT
0.07223 - 0.07249 entry | 0.07303 stop
0.07169 → 0.07116 → 0.07050
Worth tracking from here, or does the range still need more time?
#TradingSignal
6
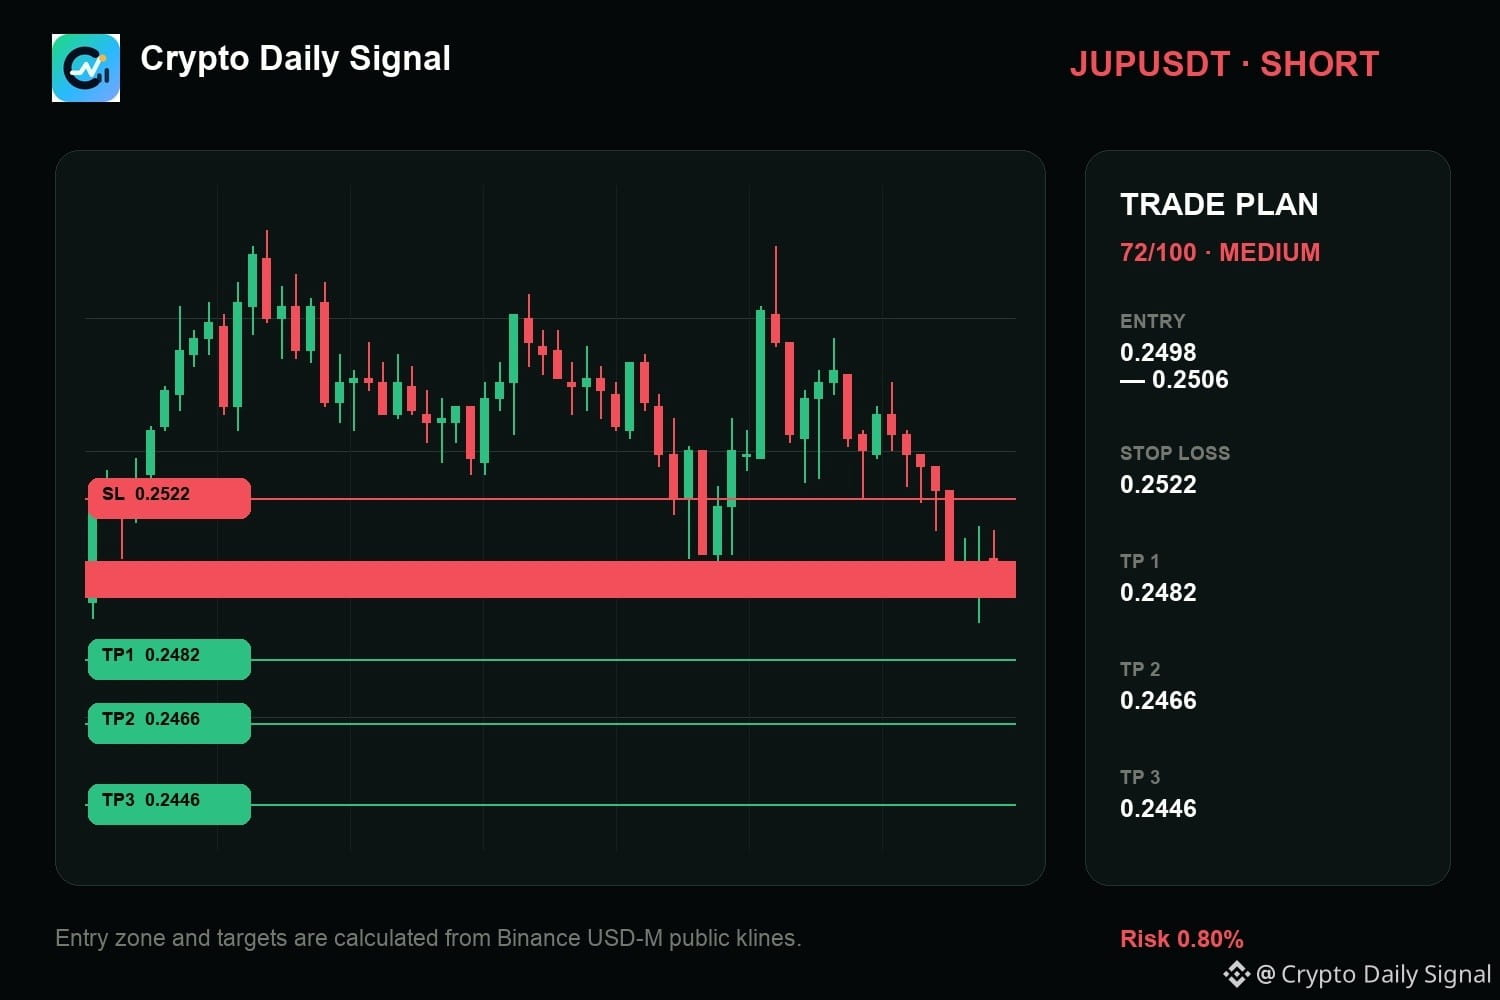
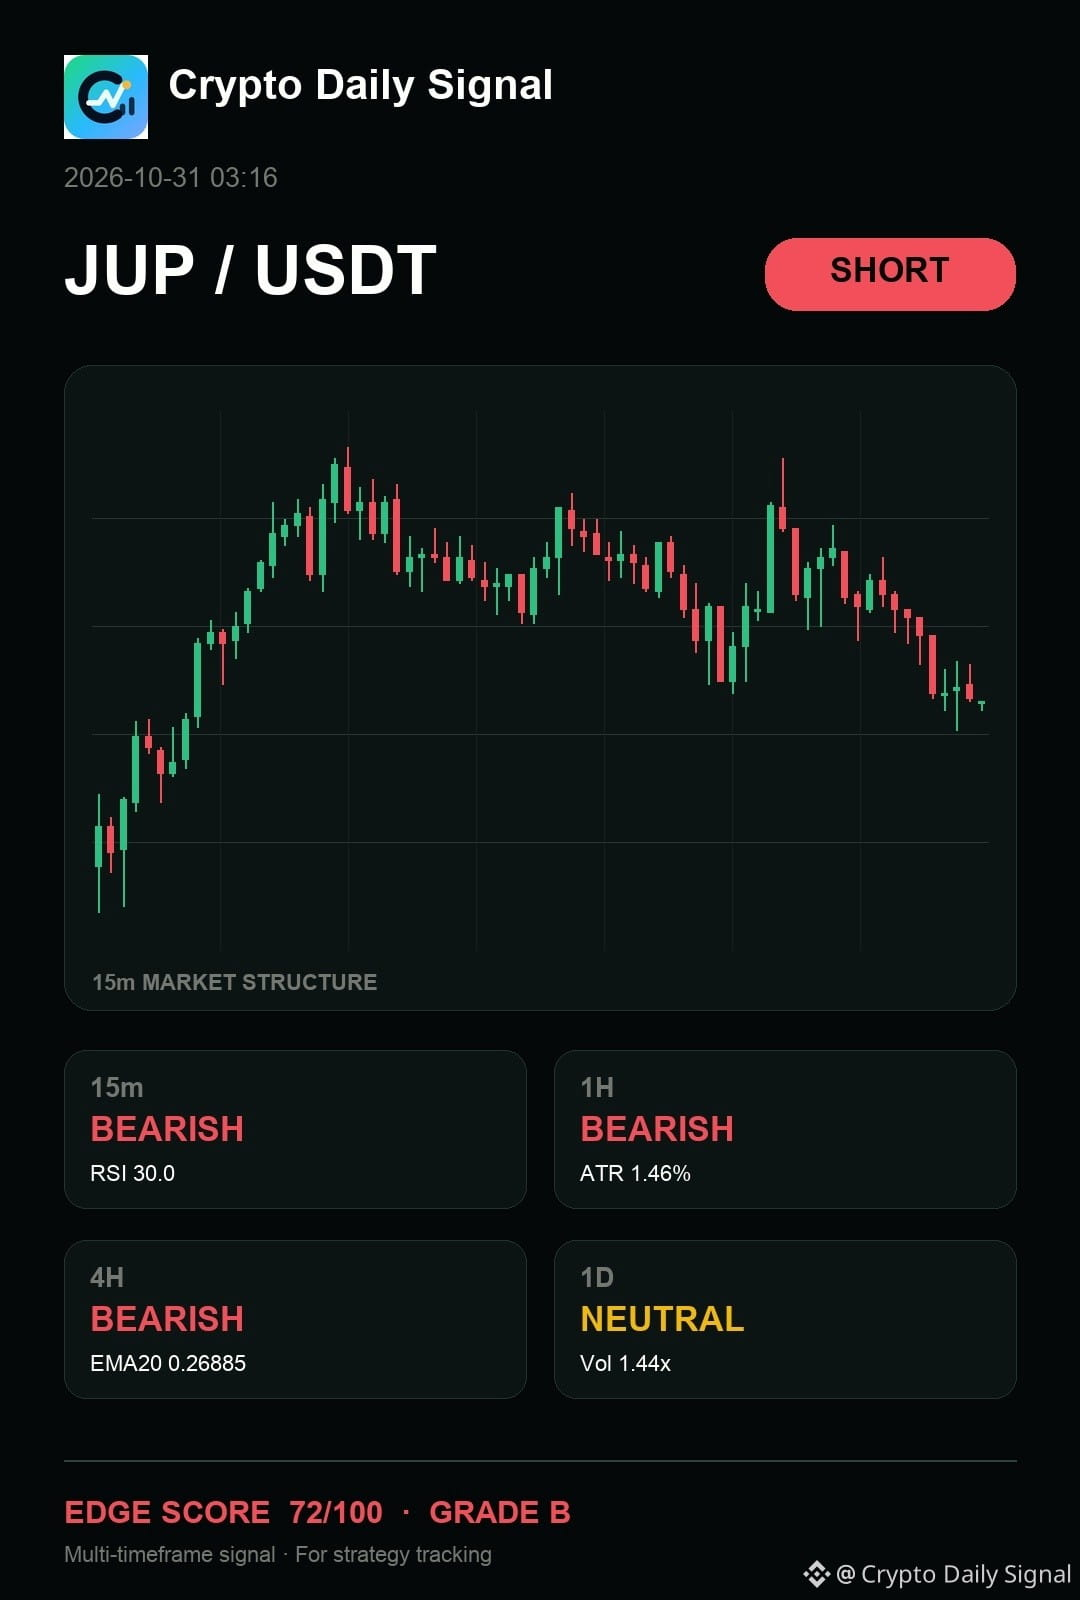
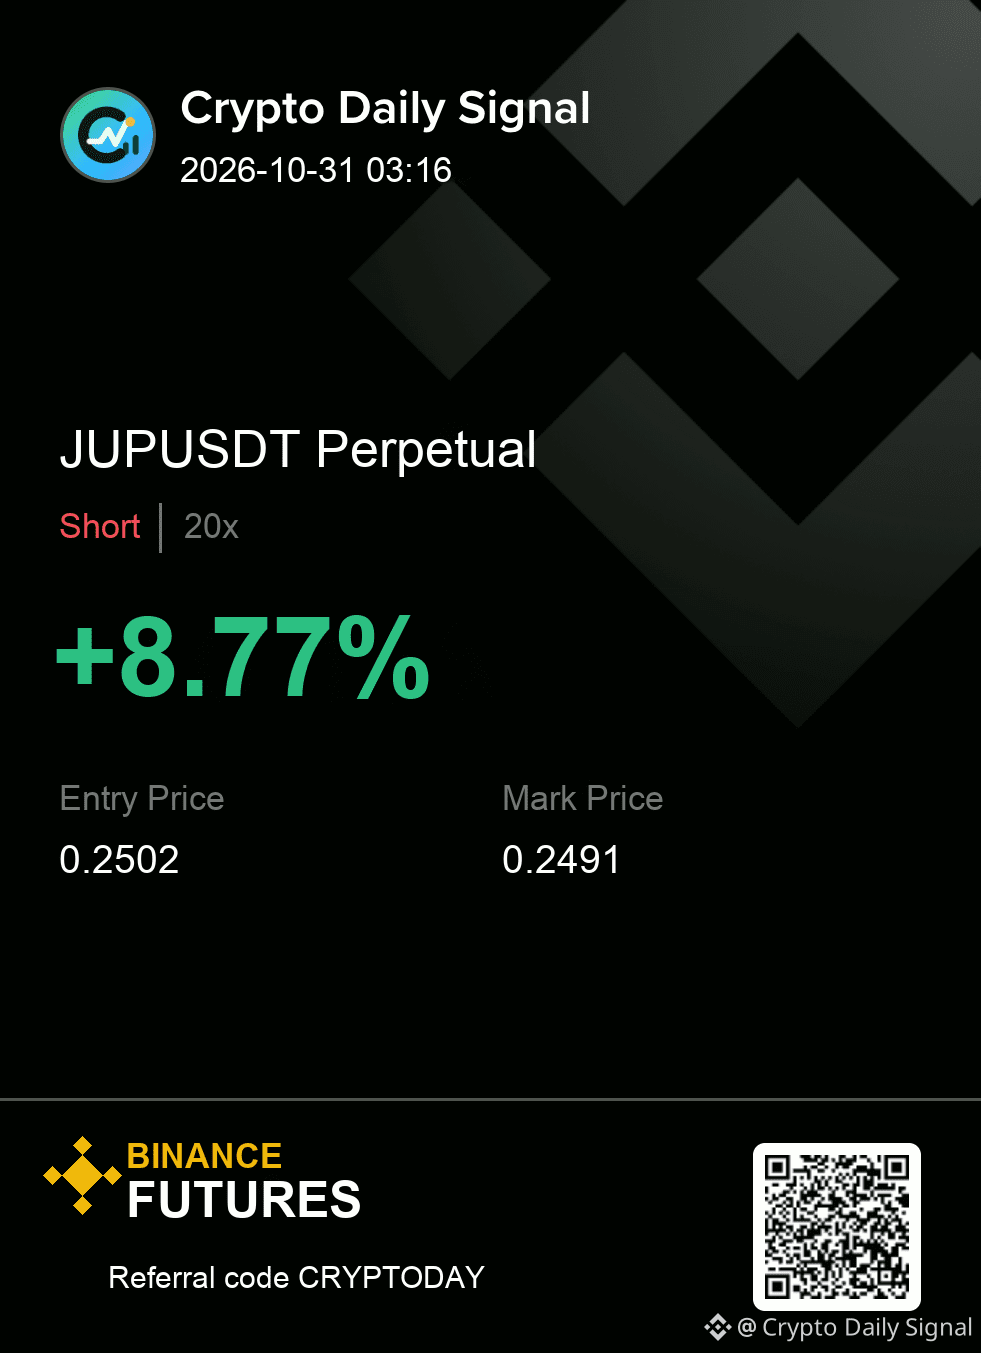
$JUP — bro, here's my read: it still offers the cleaner bearish argument because the price keeps chopping below the descending trendline connecting recent peaks. We need a firm close below that trendline to make this trade solid. If it punches higher above the last swing high, the short thesis collapses.
Execution plan (JUPUSDT — SHORT)
Entry: 0.2498 - 0.2506 | SL: 0.2522
Take profit: 0.2482 → 0.2466 → 0.2446
The map is useful only while the invalidation remains intact.
#TradingSignal
{future}(JUPUSDT)
$JUP — bro, here's my read: it still offers the cleaner bearish argument because the price keeps chopping below the descending trendline connecting recent peaks. We need a firm close below that trendline to make this trade solid. If it punches higher above the last swing high, the short thesis collapses.
Execution plan (JUPUSDT — SHORT)
Entry: 0.2498 - 0.2506 | SL: 0.2522
Take profit: 0.2482 → 0.2466 → 0.2446
The map is useful only while the invalidation remains intact.
#TradingSignal
Execution plan (JUPUSDT — SHORT)
Entry: 0.2498 - 0.2506 | SL: 0.2522
Take profit: 0.2482 → 0.2466 → 0.2446
The map is useful only while the invalidation remains intact.
#TradingSignal
10
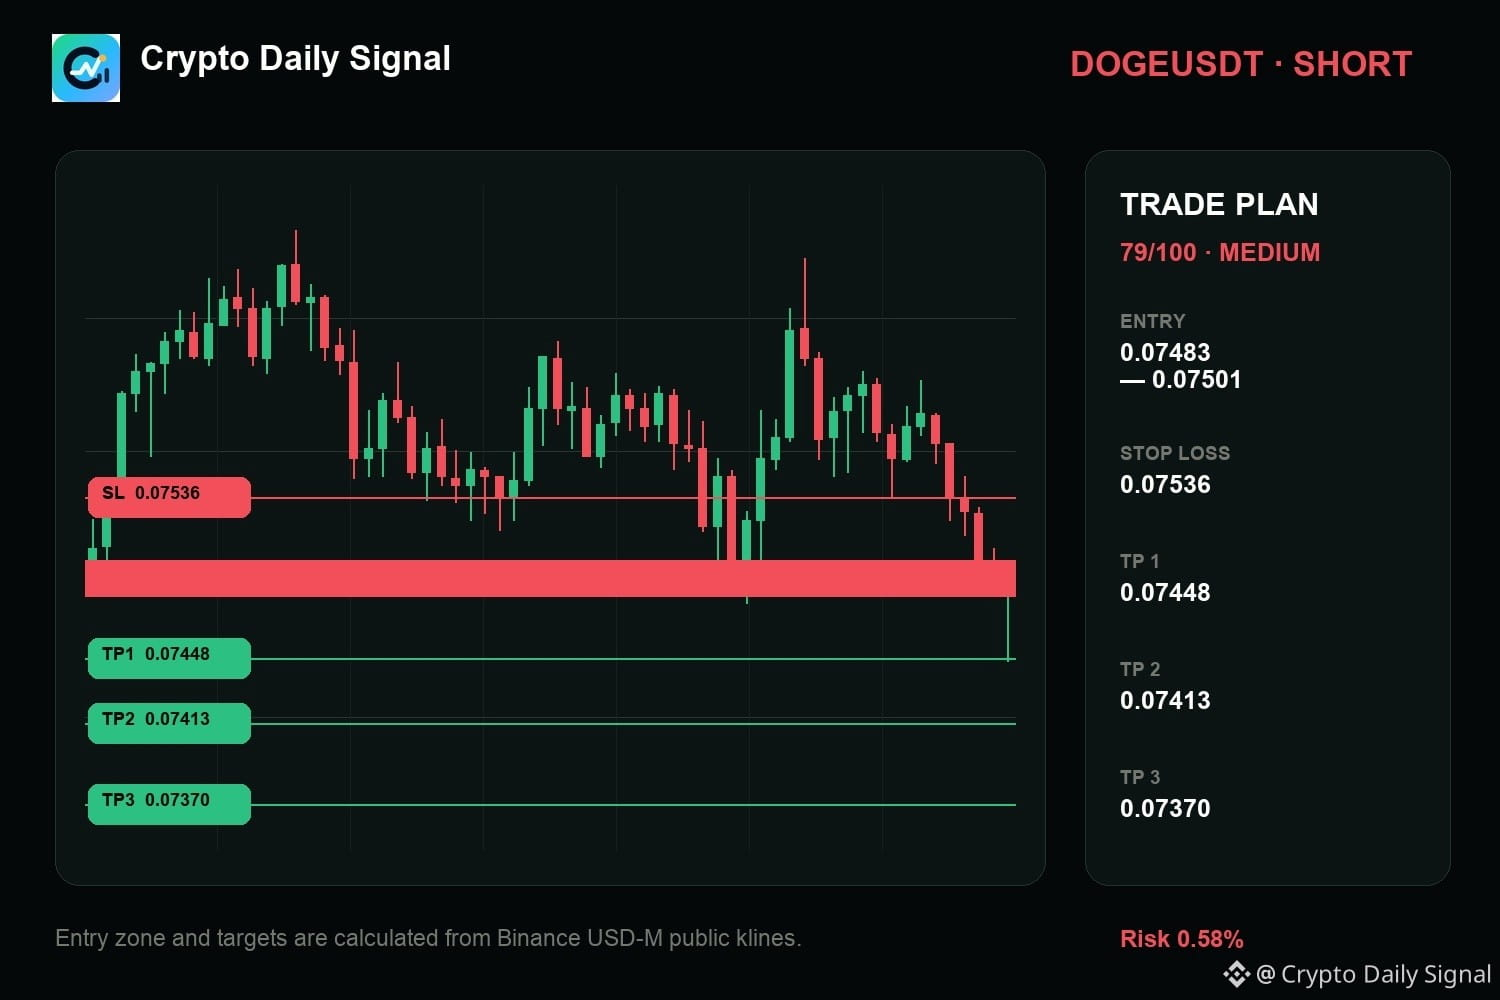
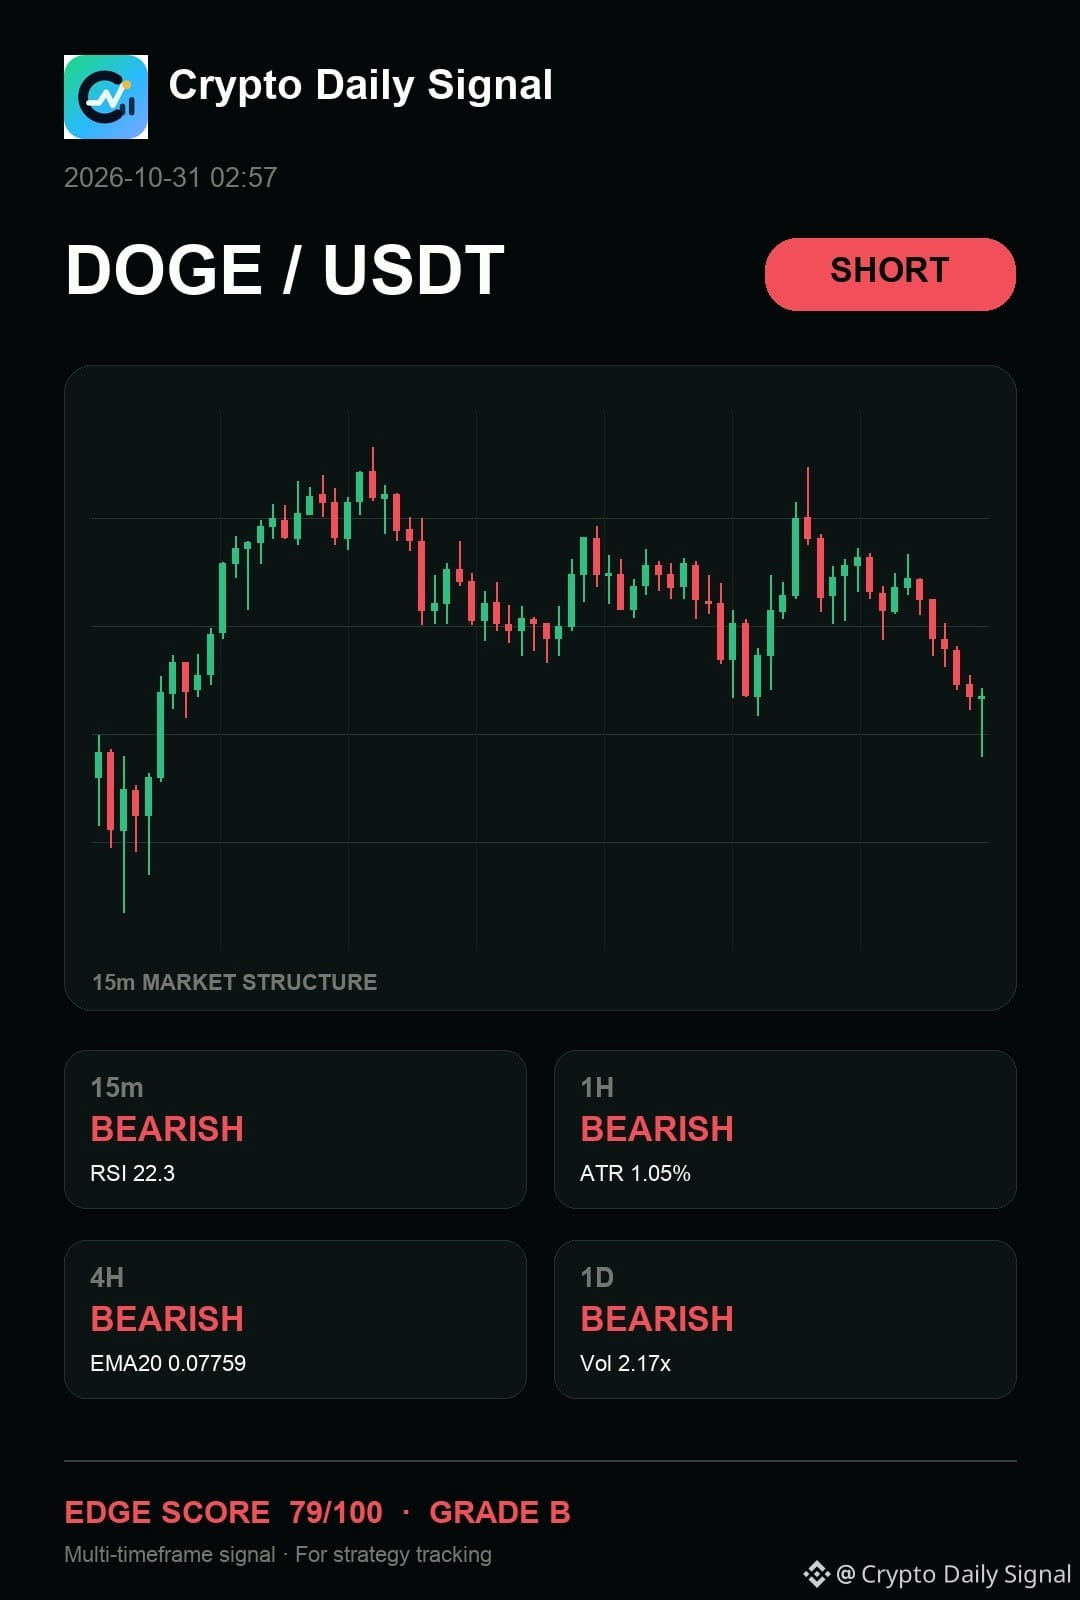
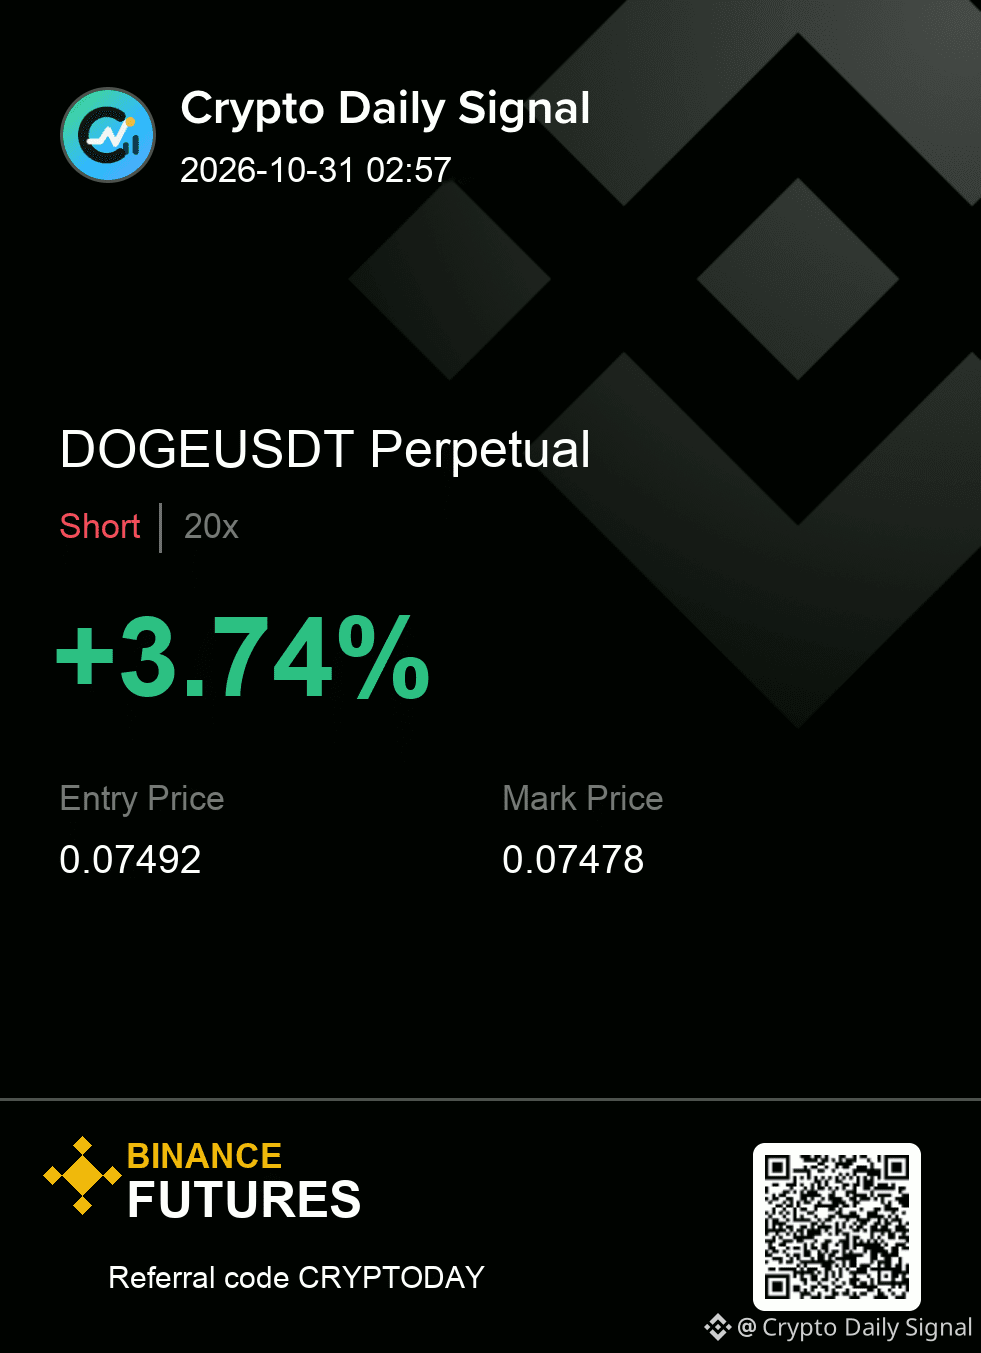
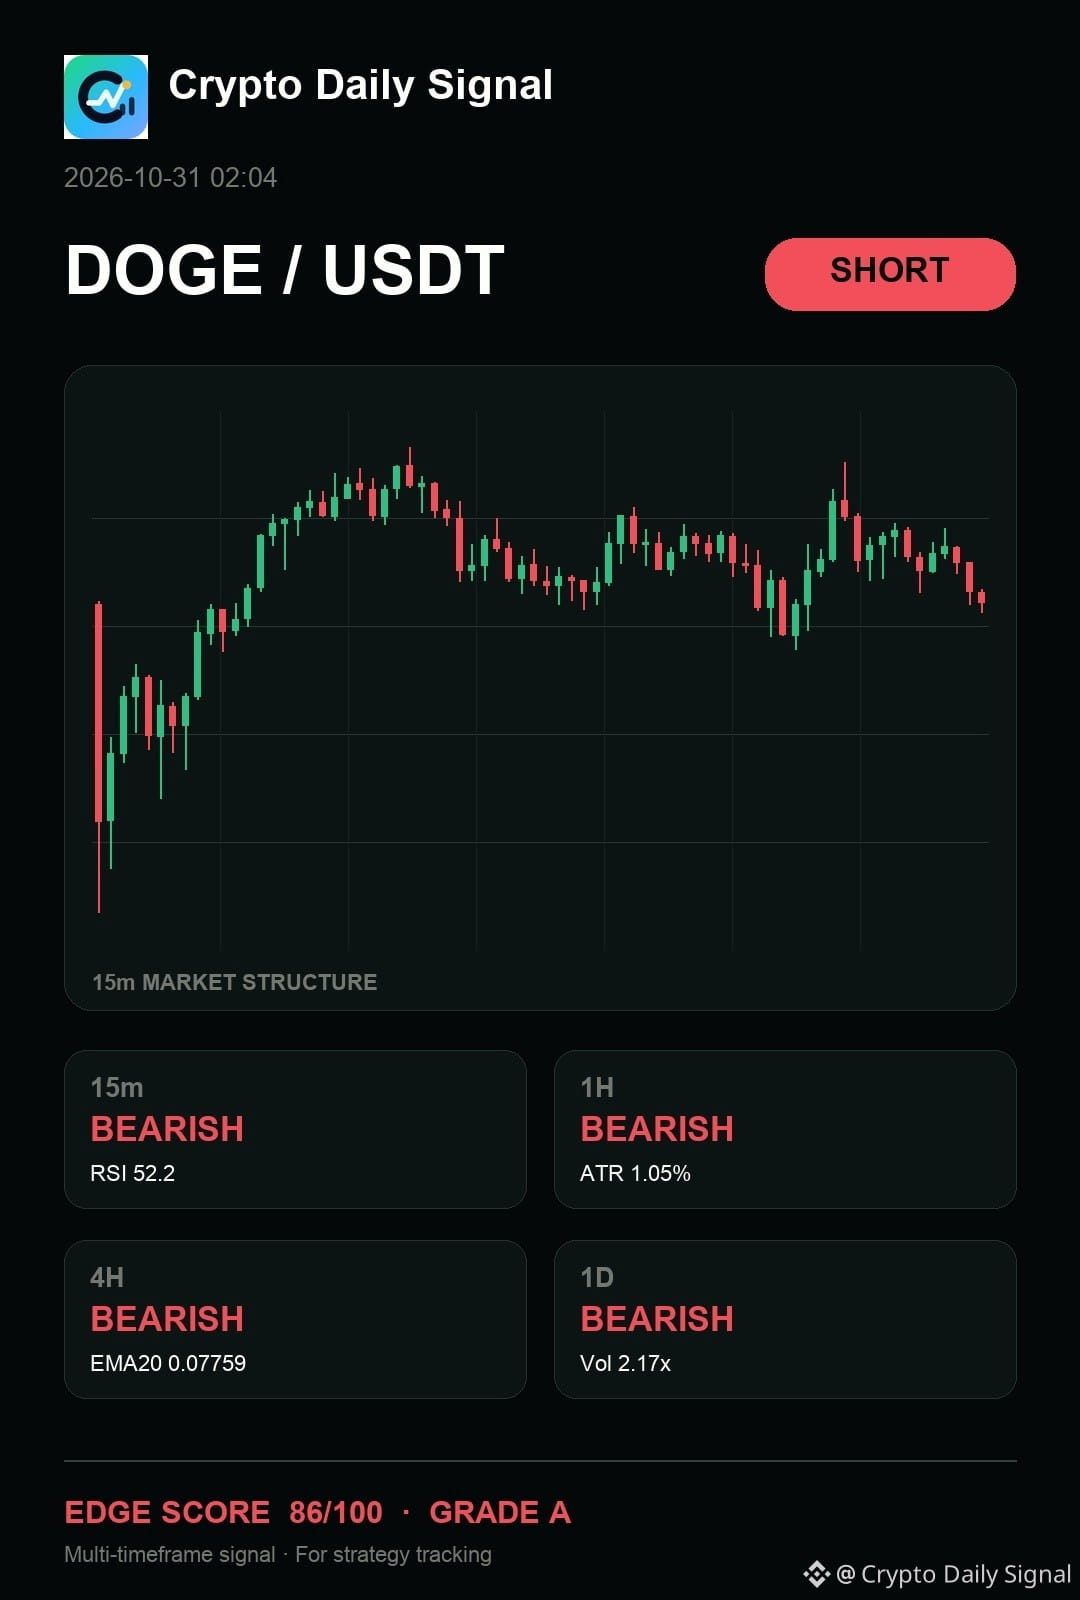
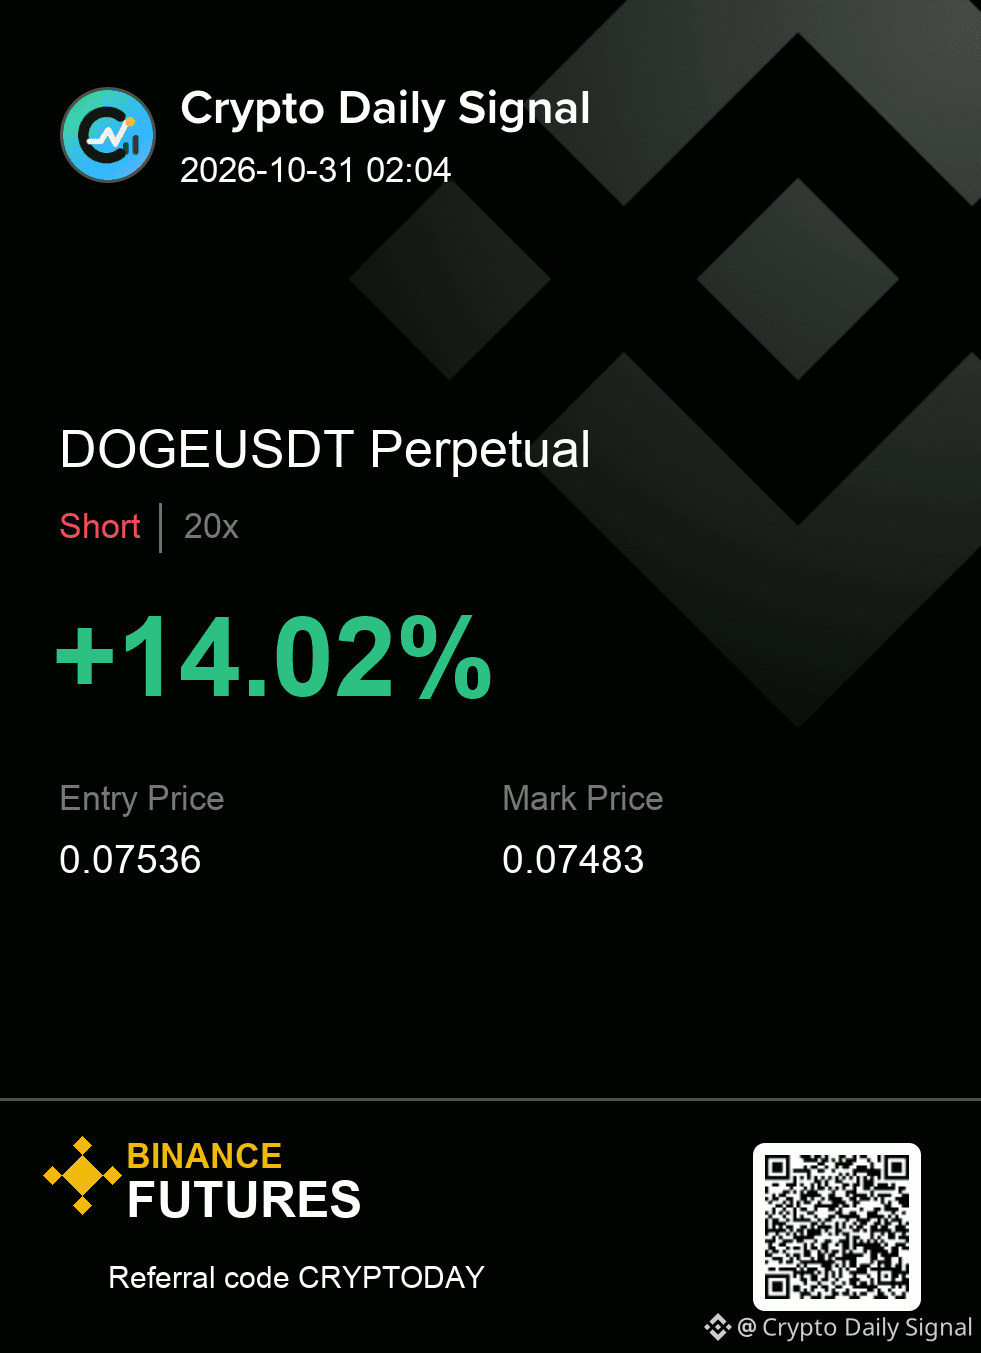
$DOGE — one thing is clear to me: it stays on my short list for now. The higher-timeframe picture reads bearish, and the four-hour leg remains bearish. Let price prove the zone rather than chasing momentum; if the risk boundary fails, I move on without arguing with it.
No chase outside the zone; the stop defines the whole idea.
Execution plan (DOGEUSDT — SHORT)
Entry: 0.07483 - 0.07501 | SL: 0.07536
Take profit: 0.07448 → 0.07413 → 0.07370
#TradingSignal
{future}(DOGEUSDT)
$DOGE — one thing is clear to me: it stays on my short list for now. The higher-timeframe picture reads bearish, and the four-hour leg remains bearish. Let price prove the zone rather than chasing momentum; if the risk boundary fails, I move on without arguing with it.
No chase outside the zone; the stop defines the whole idea.
Execution plan (DOGEUSDT — SHORT)
Entry: 0.07483 - 0.07501 | SL: 0.07536
Take profit: 0.07448 → 0.07413 → 0.07370
#TradingSignal
No chase outside the zone; the stop defines the whole idea.
Execution plan (DOGEUSDT — SHORT)
Entry: 0.07483 - 0.07501 | SL: 0.07536
Take profit: 0.07448 → 0.07413 → 0.07370
#TradingSignal
13
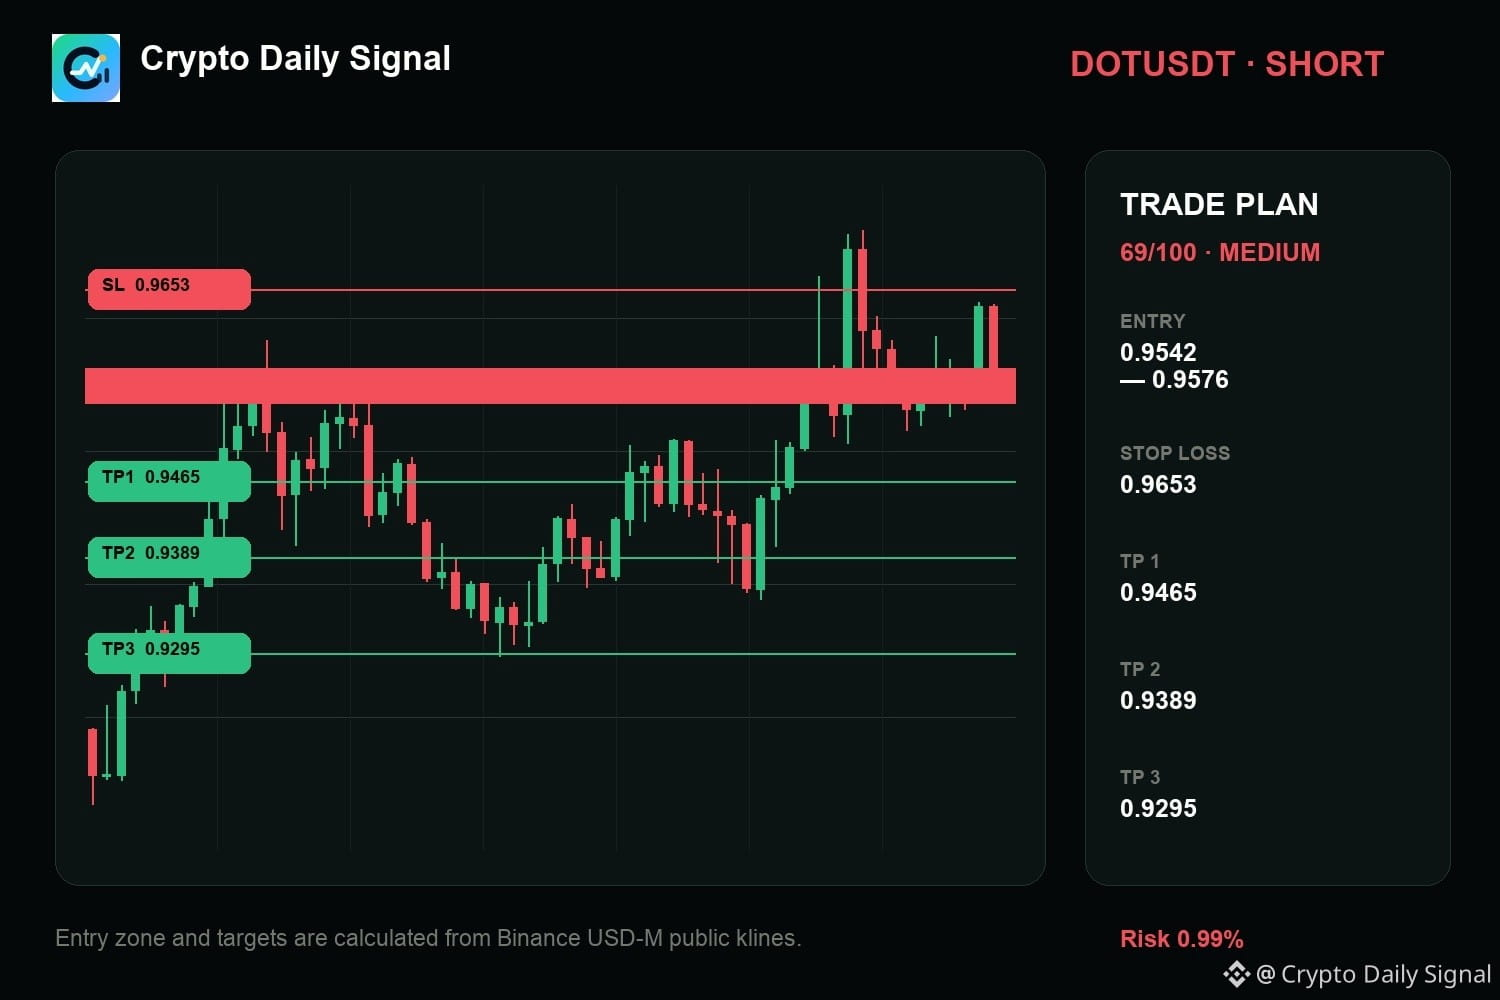
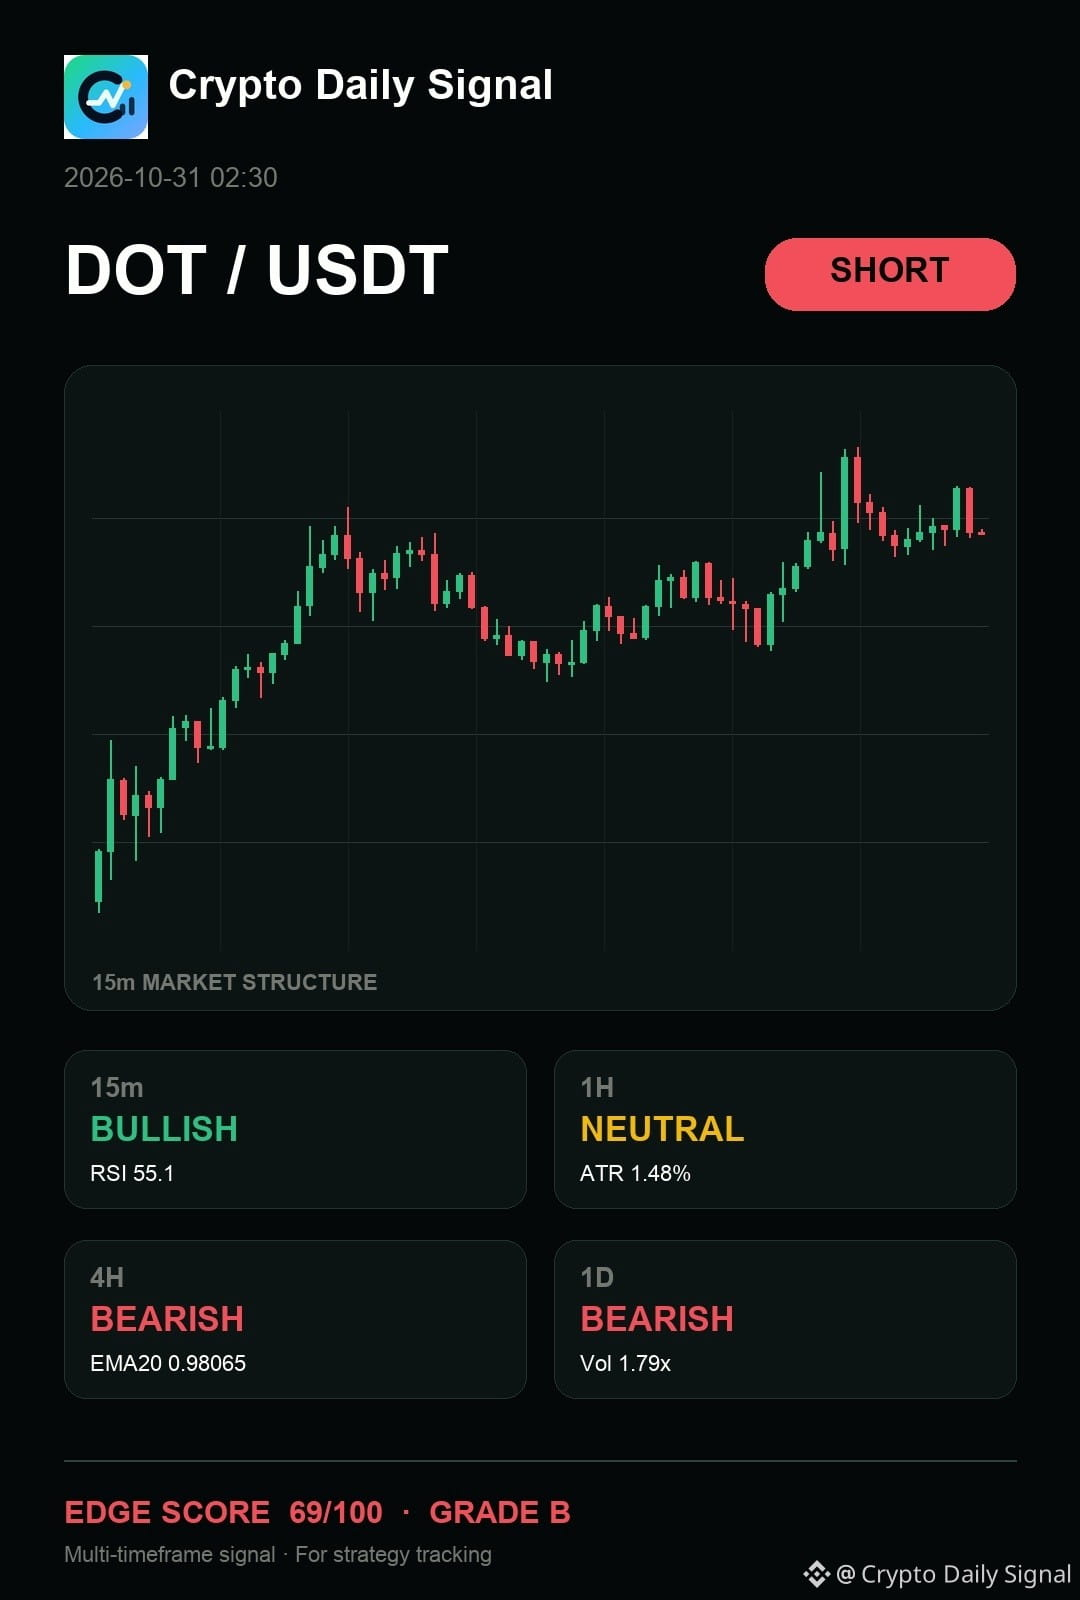
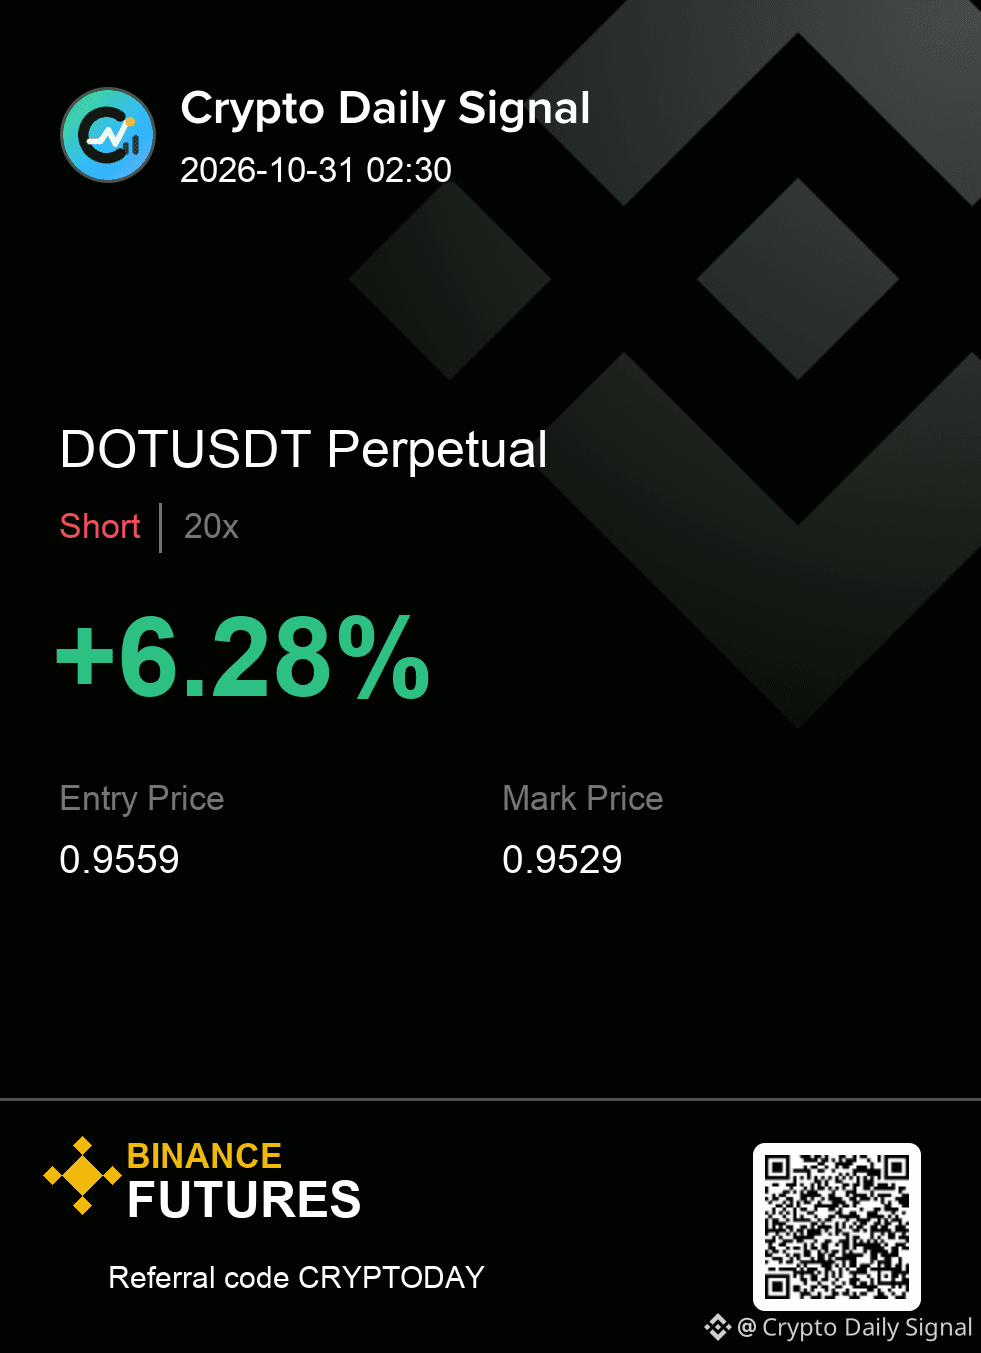
$DOT continues to favor the short case, but chasing here is premature given the price is just range-bound, even as the daily and four-hour views show weakness. The recent upper wick rejections suggest buyers are struggling to make a clean move above prior resistance. I need a decisive drop below immediate short-term support to make this trade structure work cleanly.
Levels — DOTUSDT
Zone: 0.9542 - 0.9576
Cut: 0.9653
Scale: 0.9465 | 0.9389 | 0.9295
What would you need to see before putting risk behind this idea?
#TradingSignal
{future}(DOTUSDT)
$DOT continues to favor the short case, but chasing here is premature given the price is just range-bound, even as the daily and four-hour views show weakness. The recent upper wick rejections suggest buyers are struggling to make a clean move above prior resistance. I need a decisive drop below immediate short-term support to make this trade structure work cleanly.
Levels — DOTUSDT
Zone: 0.9542 - 0.9576
Cut: 0.9653
Scale: 0.9465 | 0.9389 | 0.9295
What would you need to see before putting risk behind this idea?
#TradingSignal
Levels — DOTUSDT
Zone: 0.9542 - 0.9576
Cut: 0.9653
Scale: 0.9465 | 0.9389 | 0.9295
What would you need to see before putting risk behind this idea?
#TradingSignal
12
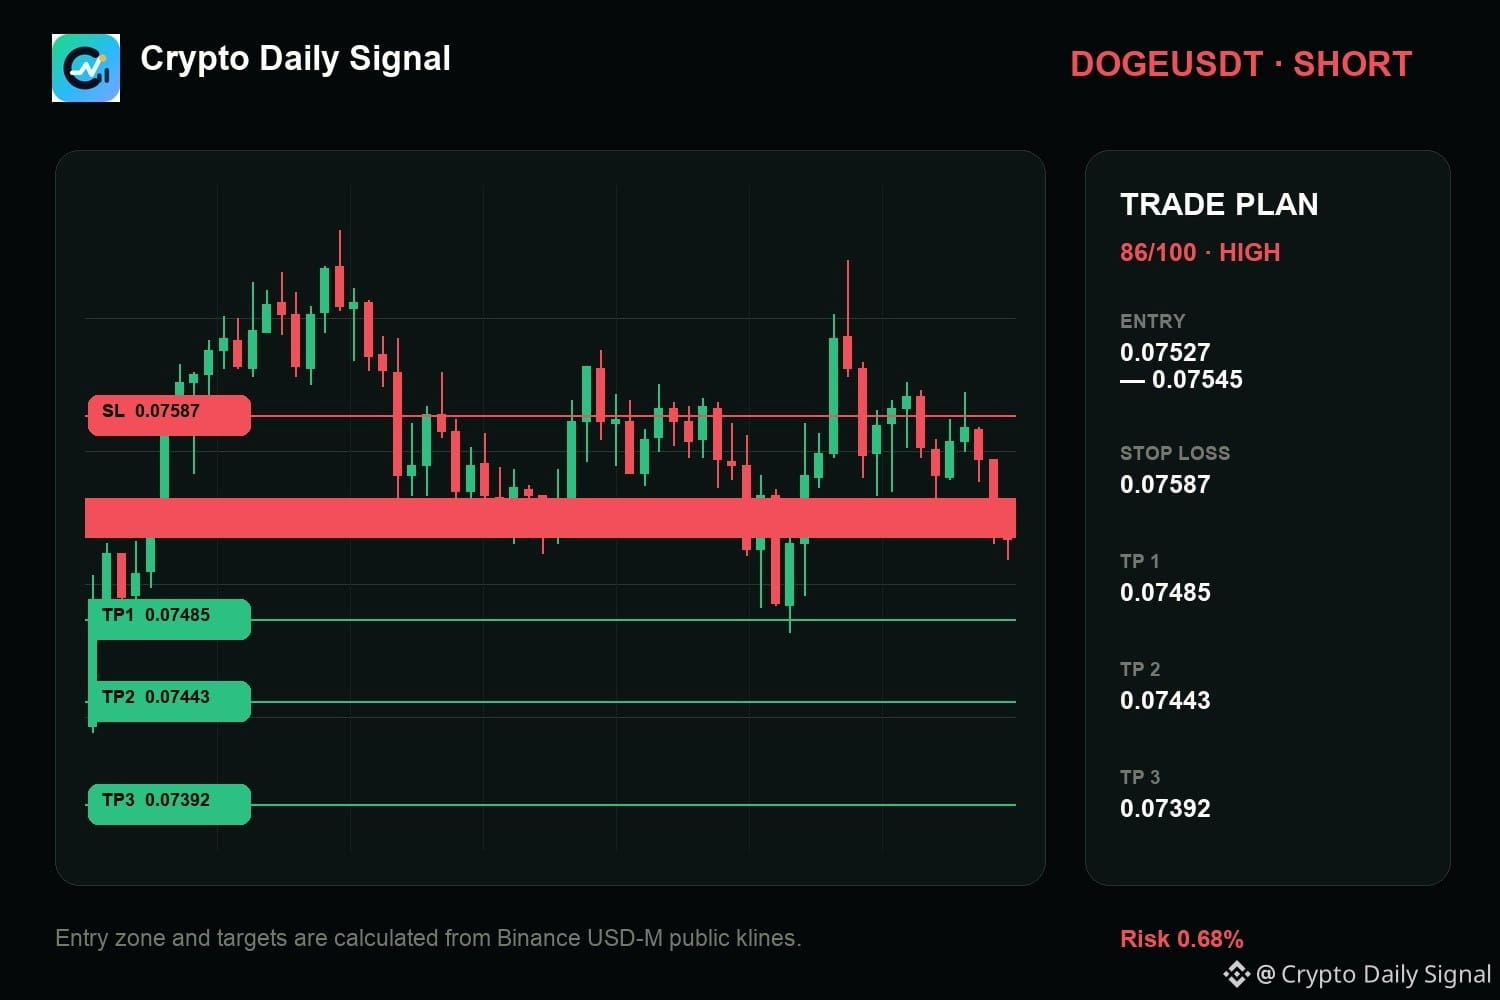
$DOGE — for me, the core read is that it gets my attention on the short side. Look, the broader structure still reads bearish, while the four-hour bias is bearish. I am waiting for price to behave inside the planned zone, not forcing an entry outside it. Lose the risk line and I step away.
The levels matter more than the prediction. Size it accordingly.
Execution plan (DOGEUSDT — SHORT)
Entry: 0.07527 - 0.07545 | SL: 0.07587
Take profit: 0.07485 → 0.07443 → 0.07392
#TradingSignal
{future}(DOGEUSDT)
$DOGE — for me, the core read is that it gets my attention on the short side. Look, the broader structure still reads bearish, while the four-hour bias is bearish. I am waiting for price to behave inside the planned zone, not forcing an entry outside it. Lose the risk line and I step away.
The levels matter more than the prediction. Size it accordingly.
Execution plan (DOGEUSDT — SHORT)
Entry: 0.07527 - 0.07545 | SL: 0.07587
Take profit: 0.07485 → 0.07443 → 0.07392
#TradingSignal
The levels matter more than the prediction. Size it accordingly.
Execution plan (DOGEUSDT — SHORT)
Entry: 0.07527 - 0.07545 | SL: 0.07587
Take profit: 0.07485 → 0.07443 → 0.07392
#TradingSignal
9
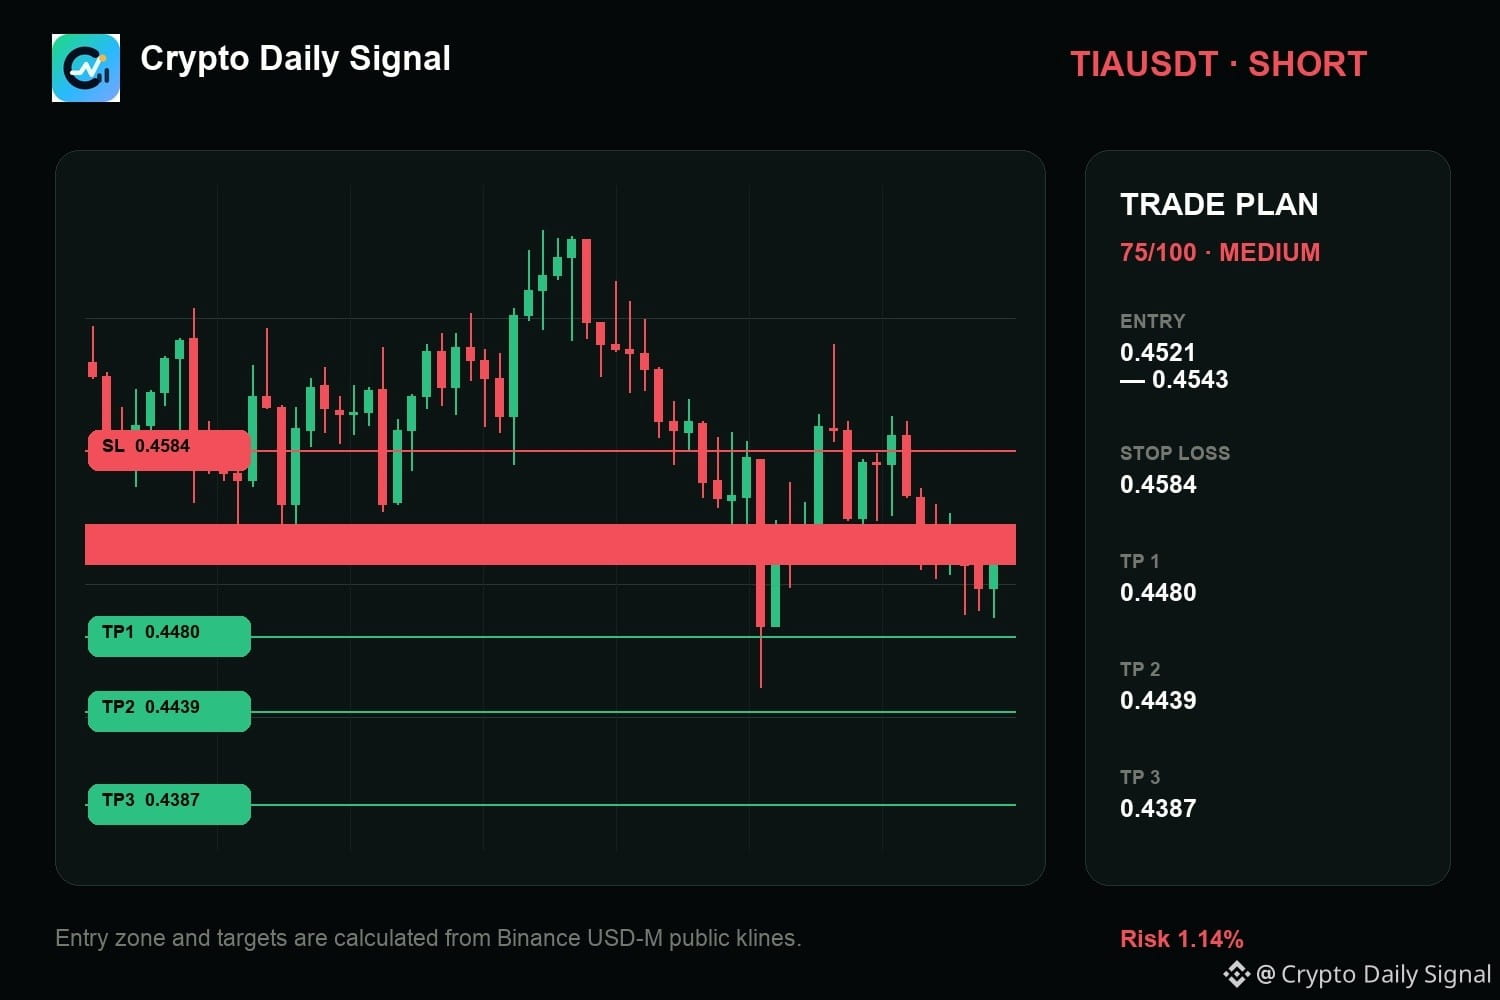
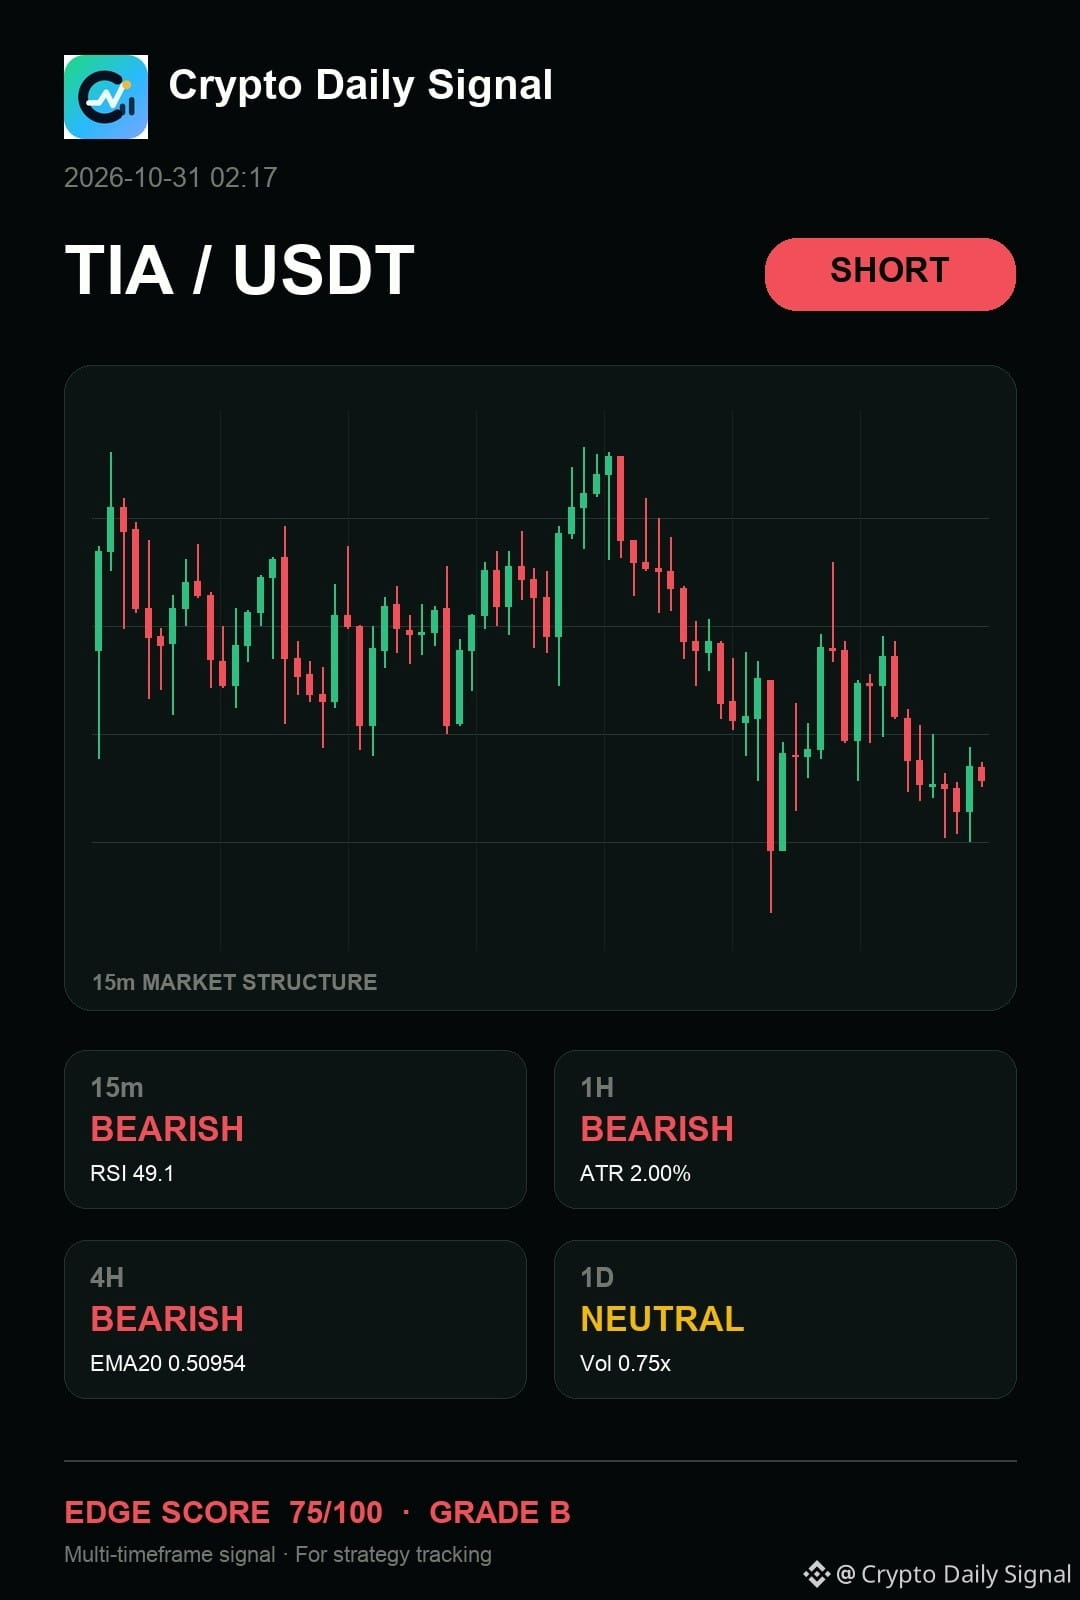
$TIA — right now, I would say it still offers the cleaner bearish argument, even if some might see bounces coming from recent support areas. The price is currently sticking to a clear descending line, and the short-term movements are showing lower highs. It seems this bearish momentum continues to hold its weight because of the consistent price placement below that major line.
I only want the planned reaction; anything else is a pass.
TIAUSDT SHORT map
Entry → 0.4521 - 0.4543
SL → 0.4584
TP → 0.4480 · 0.4439 · 0.4387
#TradingSignal
{future}(TIAUSDT)
$TIA — right now, I would say it still offers the cleaner bearish argument, even if some might see bounces coming from recent support areas. The price is currently sticking to a clear descending line, and the short-term movements are showing lower highs. It seems this bearish momentum continues to hold its weight because of the consistent price placement below that major line.
I only want the planned reaction; anything else is a pass.
TIAUSDT SHORT map
Entry → 0.4521 - 0.4543
SL → 0.4584
TP → 0.4480 · 0.4439 · 0.4387
#TradingSignal
I only want the planned reaction; anything else is a pass.
TIAUSDT SHORT map
Entry → 0.4521 - 0.4543
SL → 0.4584
TP → 0.4480 · 0.4439 · 0.4387
#TradingSignal
17
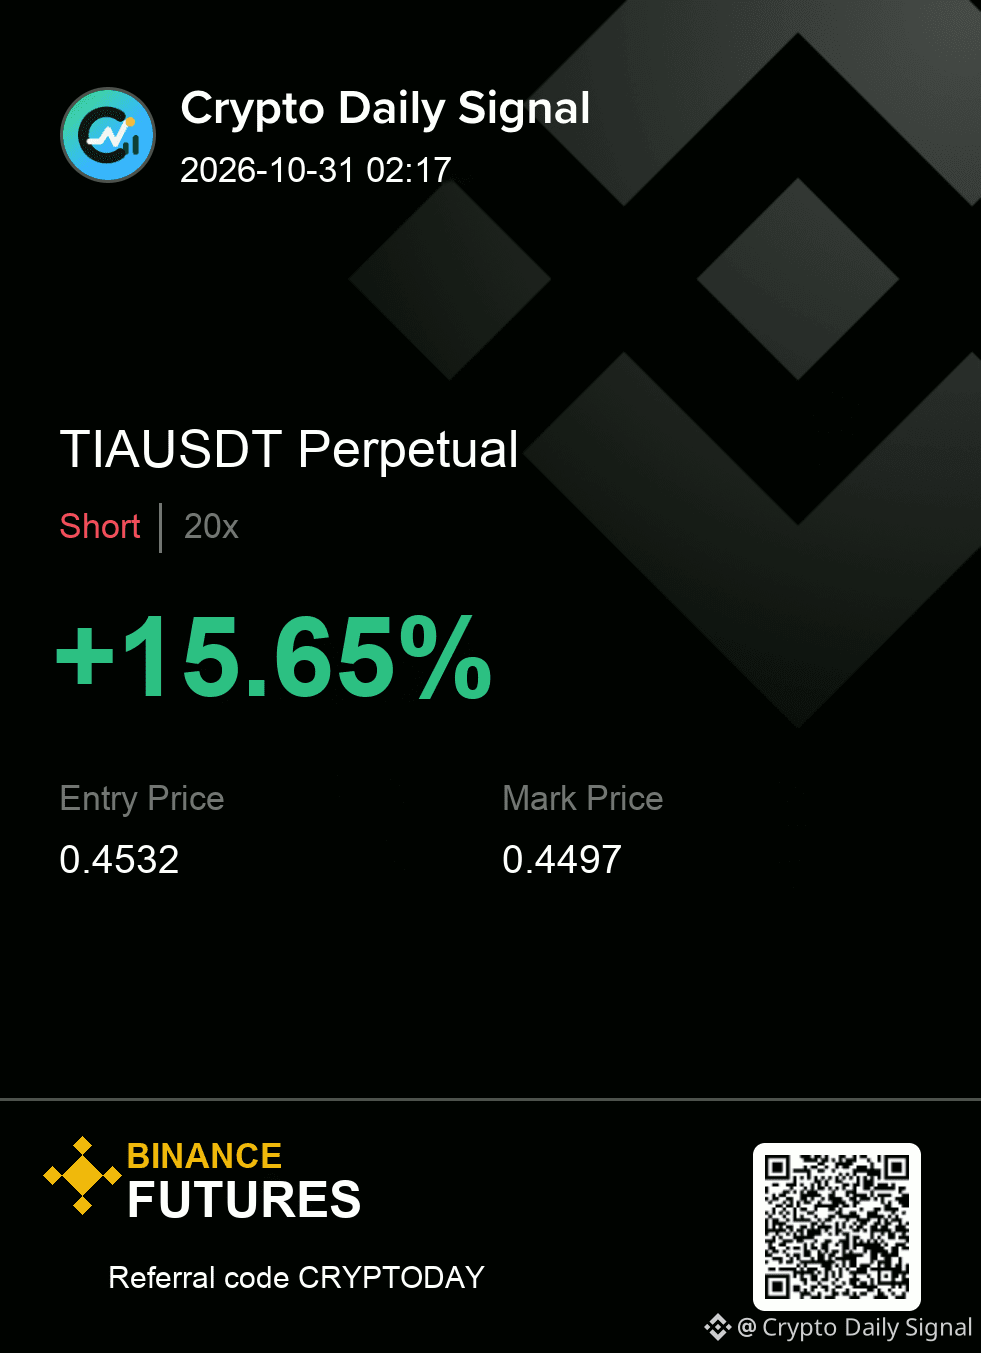
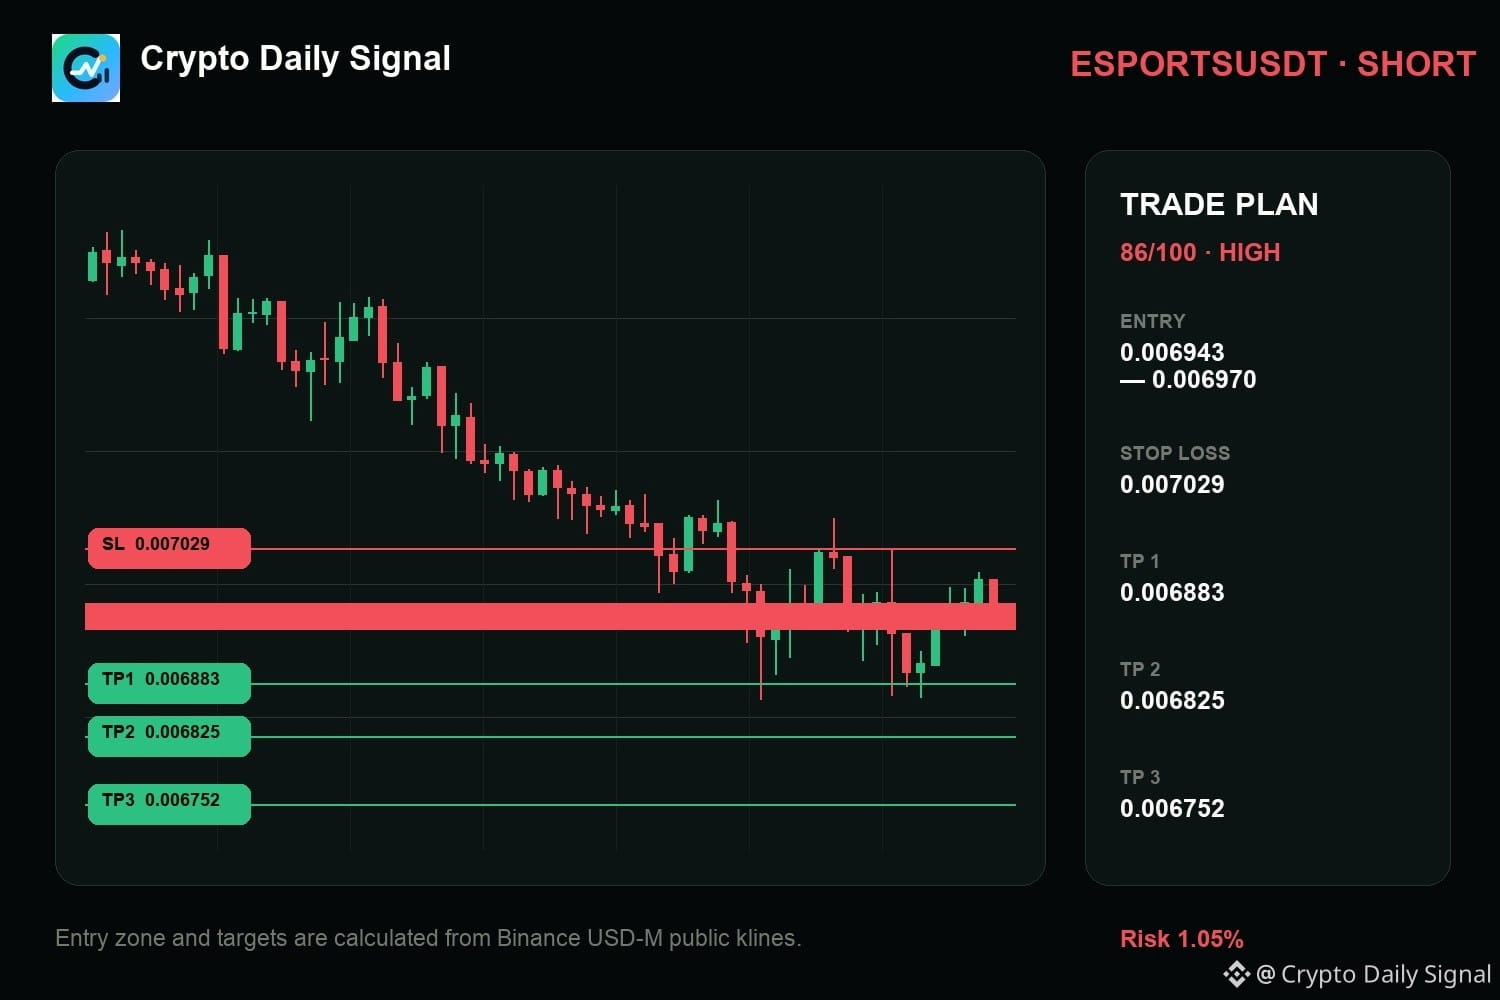
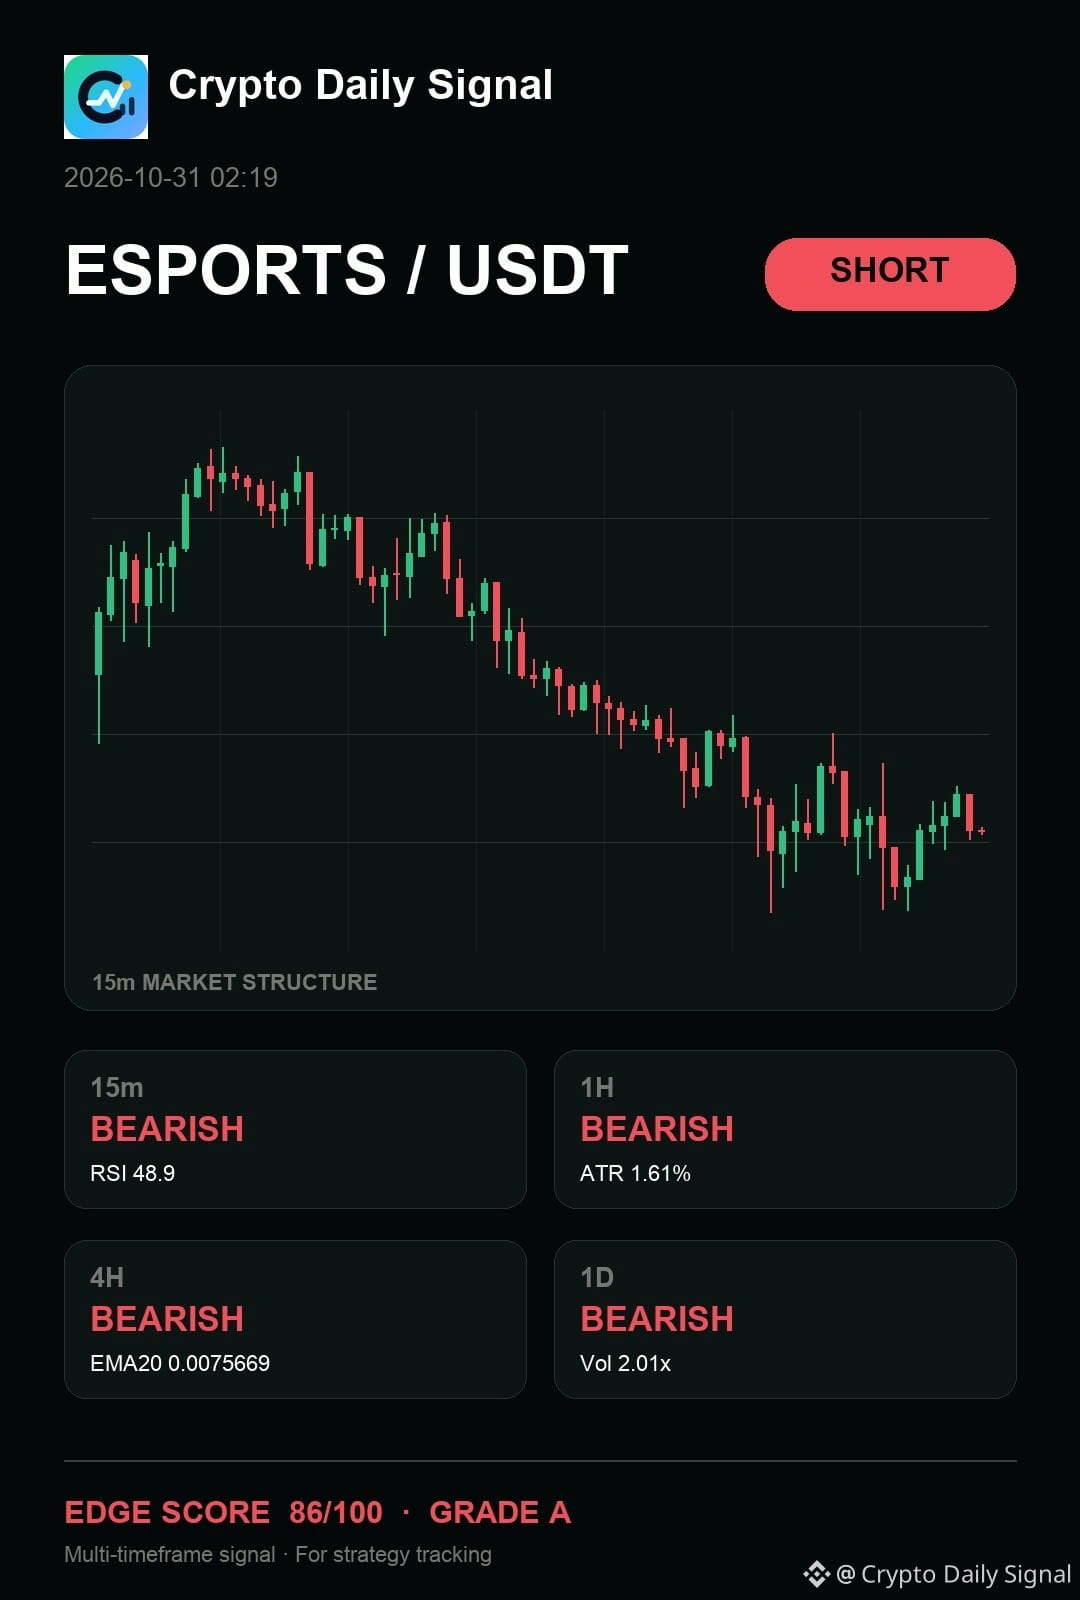
$ESPORTS — tbh, I keep coming back to how it keeps me focused on the downside response because the recent candles are forming lower highs and lower lows, while multiple timeframes confirm a downward bias. The current candle shows a clear rejection near the range floor, which is what we've been watching for. For this to become a proper short, we need a close below that low, but a strong move above the recent high would just cancel this out.
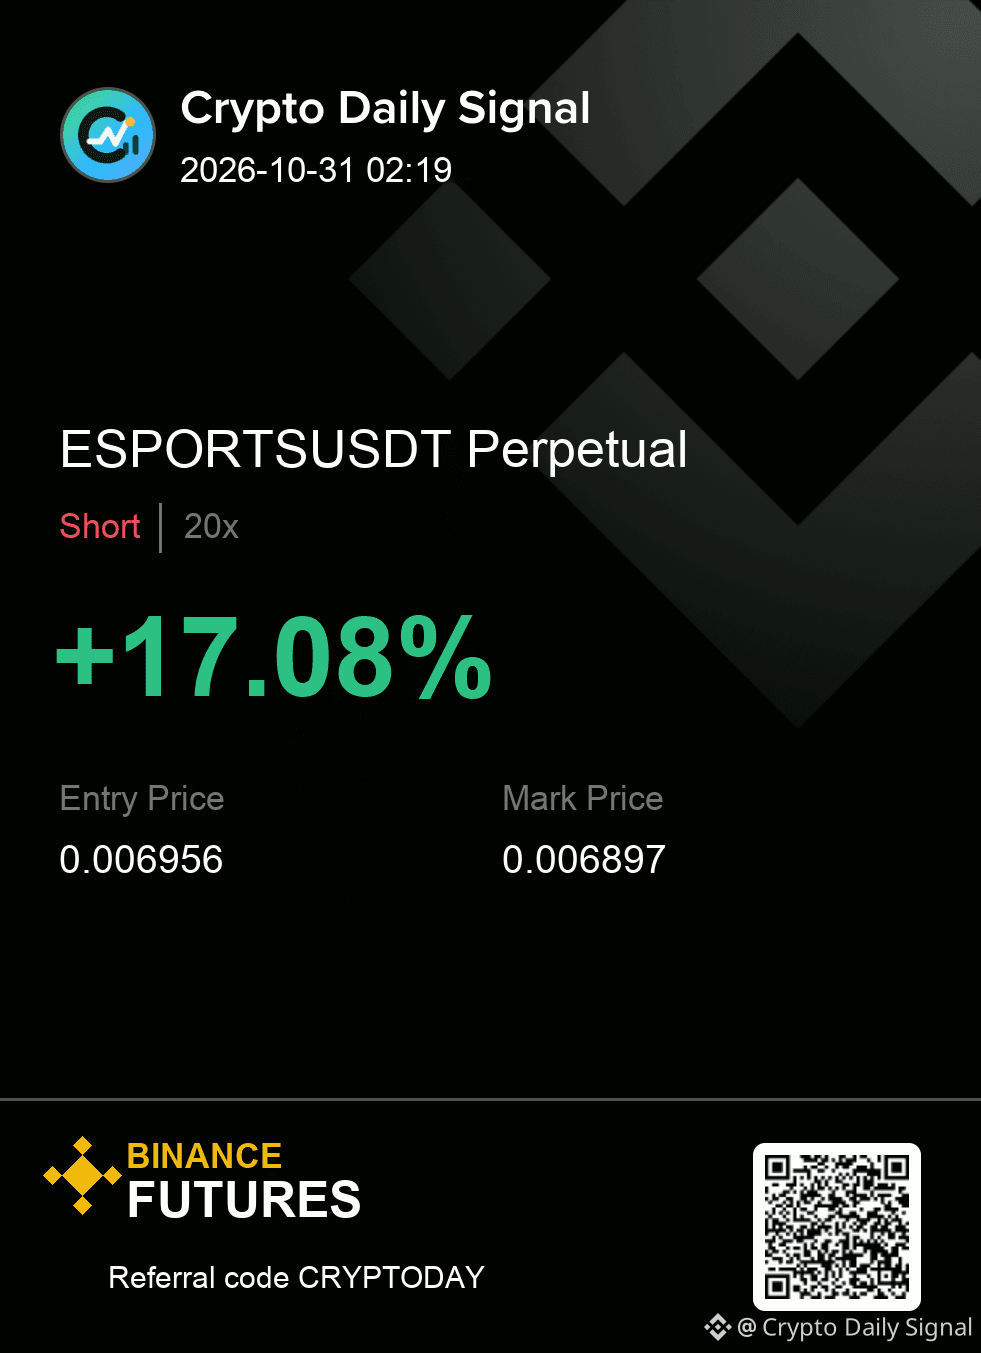
ESPORTSUSDT SHORT
IN 0.006943 - 0.006970
OUT 0.007029
TP 0.006883 · 0.006825 · 0.006752
Confirmation first or early entry — which side of that trade-off are you on?
#TradingSignal
{future}(ESPORTSUSDT)
$ESPORTS — tbh, I keep coming back to how it keeps me focused on the downside response because the recent candles are forming lower highs and lower lows, while multiple timeframes confirm a downward bias. The current candle shows a clear rejection near the range floor, which is what we've been watching for. For this to become a proper short, we need a close below that low, but a strong move above the recent high would just cancel this out.
ESPORTSUSDT SHORT
IN 0.006943 - 0.006970
OUT 0.007029
TP 0.006883 · 0.006825 · 0.006752
Confirmation first or early entry — which side of that trade-off are you on?
#TradingSignal
ESPORTSUSDT SHORT
IN 0.006943 - 0.006970
OUT 0.007029
TP 0.006883 · 0.006825 · 0.006752
Confirmation first or early entry — which side of that trade-off are you on?
#TradingSignal
11
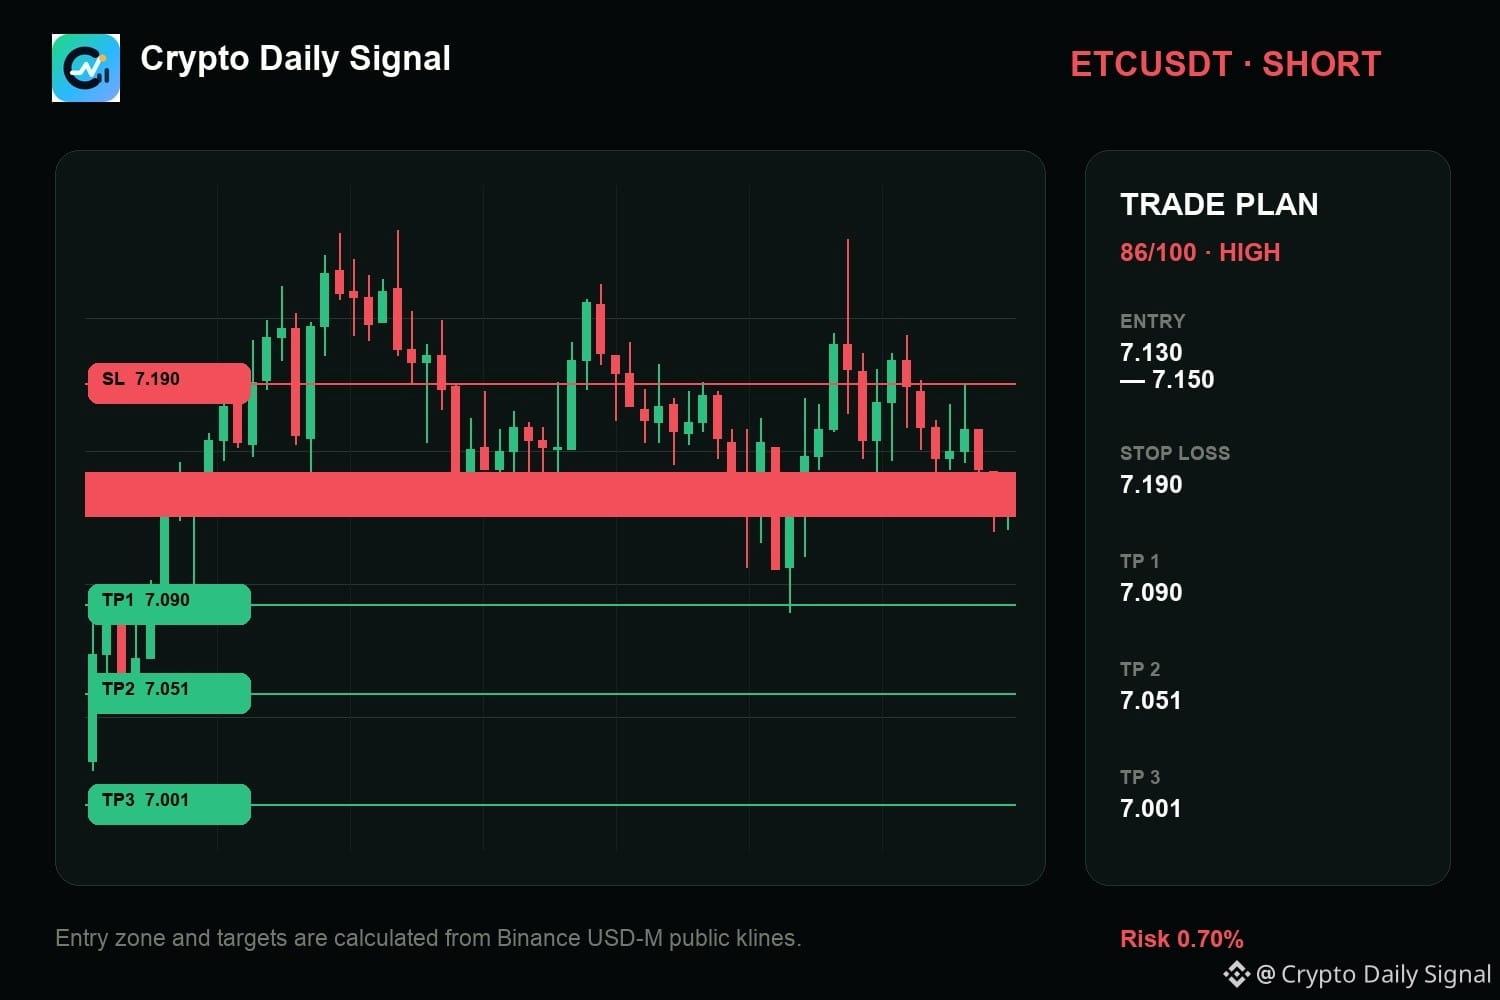
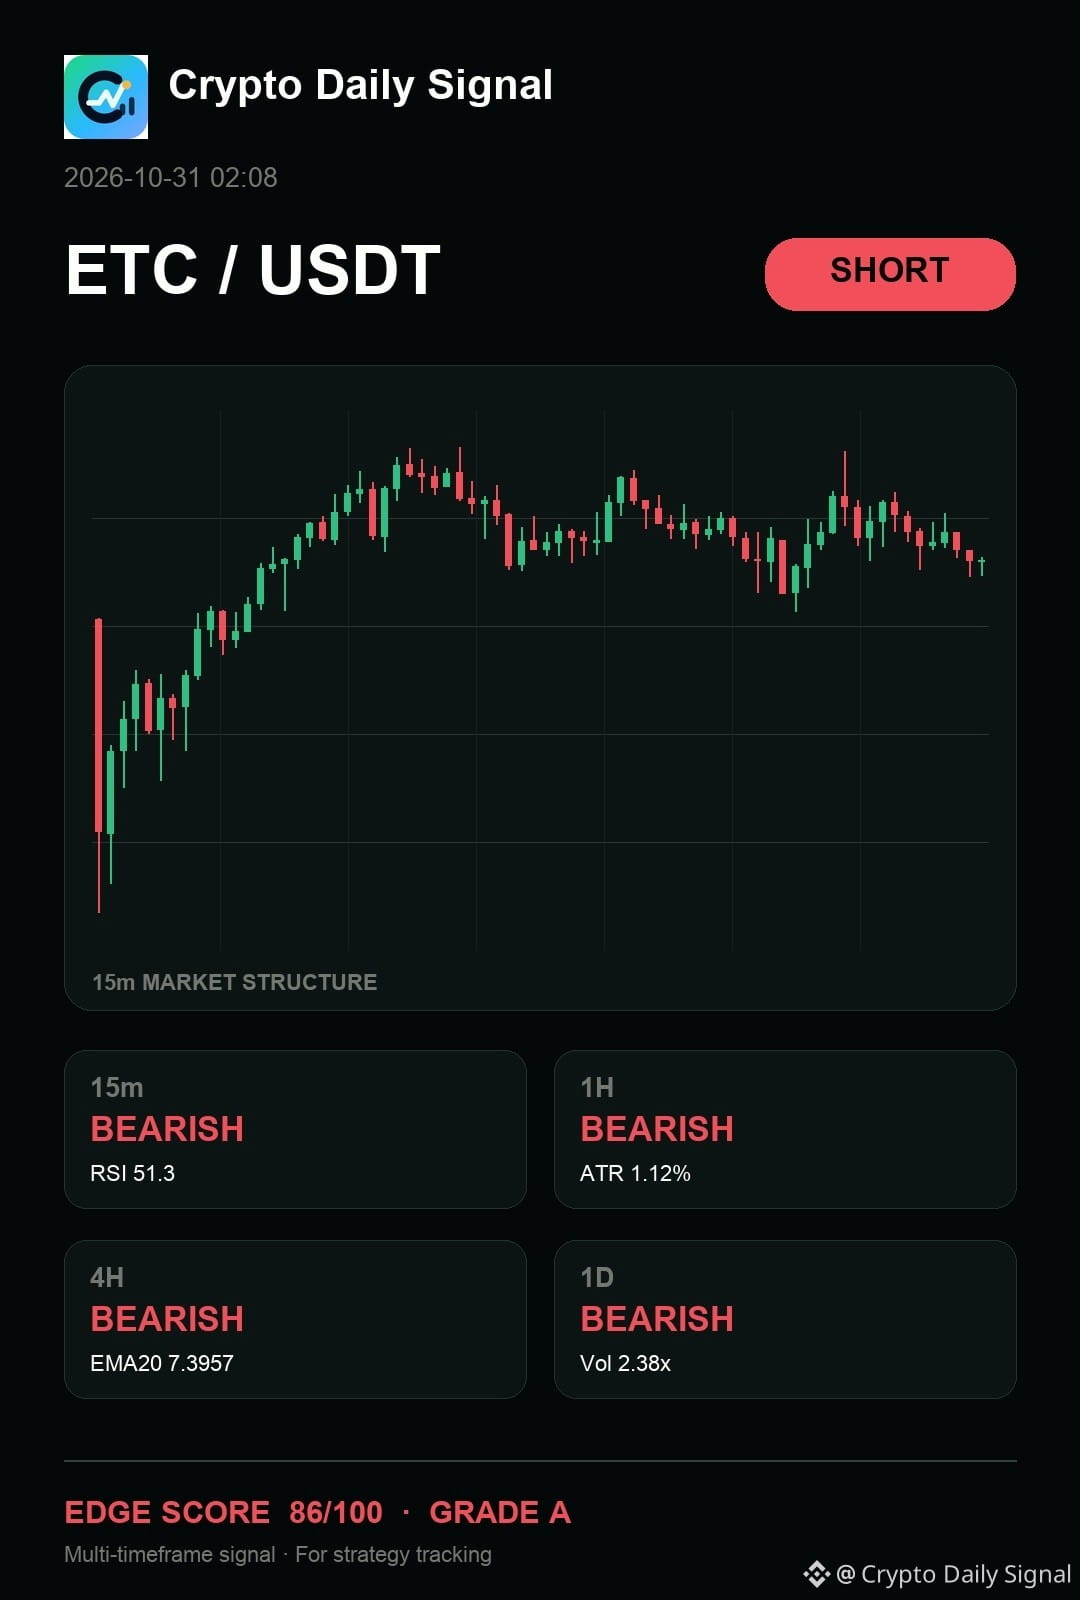
$ETC — my two cents, I am reading it like it remains a short idea for me. The daily picture is bearish and the four-hour structure is bearish. I want the entry zone to hold before committing; a clean break through the risk line kills the idea. No need to chase the first candle.
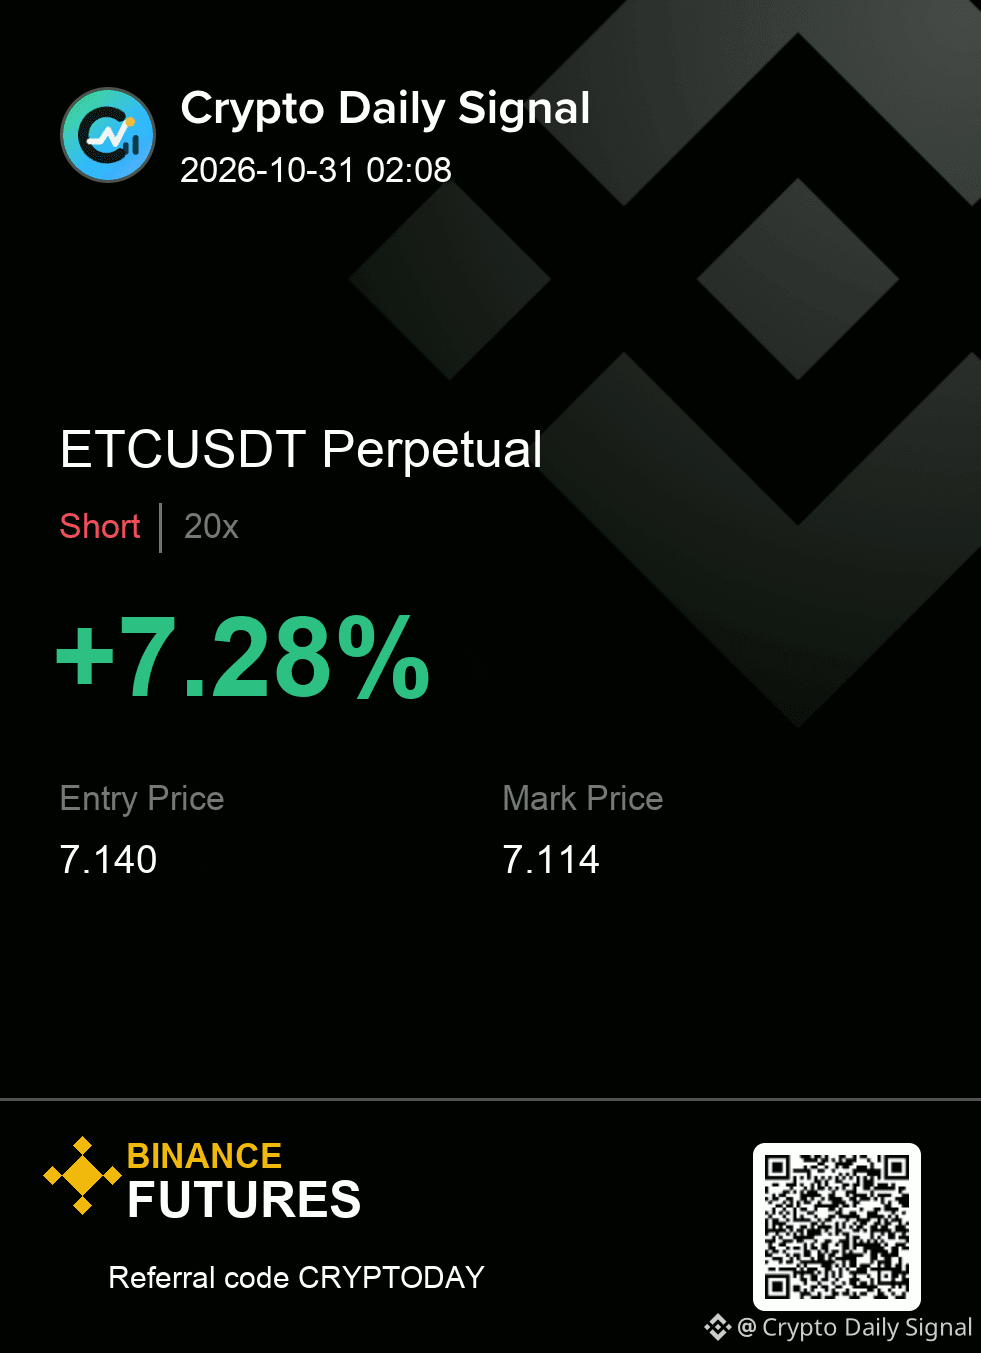
ETCUSDT SHORT
IN 7.130 - 7.150
OUT 7.190
TP 7.090 · 7.051 · 7.001
#TradingSignal
{future}(ETCUSDT)
$ETC — my two cents, I am reading it like it remains a short idea for me. The daily picture is bearish and the four-hour structure is bearish. I want the entry zone to hold before committing; a clean break through the risk line kills the idea. No need to chase the first candle.
ETCUSDT SHORT
IN 7.130 - 7.150
OUT 7.190
TP 7.090 · 7.051 · 7.001
#TradingSignal
ETCUSDT SHORT
IN 7.130 - 7.150
OUT 7.190
TP 7.090 · 7.051 · 7.001
#TradingSignal
6
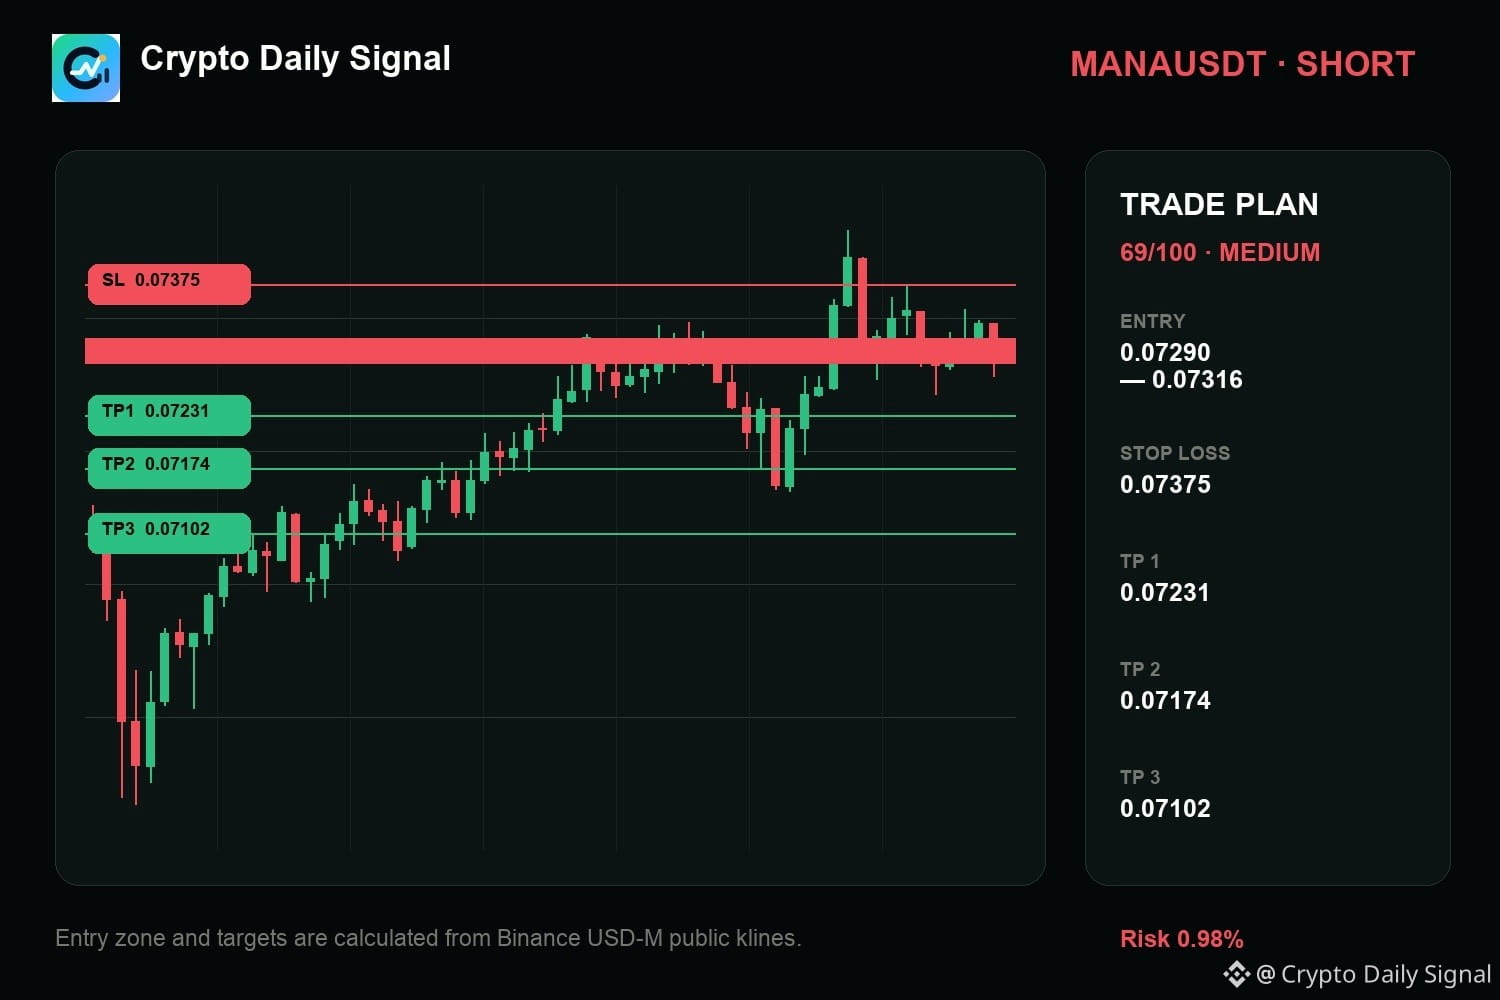
$MANA — honestly, the chart still says it keeps the bearish thesis active as the price gets stuck testing the top of its short-term range, especially given the broader bearish context on the higher timeframes. Chasing a move here is just noise; for this short setup to become concrete, we need to see a definitive close underneath the immediate short-term support.
MANAUSDT | SHORT
Entry 0.07290 - 0.07316
Invalidation 0.07375
Targets 0.07231 / 0.07174 / 0.07102
Clean enough to execute, or still too early for you?
#TradingSignal
{future}(MANAUSDT)
$MANA — honestly, the chart still says it keeps the bearish thesis active as the price gets stuck testing the top of its short-term range, especially given the broader bearish context on the higher timeframes. Chasing a move here is just noise; for this short setup to become concrete, we need to see a definitive close underneath the immediate short-term support.
MANAUSDT | SHORT
Entry 0.07290 - 0.07316
Invalidation 0.07375
Targets 0.07231 / 0.07174 / 0.07102
Clean enough to execute, or still too early for you?
#TradingSignal
MANAUSDT | SHORT
Entry 0.07290 - 0.07316
Invalidation 0.07375
Targets 0.07231 / 0.07174 / 0.07102
Clean enough to execute, or still too early for you?
#TradingSignal
7
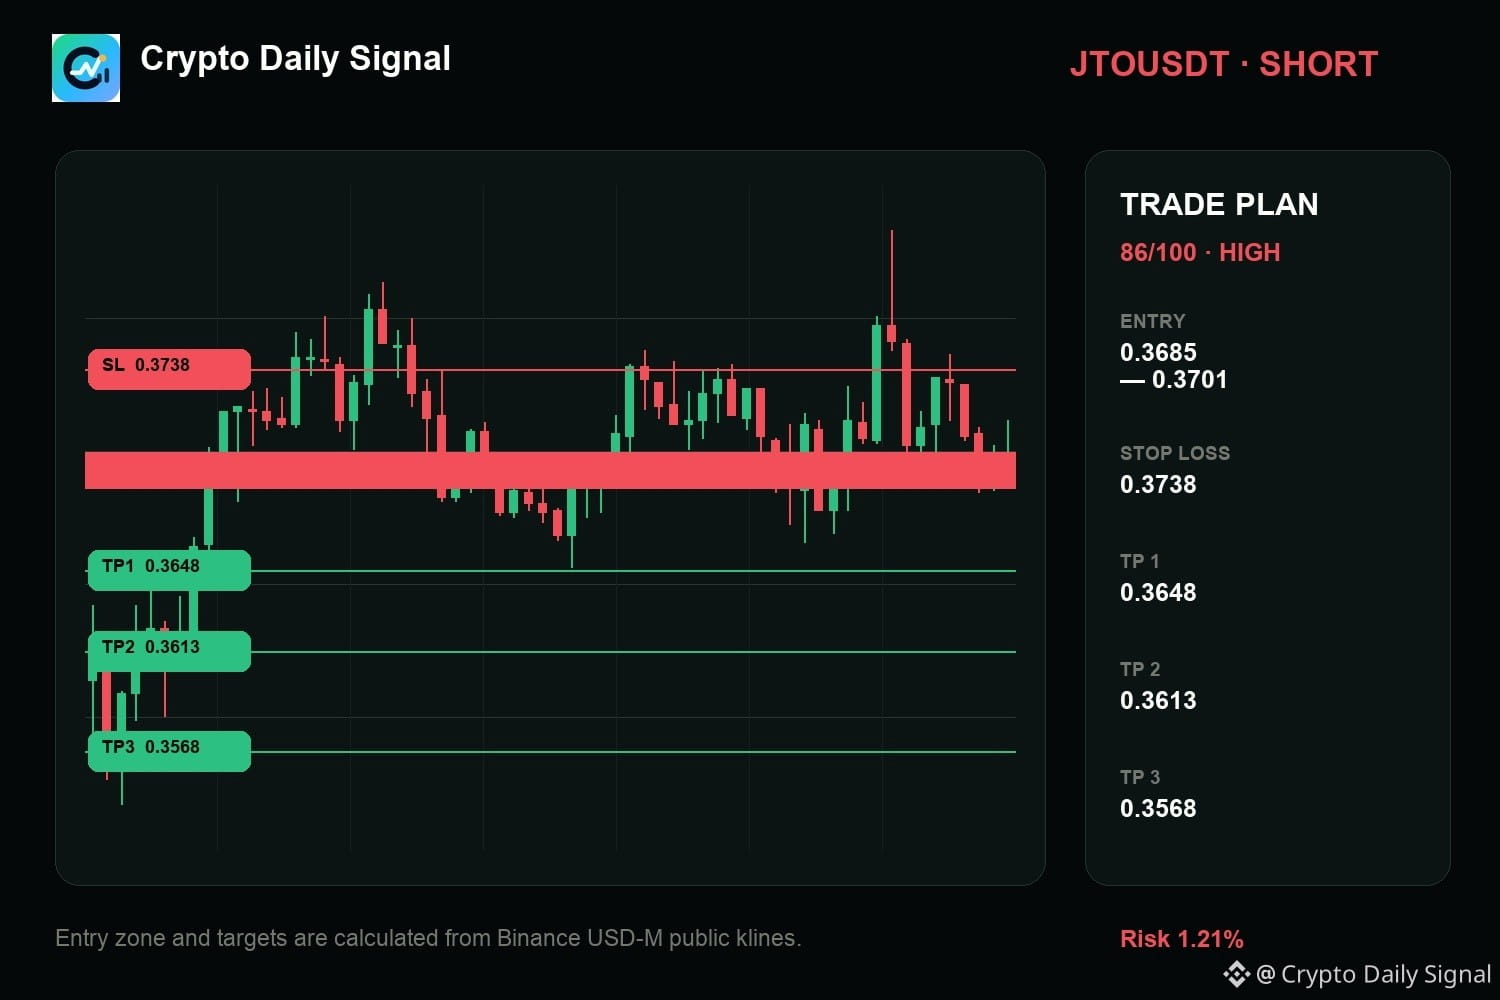
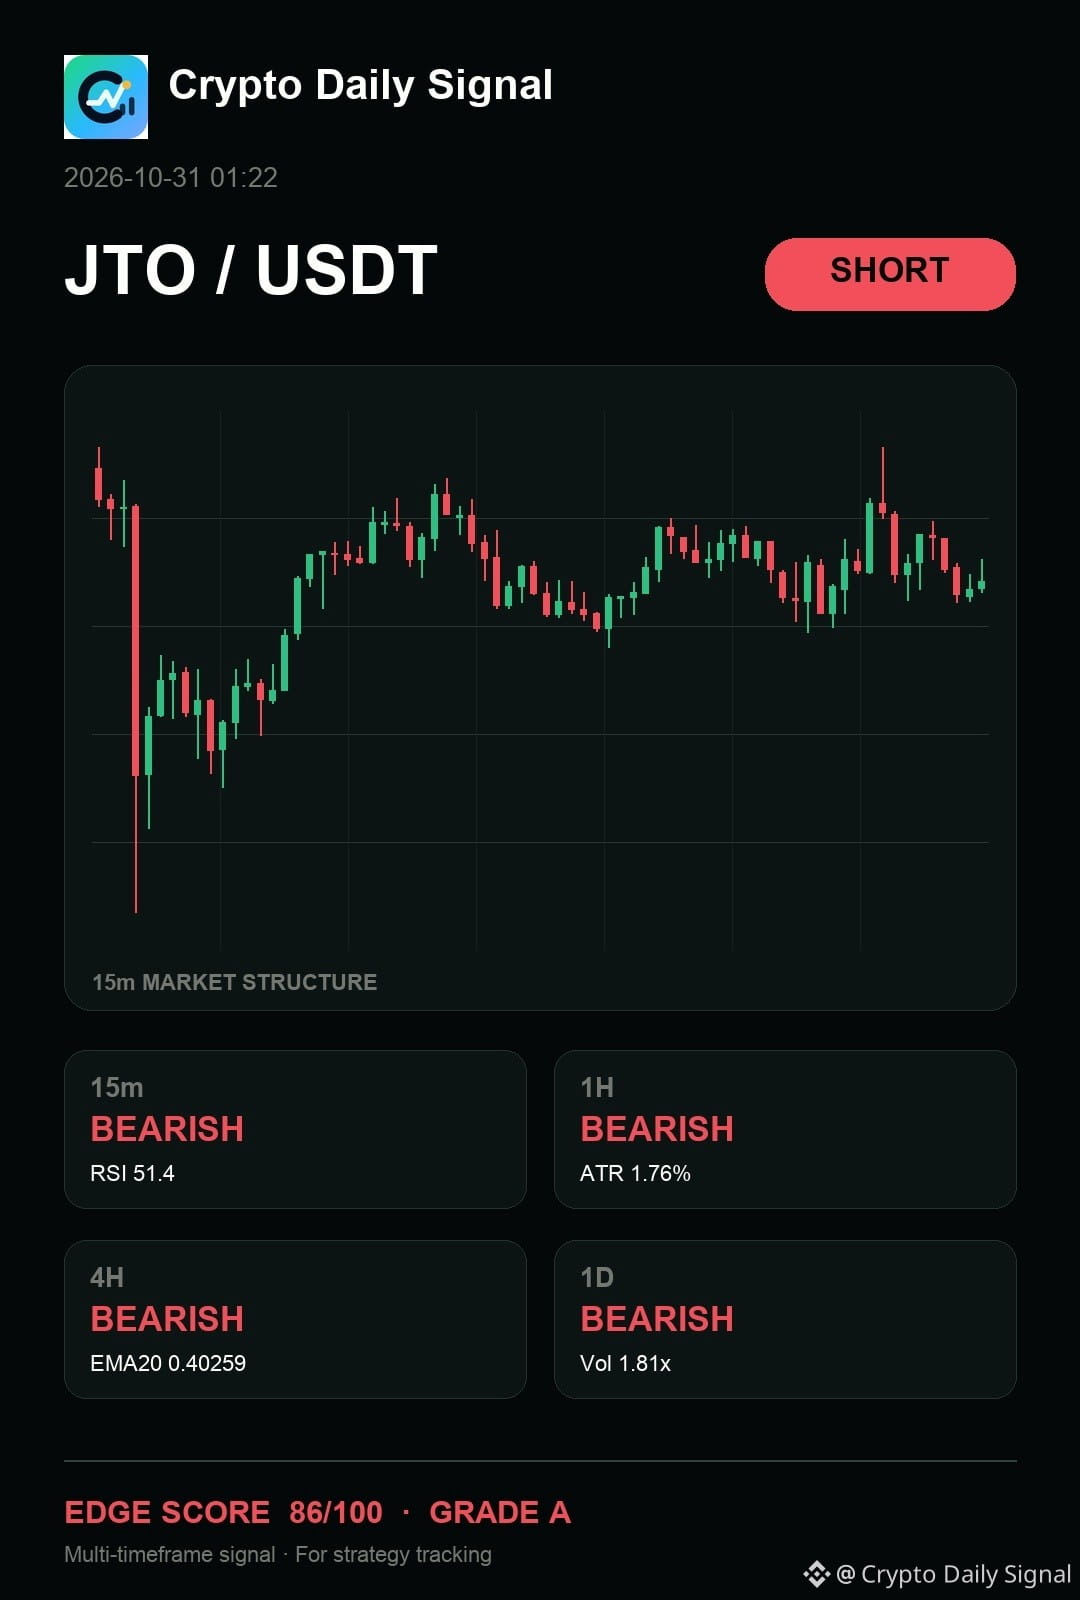
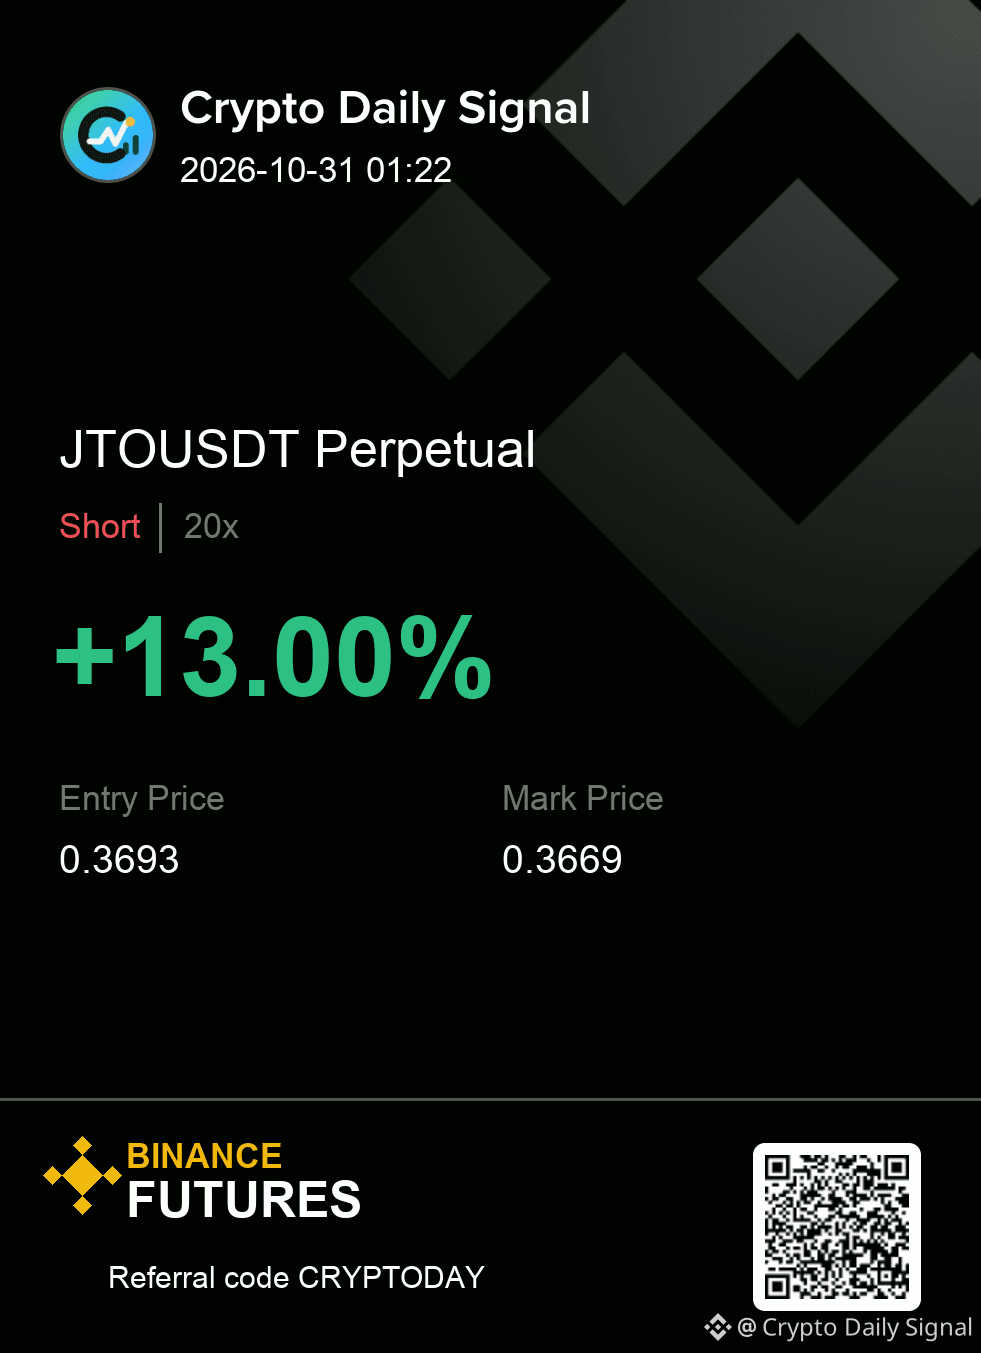
$JTO — right now, I would say it needs the sell-side reaction to confirm the bearish bias. Lower highs are showing up inside this tight range, and the short-term view is leaning down. A close below the recent low would signal the intended direction.
Execution is simple here: respect the zone and respect the cut.
Levels — JTOUSDT
Zone: 0.3685 - 0.3701
Cut: 0.3738
Scale: 0.3648 | 0.3613 | 0.3568
#TradingSignal
{future}(JTOUSDT)
$JTO — right now, I would say it needs the sell-side reaction to confirm the bearish bias. Lower highs are showing up inside this tight range, and the short-term view is leaning down. A close below the recent low would signal the intended direction.
Execution is simple here: respect the zone and respect the cut.
Levels — JTOUSDT
Zone: 0.3685 - 0.3701
Cut: 0.3738
Scale: 0.3648 | 0.3613 | 0.3568
#TradingSignal
Execution is simple here: respect the zone and respect the cut.
Levels — JTOUSDT
Zone: 0.3685 - 0.3701
Cut: 0.3738
Scale: 0.3648 | 0.3613 | 0.3568
#TradingSignal
4

·
--
Рост
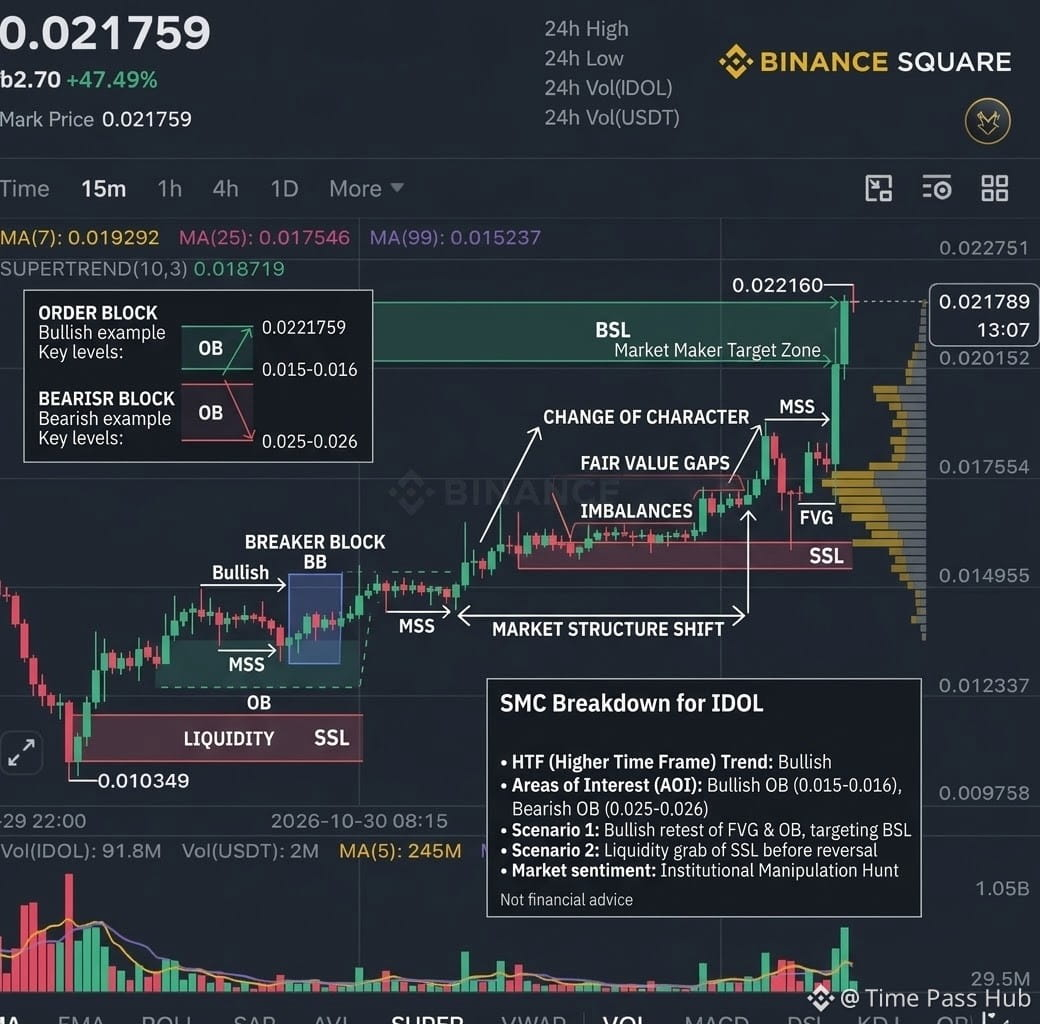
Here is a Binance Square post tailored for $IDOL /USDT:
🚀 $IDOL / USDT Bullish Breakout & Momentum Alert! 💥
has delivered a massive +47.49% surge today, climbing from a 24h low of $0.010349 to hit a high of $0.022160! 📈
📊 Technical Overview (15M Chart):
* Price: $0.021759
* Supertrend (10,3): Strong Bullish signal active at $0.018719.
* Moving Averages:
* MA(7): $0.019292 (Immediate Dynamic Support)
* MA(25): $0.017546
* MA(99): $0.015237
* 24h Volume: 16.44B IDOL (~$239.19M USDT) indicating intense trading interest.
🎯 Key Levels to Watch:
* 🔴 Resistance / Target: $0.022160 – A breakout above this level could push the price toward the $0.022750+ zone.
* 🟢 Support Zone: $0.019200 – $0.018700 (MA7 & SuperTrend Level).
⚠️ Trading Strategy: The sharp parabolic run indicates high momentum, but short-term pullbacks toward the 7 MA are common. Always manage risk with proper stop-loss placement!
What’s your target for $IDOL? Let me know below! 👇👇
#IDOL #Crypto #BinanceSquare #TechnicalAnalysis #TradingSignal
$IDOL
{future}(IDOLUSDT)
Here is a Binance Square post tailored for $IDOL /USDT:
🚀 $IDOL / USDT Bullish Breakout & Momentum Alert! 💥
has delivered a massive +47.49% surge today, climbing from a 24h low of $0.010349 to hit a high of $0.022160! 📈
📊 Technical Overview (15M Chart):
* Price: $0.021759
* Supertrend (10,3): Strong Bullish signal active at $0.018719.
* Moving Averages:
* MA(7): $0.019292 (Immediate Dynamic Support)
* MA(25): $0.017546
* MA(99): $0.015237
* 24h Volume: 16.44B IDOL (~$239.19M USDT) indicating intense trading interest.
🎯 Key Levels to Watch:
* 🔴 Resistance / Target: $0.022160 – A breakout above this level could push the price toward the $0.022750+ zone.
* 🟢 Support Zone: $0.019200 – $0.018700 (MA7 & SuperTrend Level).
⚠️ Trading Strategy: The sharp parabolic run indicates high momentum, but short-term pullbacks toward the 7 MA are common. Always manage risk with proper stop-loss placement!
What’s your target for $IDOL ? Let me know below! 👇👇
#IDOL #Crypto #BinanceSquare #TechnicalAnalysis #TradingSignal
$IDOL
Ingeborg Fleek W3MD:
ok
22
267
·
--
🔥 IDOL shows strong bullish breakout potential.
This is a trading setup based on validated signals, not a guaranteed result.
Entry: 0.018515 | SL: 0.018079 | TP1: 0.019168 | TP2: 0.019604
Volume spikes and momentum confirm the move. Will IDOL hit TP2?
#BinanceSquare
$IDOL #TradingSignal #CryptoAnalysis
This is a trading setup based on validated signals, not a guaranteed result.
Entry: 0.018515 | SL: 0.018079 | TP1: 0.019168 | TP2: 0.019604
Volume spikes and momentum confirm the move. Will IDOL hit TP2?
#BinanceSquare
$IDOL #TradingSignal #CryptoAnalysis

3
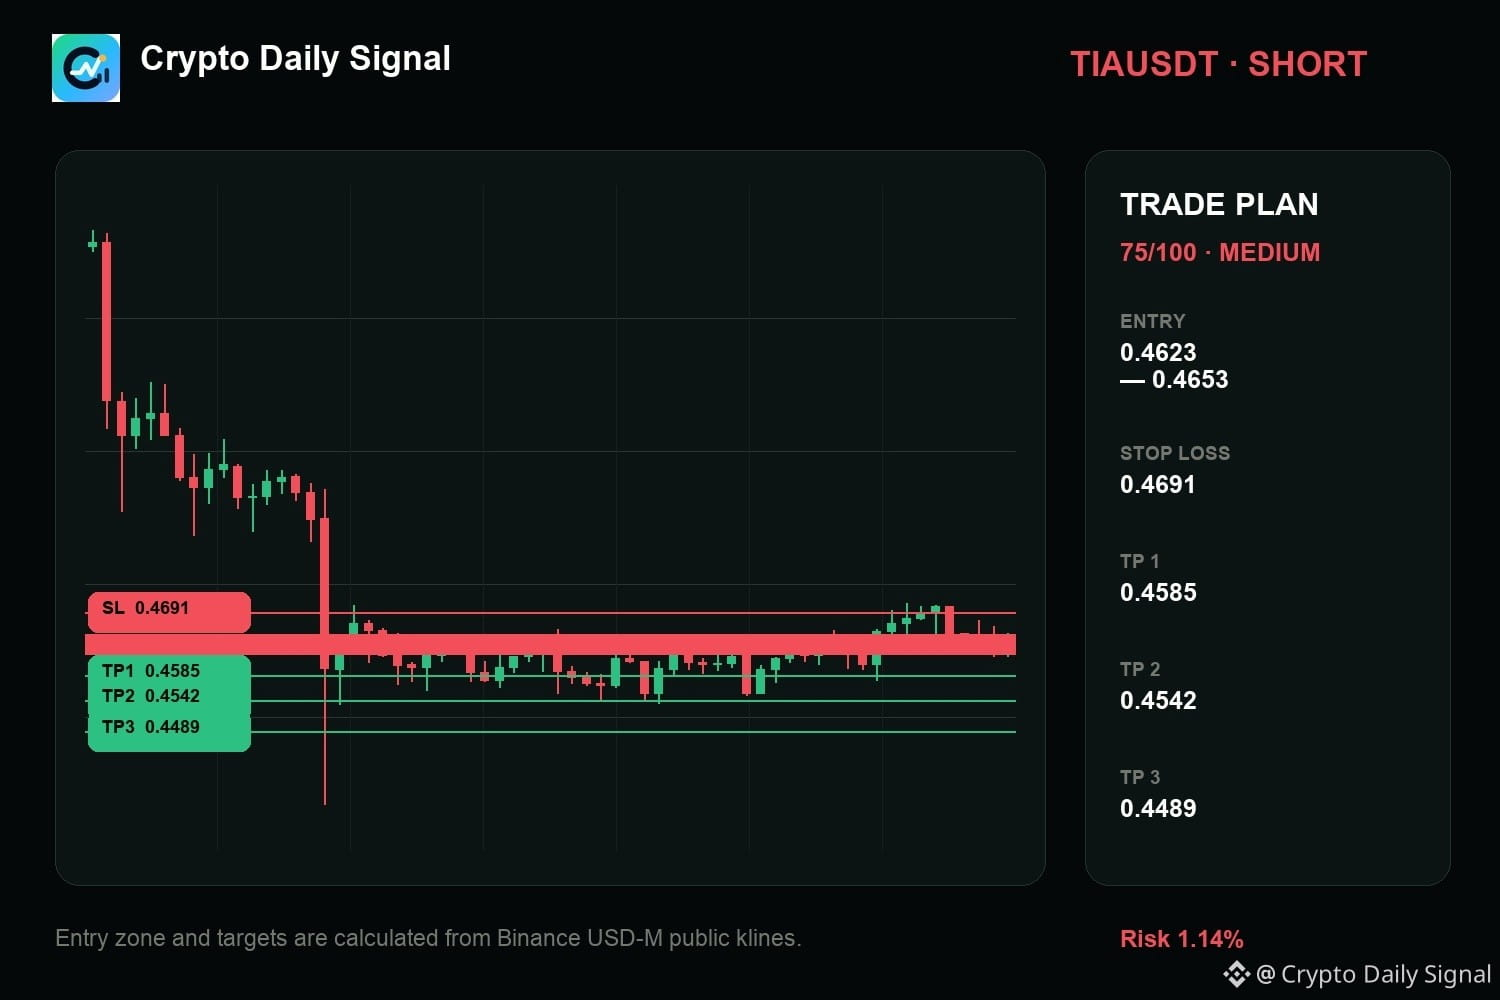
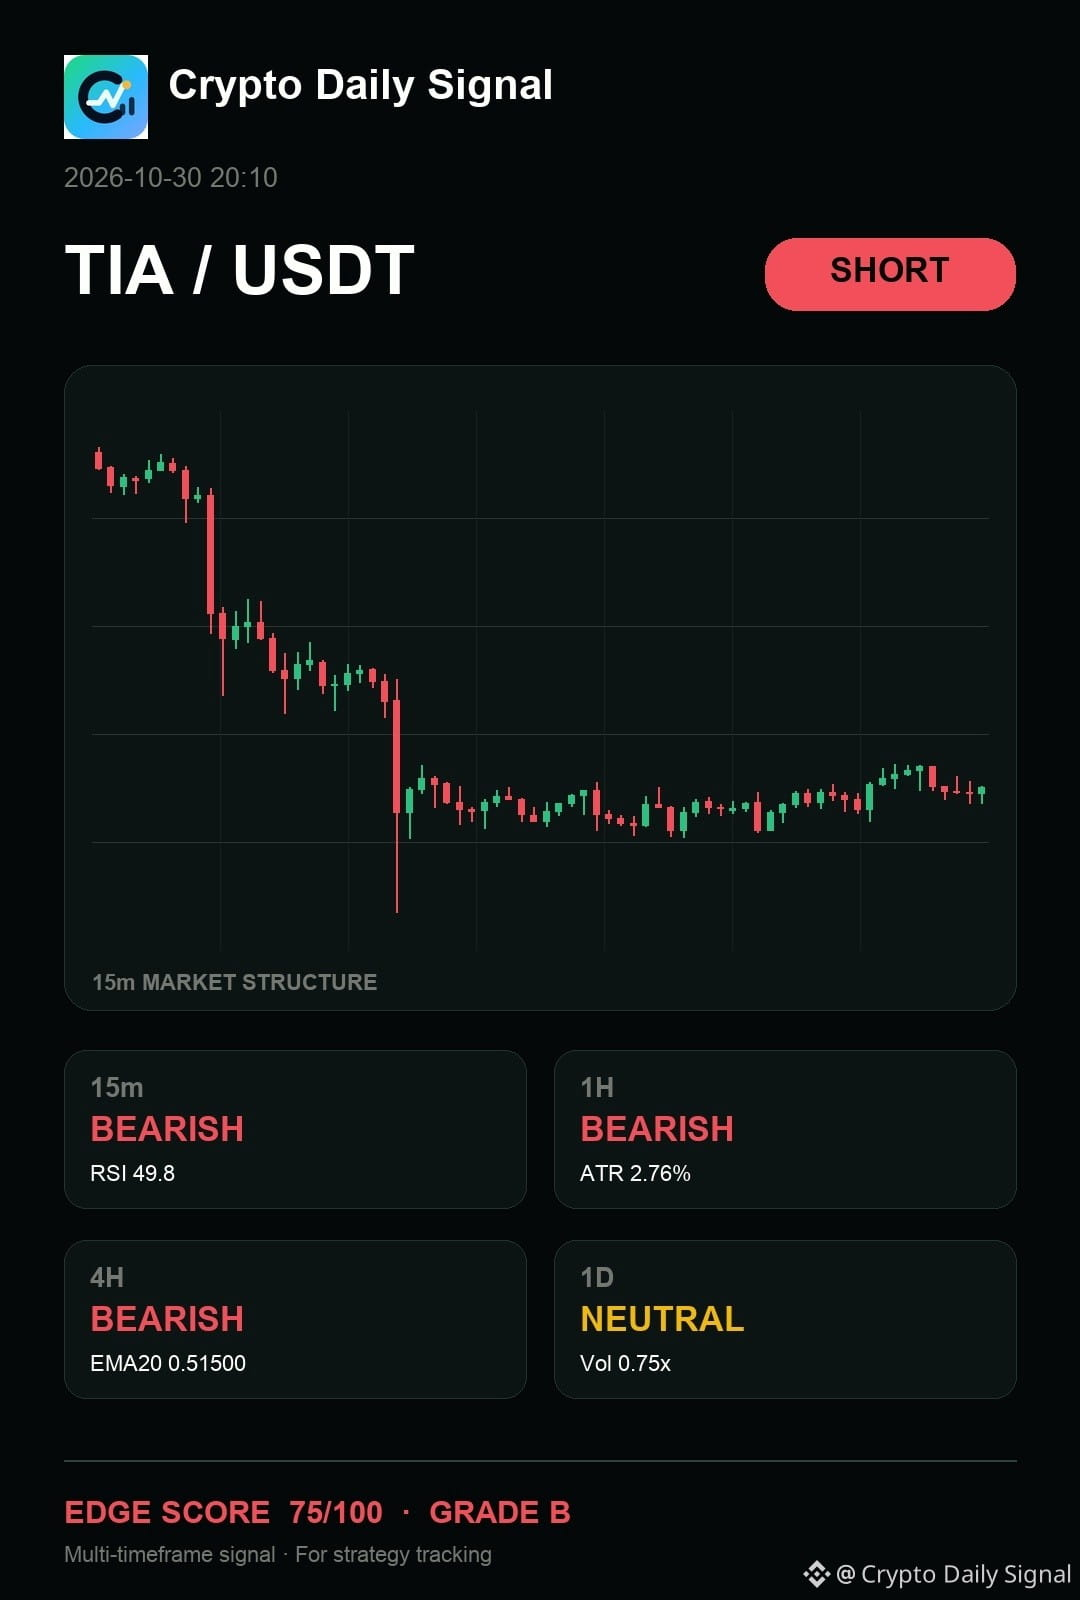
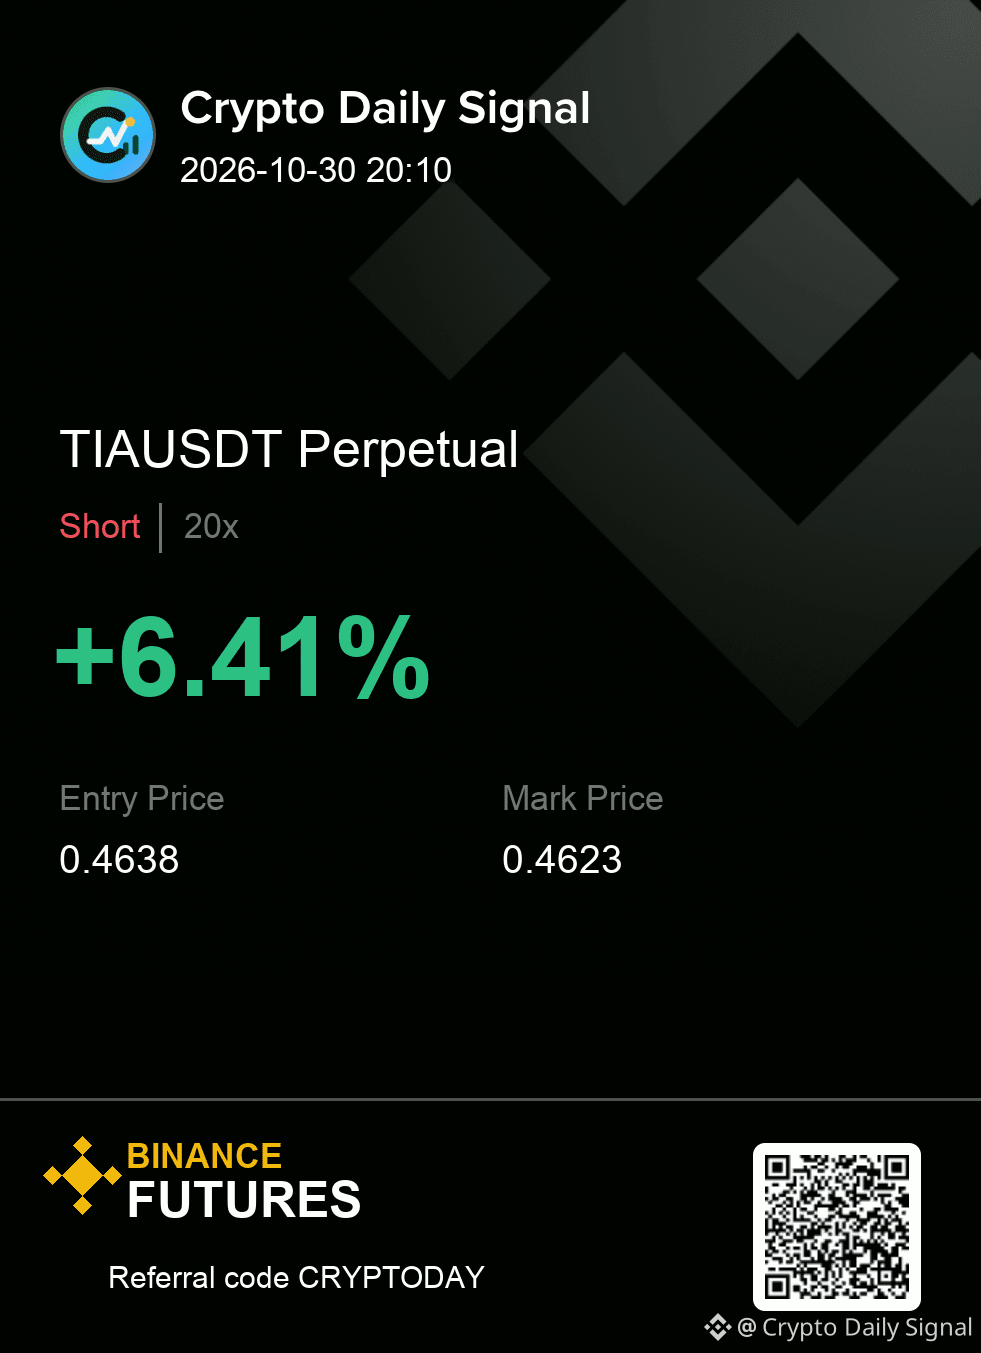
$TIA is still tilted toward sellers. Price is caught between resistance and a range floor, and the short-term bias remains down despite some mid-term chop. A decisive drop below that lower boundary would confirm the bearish setup.
Levels — TIAUSDT
Zone: 0.4623 - 0.4653
Cut: 0.4691
Scale: 0.4585 | 0.4542 | 0.4489
#TradingSignal
{future}(TIAUSDT)
$TIA is still tilted toward sellers. Price is caught between resistance and a range floor, and the short-term bias remains down despite some mid-term chop. A decisive drop below that lower boundary would confirm the bearish setup.
Levels — TIAUSDT
Zone: 0.4623 - 0.4653
Cut: 0.4691
Scale: 0.4585 | 0.4542 | 0.4489
#TradingSignal
Levels — TIAUSDT
Zone: 0.4623 - 0.4653
Cut: 0.4691
Scale: 0.4585 | 0.4542 | 0.4489
#TradingSignal
24

·
--
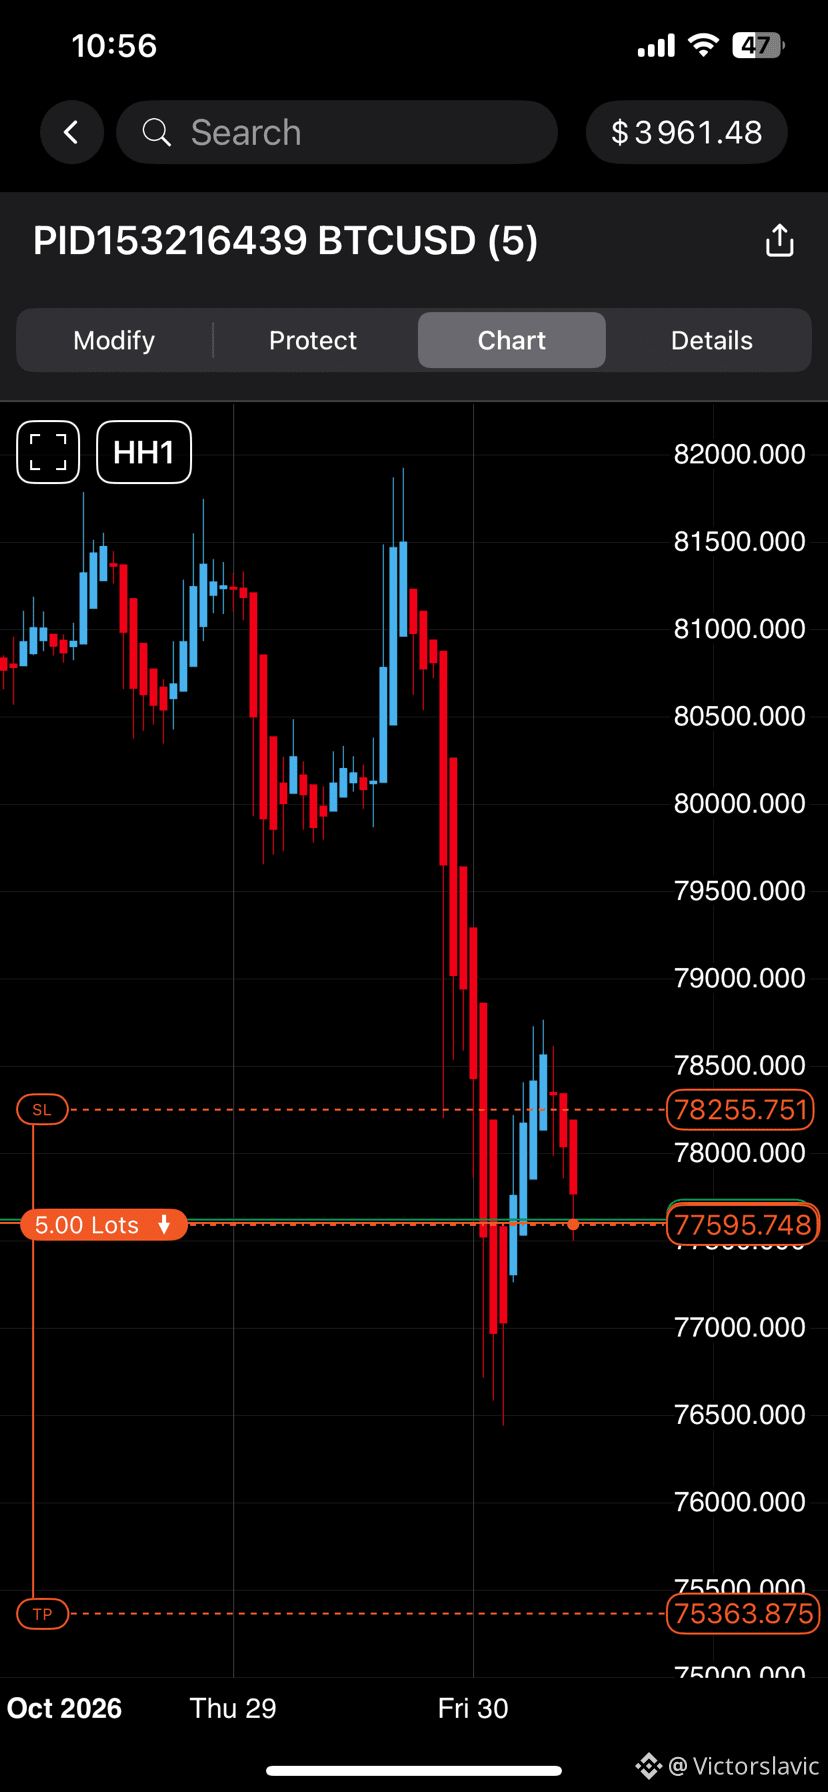
BTCUSD SHORT SIGNAL 📉
Entry: 77595.75
SL: 78255.75
TP: 75363.88
5.00 lots | 1H
Strong rejection + continuation lower. Risk managed.
#BTC #Bitcoin #TradingSignal
@Peacefulman @MissBlockChain_01
BTCUSD SHORT SIGNAL 📉
Entry: 77595.75 SL: 78255.75 TP: 75363.88
5.00 lots | 1H
Strong rejection + continuation lower. Risk managed.
#BTC #Bitcoin #TradingSignal
@DavidY2026 @MissBlockChain_01
Entry: 77595.75 SL: 78255.75 TP: 75363.88
5.00 lots | 1H
Strong rejection + continuation lower. Risk managed.
#BTC #Bitcoin #TradingSignal
@DavidY2026 @MissBlockChain_01
126
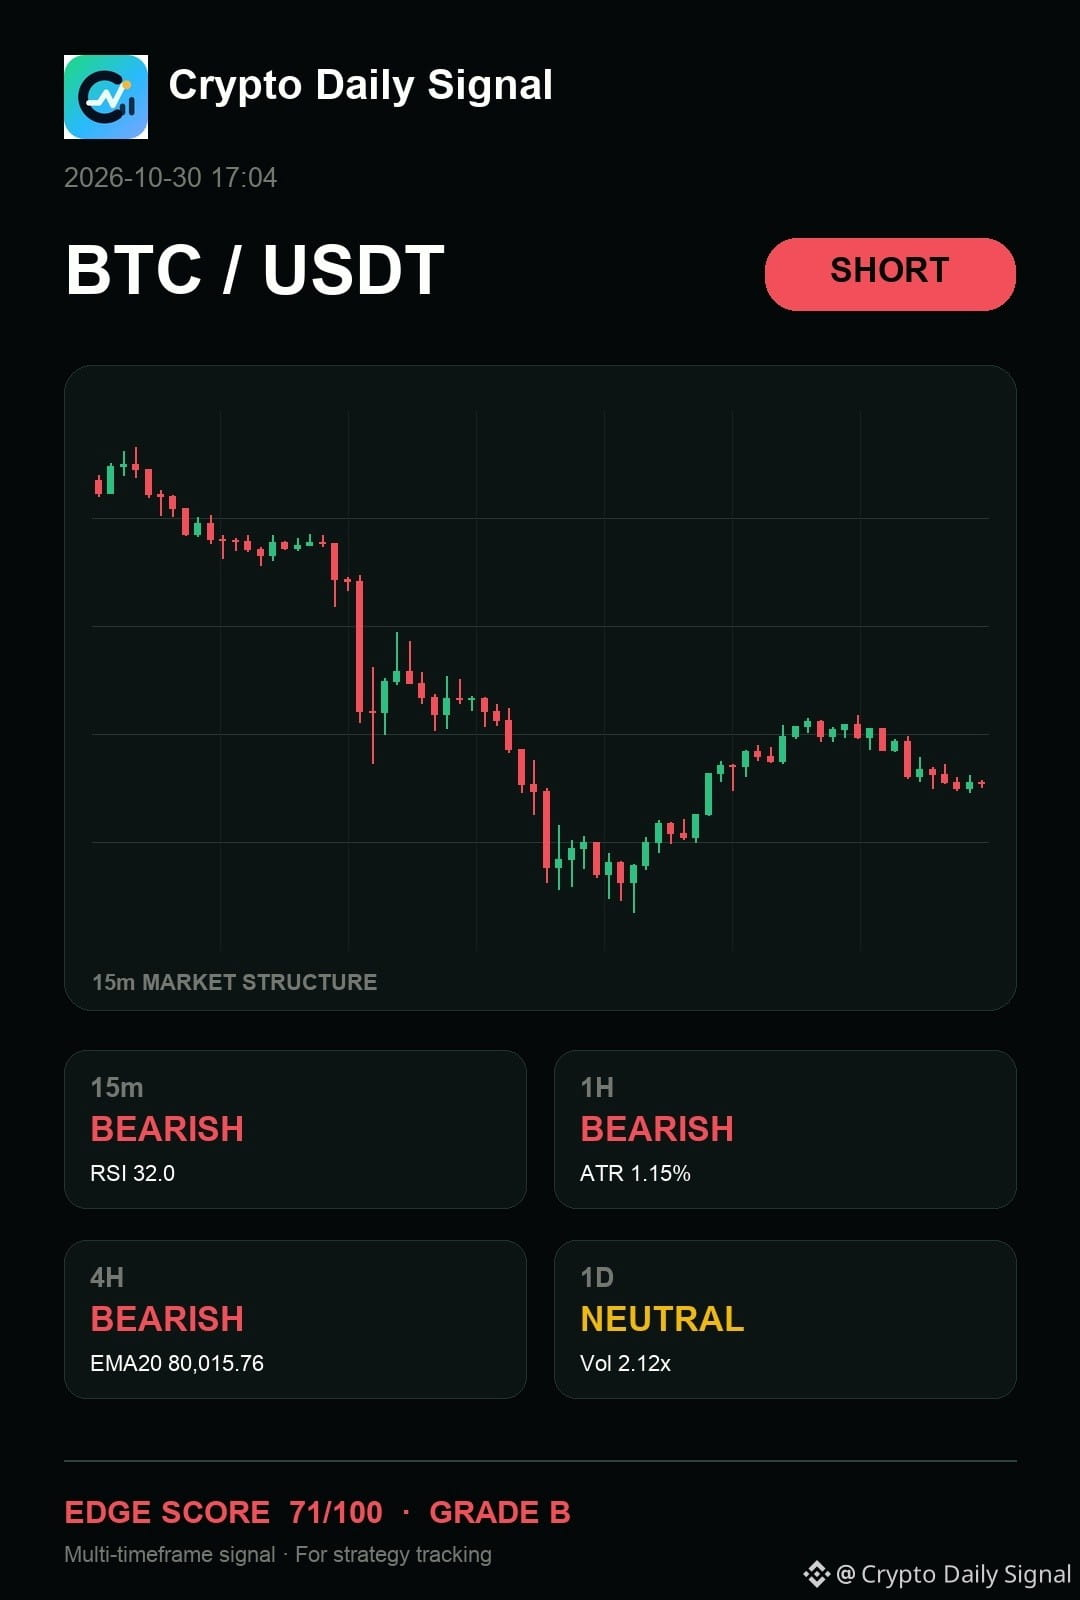
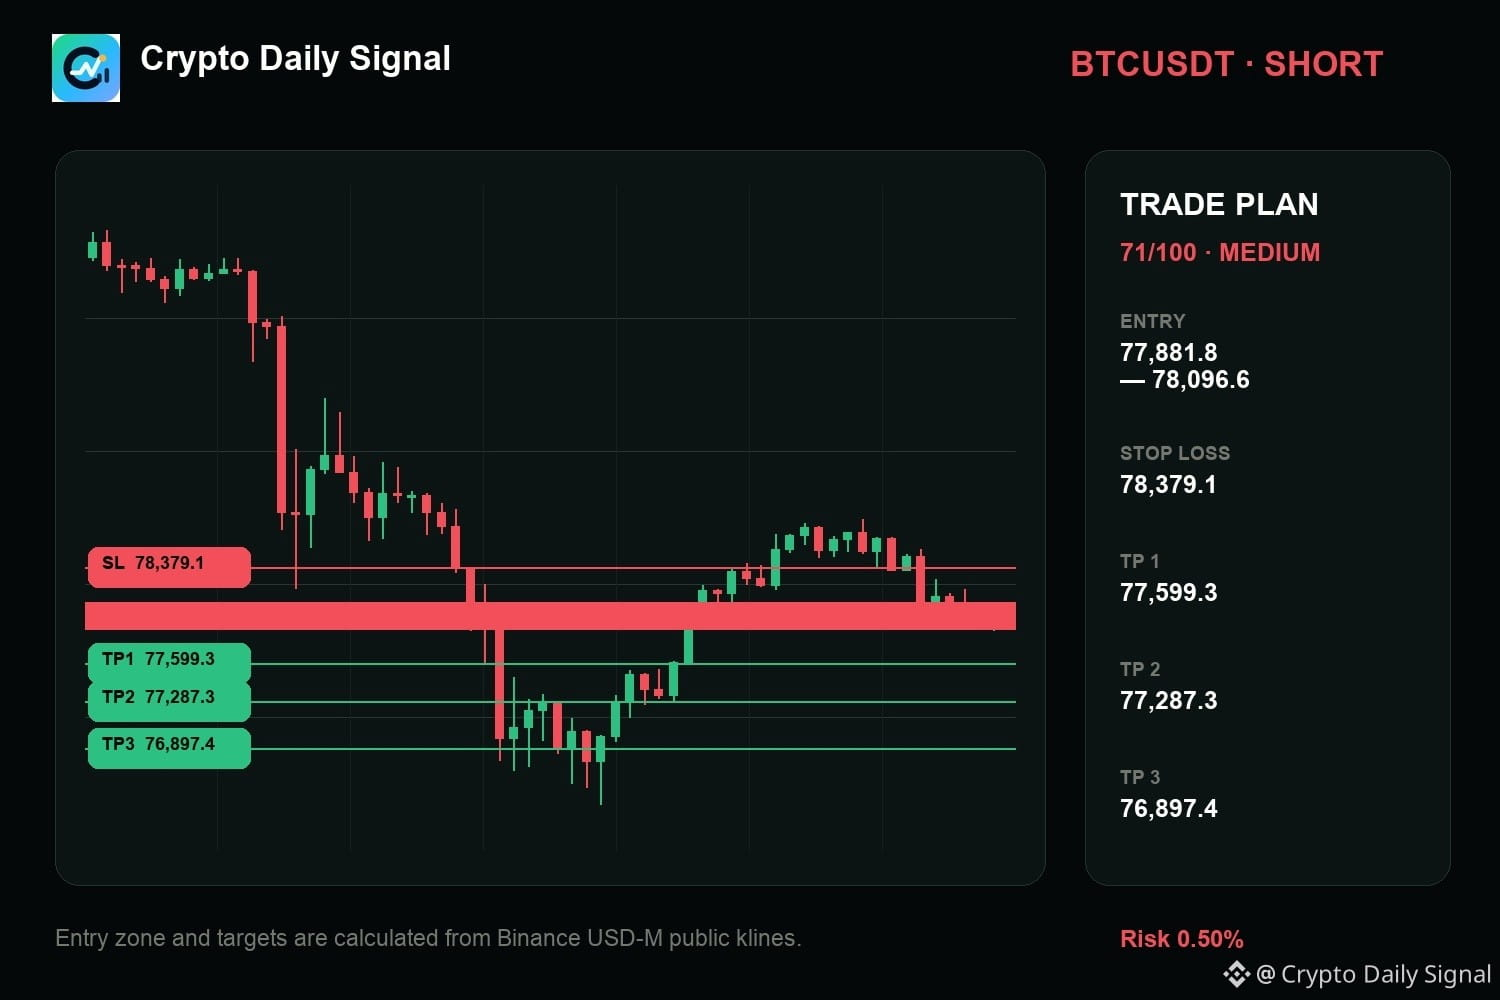
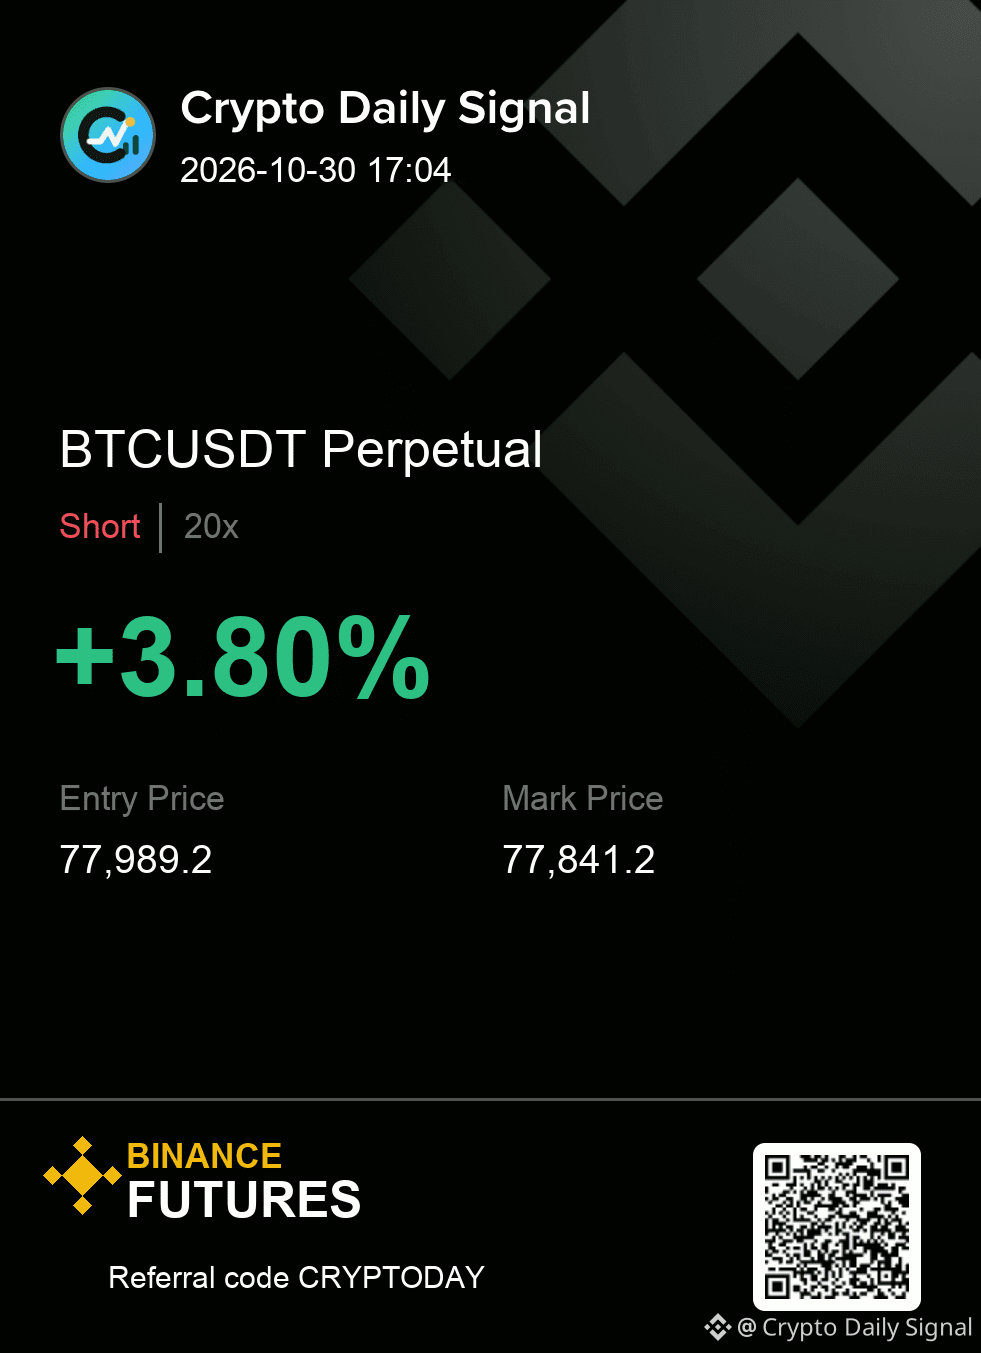
$BTC — quick take, I still think it has not invalidated the short case after that near-range rejection. While the daily picture is neutral, the short-term action is clearly under bearish control across the hourly and fifteen-minute views. If we see a decisive close below the recent short-term swing low, the setup strengthens significantly, but a strong close above the current range high would completely negate the thesis.
No chase outside the zone; the stop defines the whole idea.
BTCUSDT SHORT
IN 77,881.8 - 78,096.6
OUT 78,379.1
TP 77,599.3 · 77,287.3 · 76,897.4
#TradingSignal
{future}(BTCUSDT)
$BTC — quick take, I still think it has not invalidated the short case after that near-range rejection. While the daily picture is neutral, the short-term action is clearly under bearish control across the hourly and fifteen-minute views. If we see a decisive close below the recent short-term swing low, the setup strengthens significantly, but a strong close above the current range high would completely negate the thesis.
No chase outside the zone; the stop defines the whole idea.
BTCUSDT SHORT
IN 77,881.8 - 78,096.6
OUT 78,379.1
TP 77,599.3 · 77,287.3 · 76,897.4
#TradingSignal
No chase outside the zone; the stop defines the whole idea.
BTCUSDT SHORT
IN 77,881.8 - 78,096.6
OUT 78,379.1
TP 77,599.3 · 77,287.3 · 76,897.4
#TradingSignal
35
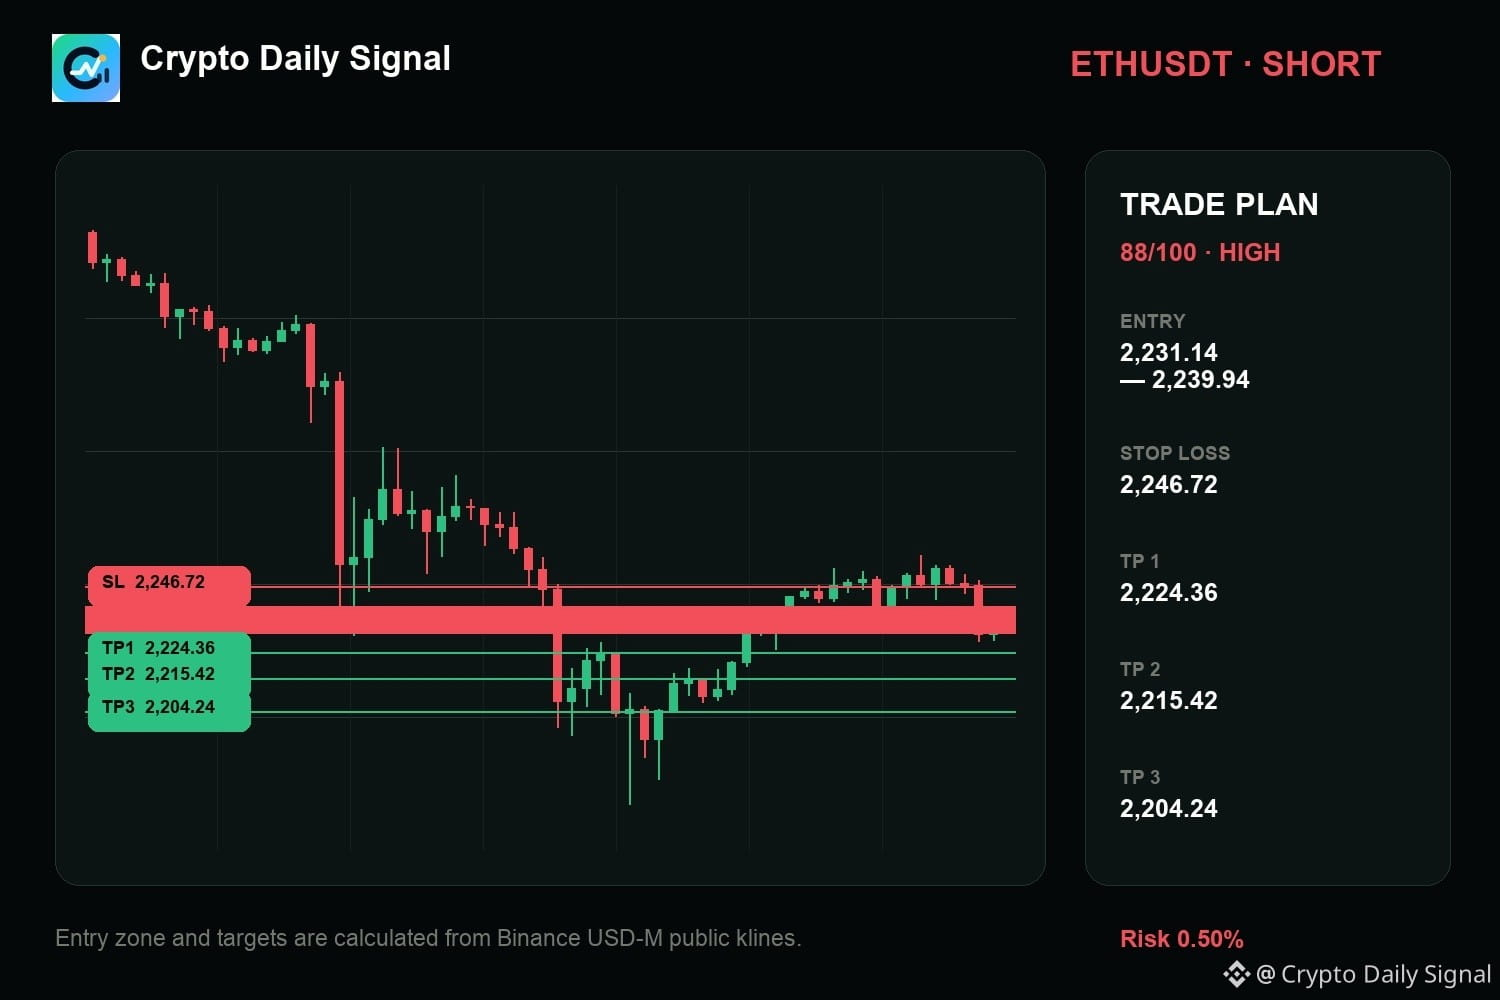
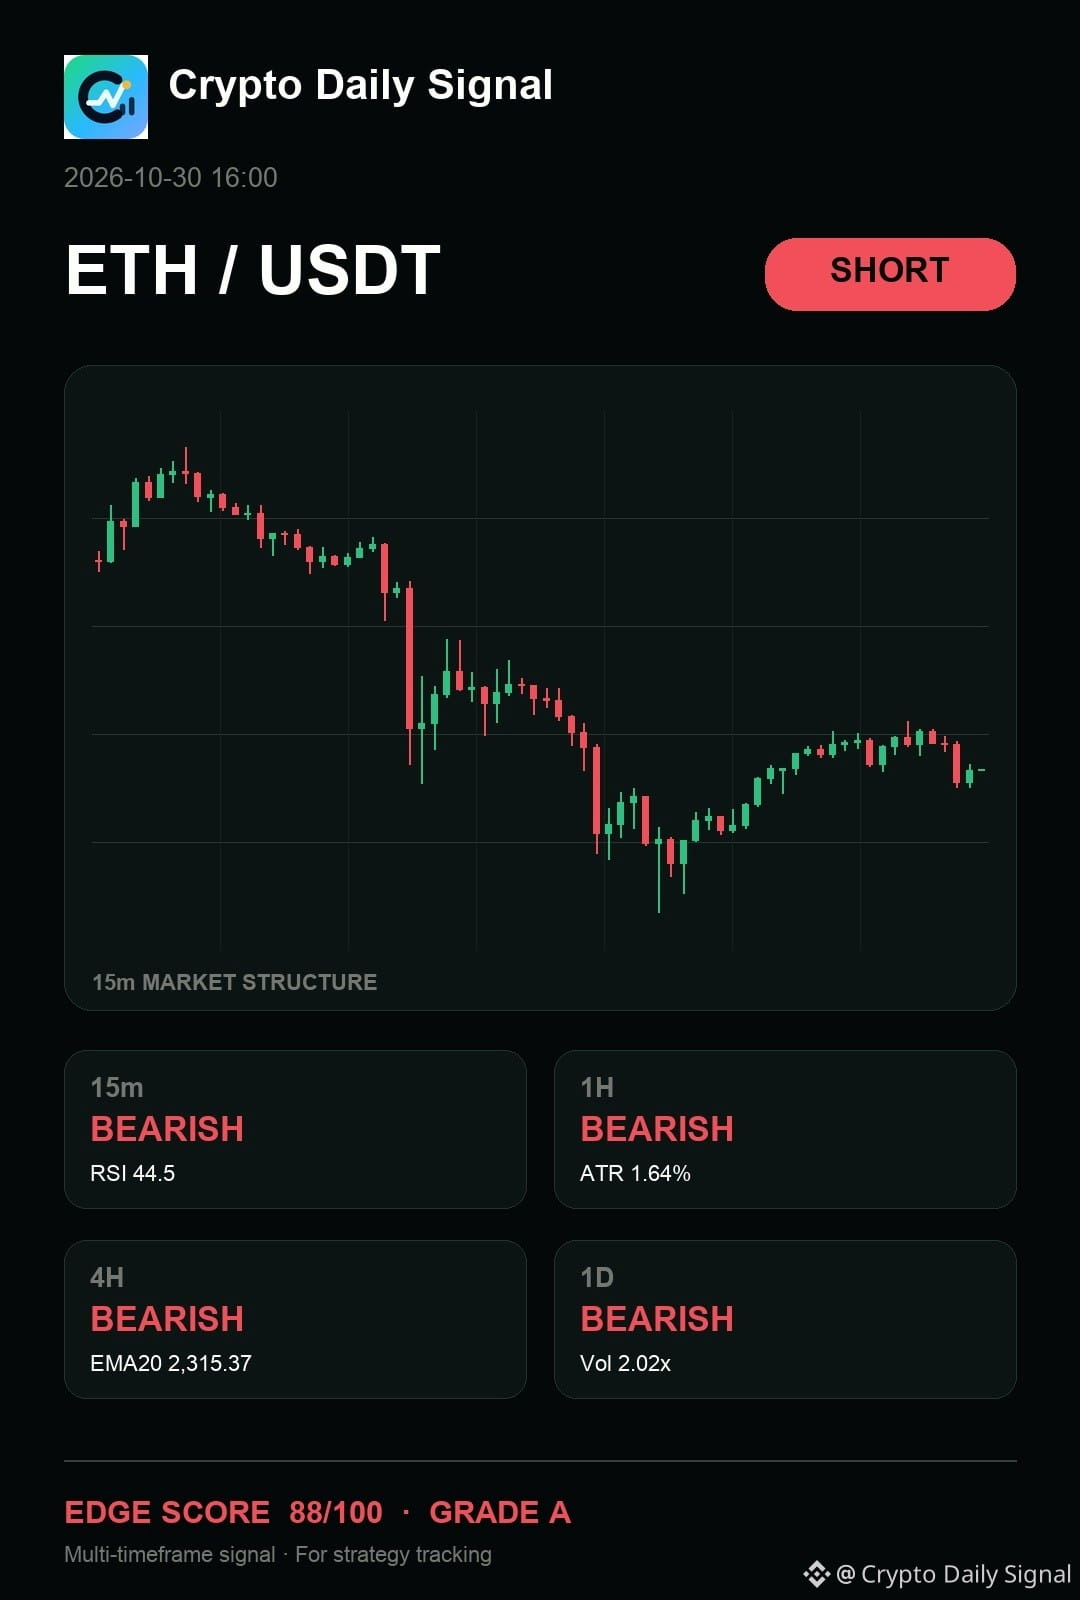
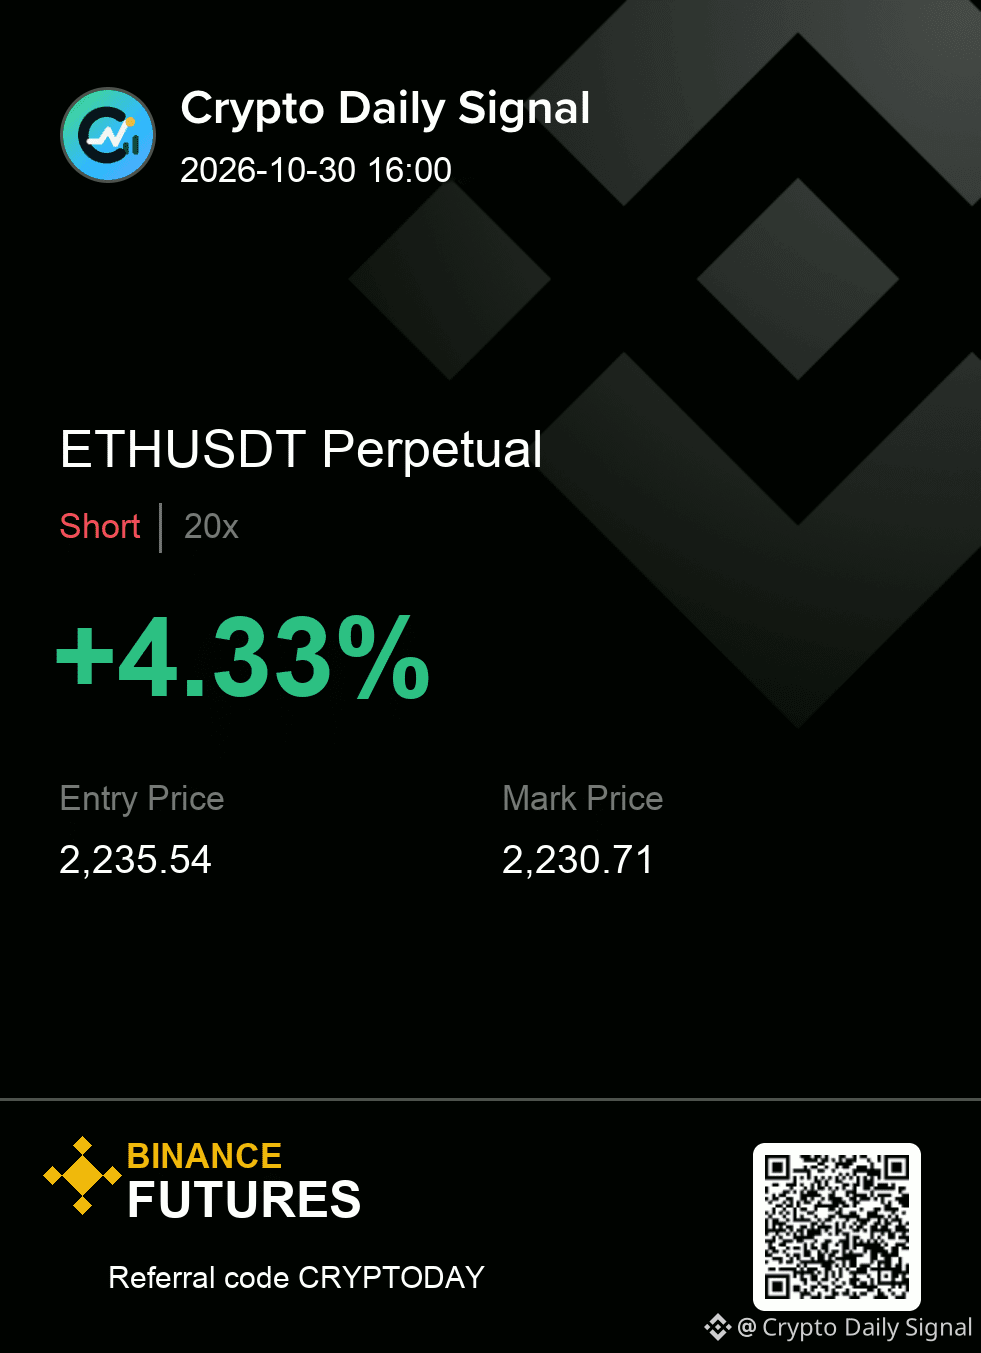
$ETH requires patience before the short is actionable. The price is trading below recent highs, and candles are building lower highs sequence by sequence. A strong move back above that swing high would wipe out the short thesis entirely.
Execution plan (ETHUSDT — SHORT)
Entry: 2,231.14 - 2,239.94 | SL: 2,246.72
Take profit: 2,224.36 → 2,215.42 → 2,204.24
Confirmation first or early entry — which side of that trade-off are you on?
#TradingSignal
{future}(ETHUSDT)
$ETH requires patience before the short is actionable. The price is trading below recent highs, and candles are building lower highs sequence by sequence. A strong move back above that swing high would wipe out the short thesis entirely.
Execution plan (ETHUSDT — SHORT)
Entry: 2,231.14 - 2,239.94 | SL: 2,246.72
Take profit: 2,224.36 → 2,215.42 → 2,204.24
Confirmation first or early entry — which side of that trade-off are you on?
#TradingSignal
Execution plan (ETHUSDT — SHORT)
Entry: 2,231.14 - 2,239.94 | SL: 2,246.72
Take profit: 2,224.36 → 2,215.42 → 2,204.24
Confirmation first or early entry — which side of that trade-off are you on?
#TradingSignal
11
·
--
🔥 IDOL showing bullish pressure with strong volume spikes.
Setup confirmed: Long entry at 0.016464. Stop loss at 0.015942. First target at 0.017246, second target at 0.017768.
⚠️ This is a validated setup, not a guaranteed profit.
What’s your take on IDOL’s next move? #IDOLUSDT
$IDOL #TradingSignal #CryptoAnalysis
Setup confirmed: Long entry at 0.016464. Stop loss at 0.015942. First target at 0.017246, second target at 0.017768.
⚠️ This is a validated setup, not a guaranteed profit.
What’s your take on IDOL’s next move? #IDOLUSDT
$IDOL #TradingSignal #CryptoAnalysis

1
Войдите, чтобы посмотреть больше материала
Присоединяйтесь к пользователям криптовалют по всему миру на Binance Square
⚡️ Получайте новейшую и полезную информацию о криптоактивах.
💬 Нам доверяет крупнейшая в мире криптобиржа.
👍 Получите достоверные аналитические данные от верифицированных создателей контента.
Эл. почта/номер телефона
В тренде
1
#UniswapA16zSeekDeFiExemptionFromIllinoisCryptoTax
Просмотров: 43,579
938 обсуждают
2
#HKDollarStablecoinHKDAPToLaunchOnSolana
Просмотров: 31,532
610 обсуждают
3
#$1.5BInLeveragedCryptoBetsLiquidated
Просмотров: 63,356
277 обсуждают
4
#TrezorSaysCryptoBilisSoldWalletMayContainMaliciousComponents
Просмотров: 5,336
89 обсуждают
5
#KOSPIFalls3.53%BackBelow6000
Просмотров: 78,122
1,195 обсуждают
6
#AmazonSharesFallAbout7%InPremarketTrading
Просмотров: 39,348
660 обсуждают
7
#USMidtermElections
Просмотров: 301,353
2,462 обсуждают
8
#StrategySTRCReaches$99.95ForFirstTimeIn165Days
Просмотров: 43,137
97 обсуждают
9
#BinanceWillListPredictPREDICT
Просмотров: 119,282
1,494 обсуждают
10
#SwitzerlandFirstSpotBitcoinETFExpectedToTradeInNovember
Просмотров: 3,562
120 обсуждают