

#pepe
pepe
Просмотров: 101.4M
114,588 обсуждают
Популярные
Новые


·
--
Падение
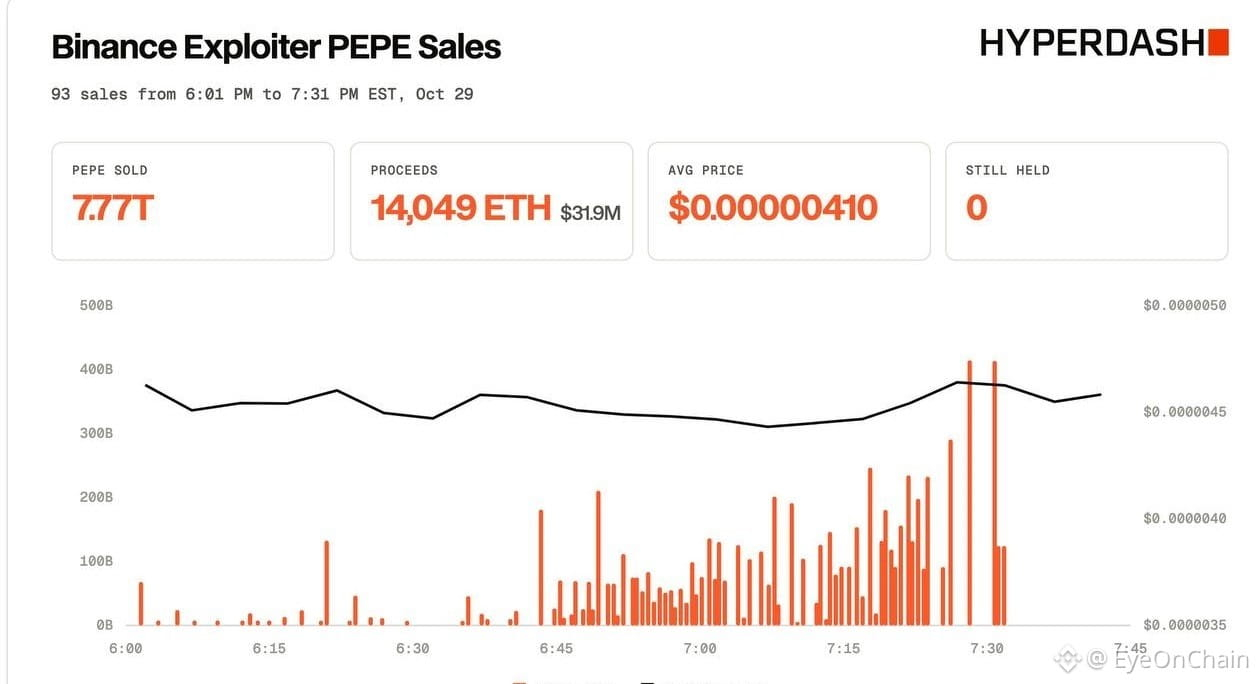
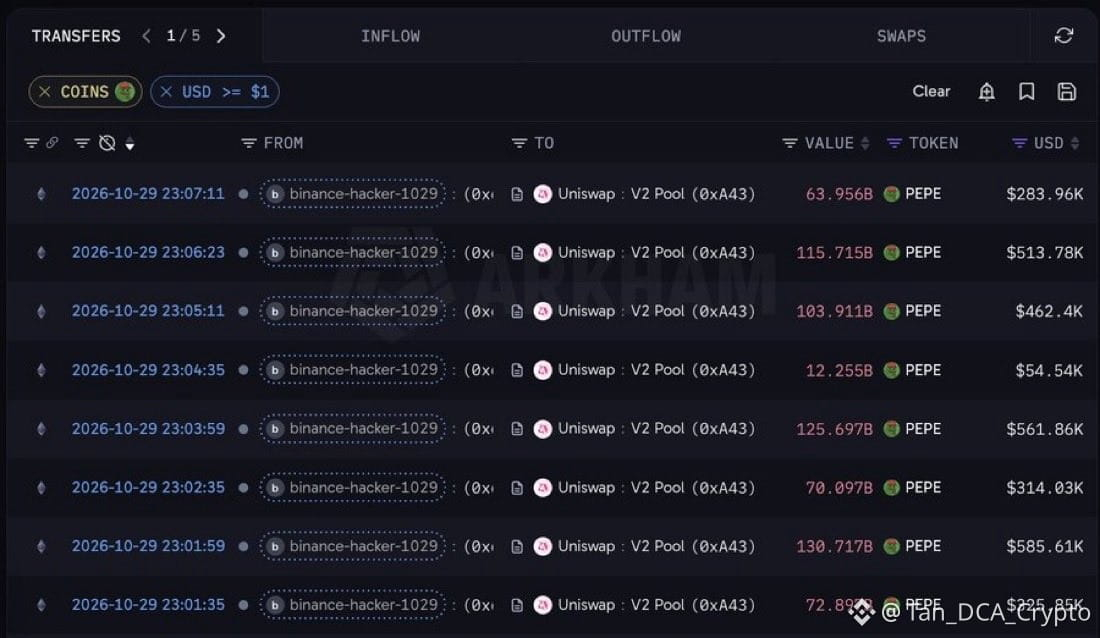
HACKERS DUMP 7.77 TRILLION PEPE, TOKEN SLIDES 12.33%.
The Binance hot-wallet hacker has reportedly dumped the entire 7.77 trillion $PEPE , receiving 14,049 ETH worth more than $31.9 million in the process. The selling pressure sent #PEPE down 12.33%, with an average sell price of approximately $0.0000041.
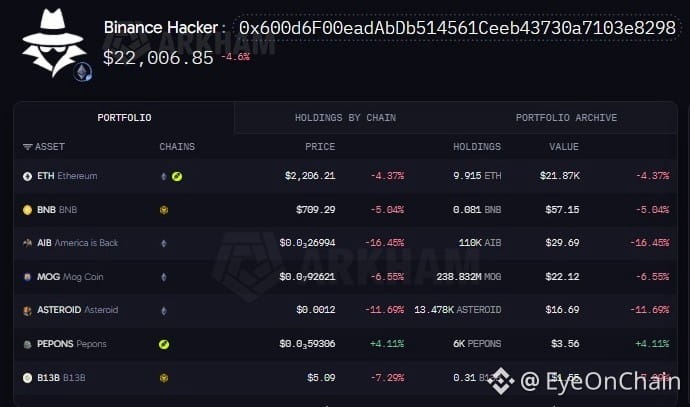
The wallet behind the PEPE dump:
0x600d6F00eadAbDb514561Ceeb43730a7103e8298
Meanwhile, the PEPE transferred out by Justin Sun-linked wallets since October 17 is also seeing its paper profits shrink.
Those wallets moved around 11.8 trillion #pepe , with an estimated average withdrawal price of $0.000004114. Their floating profit has now fallen to roughly $4.45 million, after reaching as high as $18.55 million just last night. A sharp reversal in unrealized gains as PEPE faces another major wave of selling.
{spot}(PEPEUSDT)
HACKERS DUMP 7.77 TRILLION PEPE, TOKEN SLIDES 12.33%.
The Binance hot-wallet hacker has reportedly dumped the entire 7.77 trillion $PEPE , receiving 14,049 ETH worth more than $31.9 million in the process. The selling pressure sent #PEPE down 12.33%, with an average sell price of approximately $0.0000041.
The wallet behind the PEPE dump:
0x600d6F00eadAbDb514561Ceeb43730a7103e8298
Meanwhile, the PEPE transferred out by Justin Sun-linked wallets since October 17 is also seeing its paper profits shrink.
Those wallets moved around 11.8 trillion #pepe , with an estimated average withdrawal price of $0.000004114. Their floating profit has now fallen to roughly $4.45 million, after reaching as high as $18.55 million just last night. A sharp reversal in unrealized gains as PEPE faces another major wave of selling.
BUFFYZDANIEL:
crees que caiga ?
1
3
2.2k
·
--
Статья
🐸 PEPE/USDT 4H Analysis: Can PEPE Reclaim 0.00000500?🐸 PEPE/USDT 4H Technical Analysis: Can PEPE Recover Above 0.00000500?
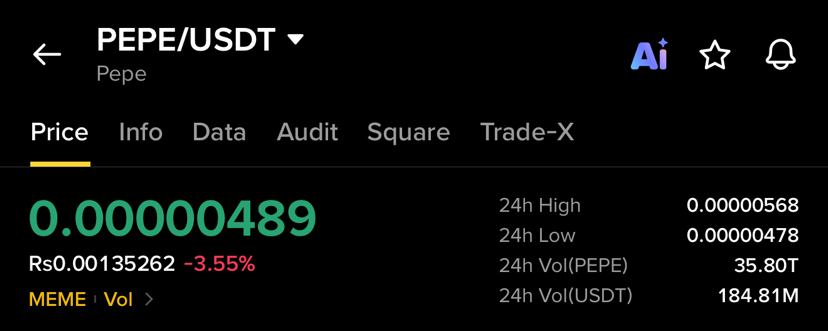
PEPE/USDT is currently trading around 0.00000489, after experiencing a noticeable pullback from the recent highs. The 4H chart shows that PEPE had a strong recovery from the 0.00000420–0.00000440 region, but the price faced significant selling pressure after reaching the 0.00000550–0.00000560 area.
The recent price action is particularly interesting because PEPE is now testing an important support zone around 0.00000480–0.00000490. The reaction from this area could provide a clearer indication of the next short-term direction.
📊 Recent Price Action
PEPE spent several candles consolidating around the 0.00000420–0.00000440 region before buyers started gaining momentum.
The recovery then accelerated as the price moved above 0.00000460 and later approached the 0.00000500 level. Buyers continued pushing higher, with PEPE eventually reaching approximately 0.00000550+.
However, the move was followed by a strong rejection. The latest red candle brought the price back toward 0.00000490, showing that sellers remain active around the higher levels.
The increased volume during the recent move also suggests that market participation has increased, meaning the next few 4H candles could be important for determining whether PEPE is preparing for another recovery attempt or entering a deeper correction.
🟢 Bullish Scenario
The first important level to watch is 0.00000480–0.00000490.
If PEPE continues holding this area and buyers step in, the price could attempt to reclaim 0.00000500.
A sustained move above 0.00000500 would improve the short-term structure and could open the way toward:
0.00000520 → 0.00000540 → 0.00000550–0.00000560
The 0.00000550–0.00000560 region is particularly important because it recently acted as a strong rejection area.
A convincing breakout above that zone, preferably supported by strong volume, could indicate that buyers are regaining control.
🔴 Bearish Scenario
On the other hand, if PEPE fails to hold the 0.00000480 support area, the recent recovery could lose momentum.
In that situation, the next areas to watch would be around:
0.00000460 → 0.00000440 → 0.00000420
A move back toward 0.00000440–0.00000420 would mean that a significant portion of the recent recovery has been retraced.
Therefore, the reaction around 0.00000480 is important for the short-term setup.
📌 Important Levels to Watch
Resistance:
🔹 0.00000500
🔹 0.00000520
🔹 0.00000540
🔹 0.00000550–0.00000560
Support:
🔹 0.00000480
🔹 0.00000460
🔹 0.00000440
🔹 0.00000420
📈 Volume & Momentum
One of the notable features of the chart is the increase in trading volume during the recent upward move and subsequent rejection.
Higher volume can indicate stronger participation, but volume alone does not confirm the direction of the next move. For that reason, traders may want to watch how price reacts to the key support and resistance zones rather than relying on a single candle.
The current structure shows that PEPE has already demonstrated strong buying interest from the lower levels, but sellers have also shown strength near 0.00000550.
🔎 What Could Happen Next?
The market is currently sitting between an important support zone and the psychological 0.00000500 level.
If buyers defend 0.00000480–0.00000490, PEPE could attempt another move toward 0.00000500 and potentially retest the recent highs.
If sellers push the price below support with strong volume, the market could instead move toward 0.00000460 and lower support levels.
For now, the 0.00000480–0.00000500 range is the key area to watch.
🐸 Final View
PEPE remains highly volatile, and the 4H chart is showing a battle between buyers defending the recent recovery and sellers protecting the higher resistance zone.
The most important confirmation would be a clear reaction from 0.00000480 or a strong reclaim of 0.00000500.
Until that happens, patience and confirmation may be more important than reacting to short-term price movements.
PEPE is at an interesting decision zone — the next strong 4H move could provide a clearer signal of whether the recent rally can continue or whether a deeper correction is developing. 📊🐸
PEPE article ke liye ye hashtags lagao 👇
#PEPE #PEPEUSDT #PEPECoin #Crypto #Binance #TechnicalAnalysis #CryptoAnalysis
Agar sirf 5 tags allowed hon to:
#pepe #PEPEUSDT #crypto #Binance #TechnicalAnalysis
{spot}(PEPEUSDT)
🐸 PEPE/USDT 4H Analysis: Can PEPE Reclaim 0.00000500?
🐸 PEPE/USDT 4H Technical Analysis: Can PEPE Recover Above 0.00000500?
PEPE/USDT is currently trading around 0.00000489, after experiencing a noticeable pullback from the recent highs. The 4H chart shows that PEPE had a strong recovery from the 0.00000420–0.00000440 region, but the price faced significant selling pressure after reaching the 0.00000550–0.00000560 area.
The recent price action is particularly interesting because PEPE is now testing an important support zone around 0.00000480–0.00000490. The reaction from this area could provide a clearer indication of the next short-term direction.
📊 Recent Price Action
PEPE spent several candles consolidating around the 0.00000420–0.00000440 region before buyers started gaining momentum.
The recovery then accelerated as the price moved above 0.00000460 and later approached the 0.00000500 level. Buyers continued pushing higher, with PEPE eventually reaching approximately 0.00000550+.
However, the move was followed by a strong rejection. The latest red candle brought the price back toward 0.00000490, showing that sellers remain active around the higher levels.
The increased volume during the recent move also suggests that market participation has increased, meaning the next few 4H candles could be important for determining whether PEPE is preparing for another recovery attempt or entering a deeper correction.
🟢 Bullish Scenario
The first important level to watch is 0.00000480–0.00000490.
If PEPE continues holding this area and buyers step in, the price could attempt to reclaim 0.00000500.
A sustained move above 0.00000500 would improve the short-term structure and could open the way toward:
0.00000520 → 0.00000540 → 0.00000550–0.00000560
The 0.00000550–0.00000560 region is particularly important because it recently acted as a strong rejection area.
A convincing breakout above that zone, preferably supported by strong volume, could indicate that buyers are regaining control.
🔴 Bearish Scenario
On the other hand, if PEPE fails to hold the 0.00000480 support area, the recent recovery could lose momentum.
In that situation, the next areas to watch would be around:
0.00000460 → 0.00000440 → 0.00000420
A move back toward 0.00000440–0.00000420 would mean that a significant portion of the recent recovery has been retraced.
Therefore, the reaction around 0.00000480 is important for the short-term setup.
📌 Important Levels to Watch
Resistance:
🔹 0.00000500
🔹 0.00000520
🔹 0.00000540
🔹 0.00000550–0.00000560
Support:
🔹 0.00000480
🔹 0.00000460
🔹 0.00000440
🔹 0.00000420
📈 Volume & Momentum
One of the notable features of the chart is the increase in trading volume during the recent upward move and subsequent rejection.
Higher volume can indicate stronger participation, but volume alone does not confirm the direction of the next move. For that reason, traders may want to watch how price reacts to the key support and resistance zones rather than relying on a single candle.
The current structure shows that PEPE has already demonstrated strong buying interest from the lower levels, but sellers have also shown strength near 0.00000550.
🔎 What Could Happen Next?
The market is currently sitting between an important support zone and the psychological 0.00000500 level.
If buyers defend 0.00000480–0.00000490, PEPE could attempt another move toward 0.00000500 and potentially retest the recent highs.
If sellers push the price below support with strong volume, the market could instead move toward 0.00000460 and lower support levels.
For now, the 0.00000480–0.00000500 range is the key area to watch.
🐸 Final View
PEPE remains highly volatile, and the 4H chart is showing a battle between buyers defending the recent recovery and sellers protecting the higher resistance zone.
The most important confirmation would be a clear reaction from 0.00000480 or a strong reclaim of 0.00000500.
Until that happens, patience and confirmation may be more important than reacting to short-term price movements.
PEPE is at an interesting decision zone — the next strong 4H move could provide a clearer signal of whether the recent rally can continue or whether a deeper correction is developing. 📊🐸
PEPE article ke liye ye hashtags lagao 👇
#PEPE #PEPEUSDT #PEPECoin #Crypto #Binance #TechnicalAnalysis #CryptoAnalysis
Agar sirf 5 tags allowed hon to:
#pepe #PEPEUSDT #crypto #Binance #TechnicalAnalysis
1
581

UPDATE:
The wallet linked to Binance hacker is now completely out of $PEPE 🚨
Selling wallet:
0x600d6f00eadabdb514561ceeb43730a7103e8298
this wallet received 7,772,980,000,000 $PEPE, worth $38.19M, from the main address involved in the Binance transfers.
85 swaps executed over 81 minutes
5.99 trillion $PEPE sold
10,998.64 $WETH received
$25.56M realized
All 85 swaps went through the same Uniswap V2 PEPE/WETH pool:
0xa43fe16908251ee70ef74718545e4fe6c5ccec9f
Instead of dumping everything in one transaction, the wallet repeatedly sold smaller amounts.
Not a single swap exceeded $1.05M
Now it currently holds: 14,049.9 ETH
($31.7M in ETH)
Zero $PEPE
And remember, the main receiving wallet:
0x5227f603c1ee34ce3c06efe6477003bdfccb2f8c
Bottom could be in for the frog.
#PEPE

1k

·
--
Рост
Проверено
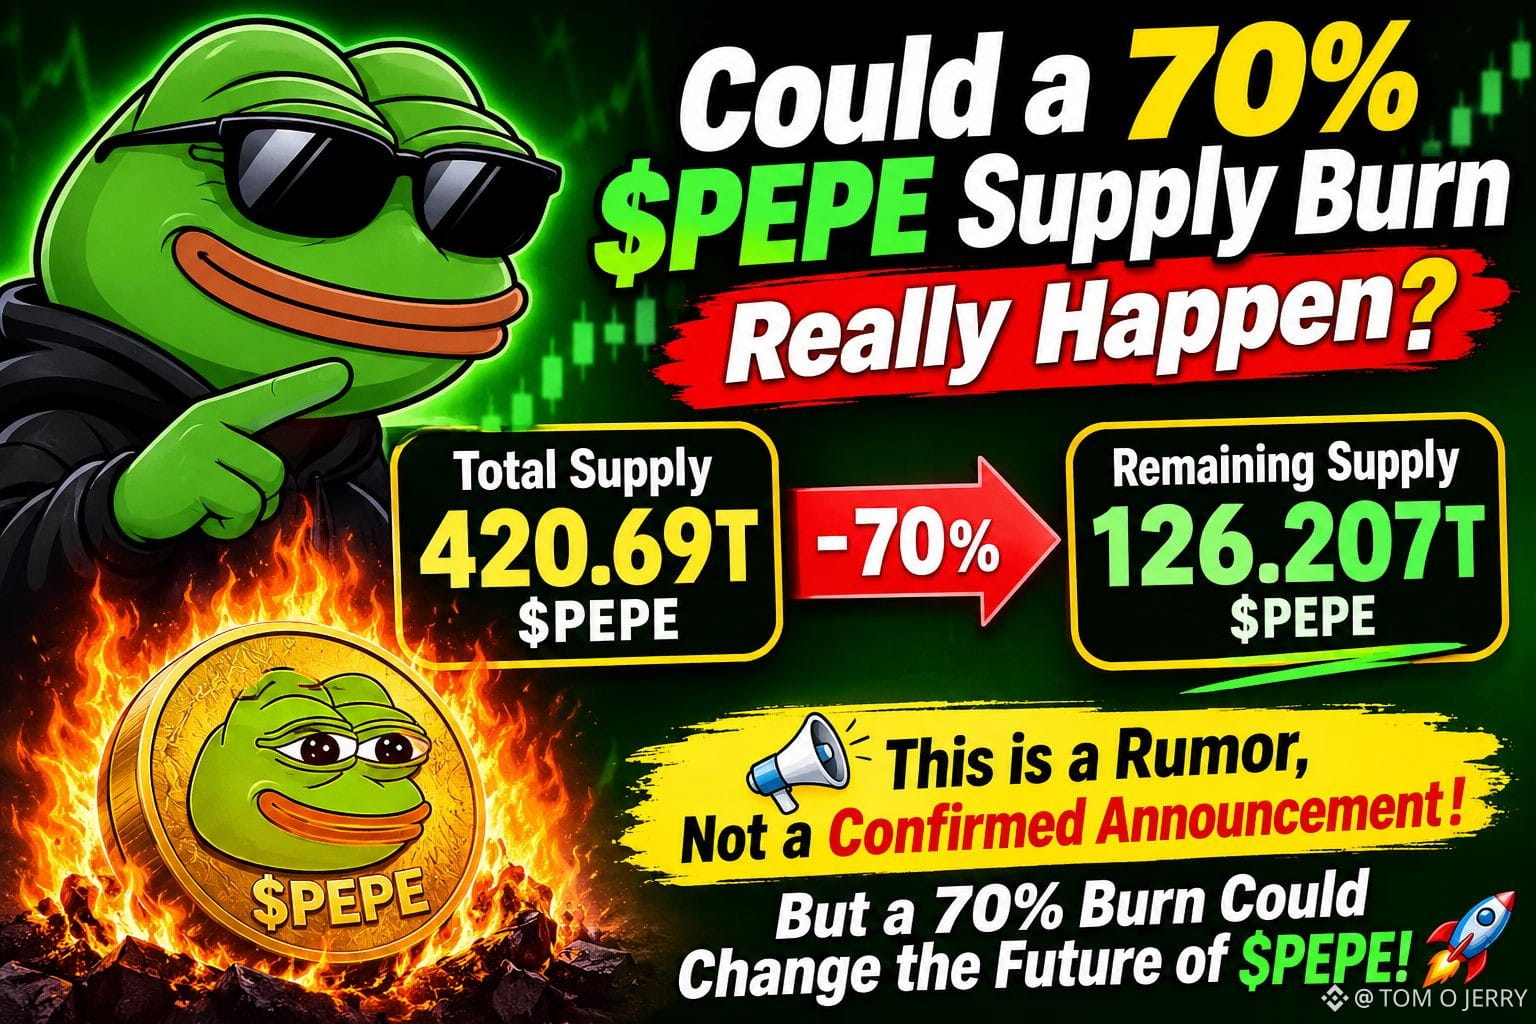
🚨🐸 Could a 70% $PEPE Supply Burn Really Happen? 🔥
Rumors are circulating that the $PEPE team could burn 70% of its total supply of 420.69 trillion tokens. 👀
If such a burn actually happens, the numbers would look like this:
🔥 Total Supply: 420.69 Trillion $PEPE
🔥 Potential Burn: 70%
🐸 Remaining Supply: Around 126.207 Trillion PEPE
That would be a massive reduction in supply! 🚀
But remember, this is still a rumor, not a confirmed announcement. A supply burn alone doesn't guarantee a price increase. 📈
💭 What do you think? Could a massive burn change the future of $PEPE
{spot}(PEPEUSDT)
?
#PEPE #Crypto #MemeCoins #BinanceSquare
🚨🐸 Could a 70% $PEPE Supply Burn Really Happen? 🔥
Rumors are circulating that the $PEPE team could burn 70% of its total supply of 420.69 trillion tokens. 👀
If such a burn actually happens, the numbers would look like this:
🔥 Total Supply: 420.69 Trillion $PEPE
🔥 Potential Burn: 70%
🐸 Remaining Supply: Around 126.207 Trillion PEPE
That would be a massive reduction in supply! 🚀
But remember, this is still a rumor, not a confirmed announcement. A supply burn alone doesn't guarantee a price increase. 📈
💭 What do you think? Could a massive burn change the future of $PEPE
?
#PEPE #Crypto #MemeCoins #BinanceSquare
8
1.2k

$PEPE : Can It Make Another Big Move?
PEPE has already caught plenty of attention, but can it surprise the market again in the next rally?
I think the key is whether fresh demand returns and buyers can keep the momentum going. Hype alone isn’t enough.
PEPE holders, what price target are you watching next?
NFA. Manage risk.
#pepe #memecoins #crypto #Bullrun #altcoins $BEAT $BULLA

HOLD bnb culture:
Long-term holders always win.
1
13
3.2k

·
--
🐸 $PEPE : From $1 to $463,000?! 🤯🚀
Did you know?
📉 All-Time Low: $0.00000000001063 (April 14, 2023)
💵 At that price, $1 could buy approximately 94 billion PEPE!
📈 At a price of $0.000004935, those 94 billion tokens would be worth approximately $463,890! 🤯
🔥 That's the power of an early entry—but nobody can predict the next PEPE rally!
Could PEPE make history again? 👀🐸
#pepe #Crypto #memecoin #BinanceSquare
{spot}(PEPEUSDT)
“Don't miss an opportunity like this!”
🐸 $PEPE : From $1 to $463,000?! 🤯🚀
Did you know?
📉 All-Time Low: $0.00000000001063 (April 14, 2023)
💵 At that price, $1 could buy approximately 94 billion PEPE!
📈 At a price of $0.000004935, those 94 billion tokens would be worth approximately $463,890! 🤯
🔥 That's the power of an early entry—but nobody can predict the next PEPE rally!
Could PEPE make history again? 👀🐸
#pepe #Crypto #memecoin #BinanceSquare
“Don't miss an opportunity like this!”

Mr_Mehar007:
I have 1m above PEPE
8
37
22k

·
--
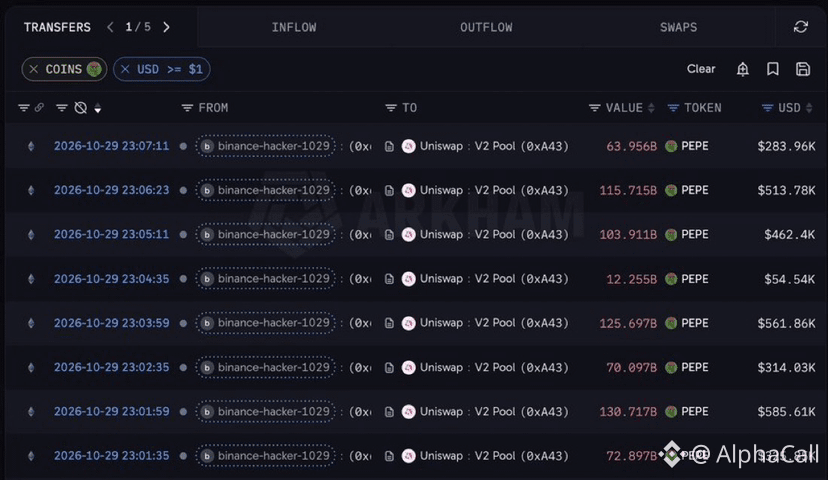
The Binance hacker is dumping $PEPE.
$14M sold.
$20M still held.
No sign of stopping.
Who's catching these bags?
#pepe #Binance
The Binance hacker is dumping $PEPE.
$14M sold.
$20M still held.
No sign of stopping.
Who's catching these bags?
#pepe #Binance
$14M sold.
$20M still held.
No sign of stopping.
Who's catching these bags?
#pepe #Binance
411

·
--
Рост
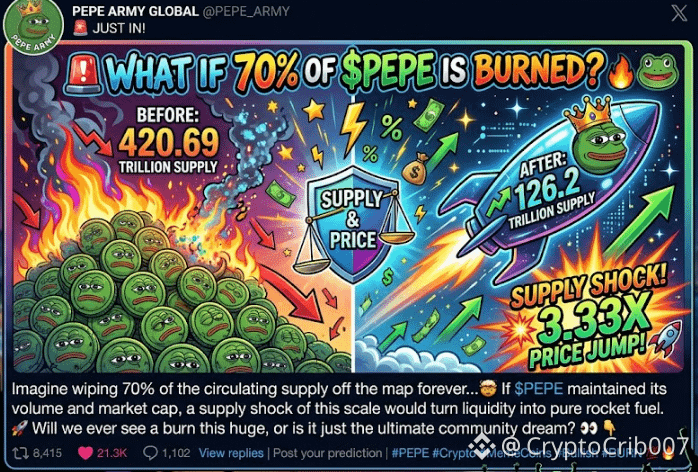
🚨 IMAGIN, WHAT IF 70% OF $PEPE IS BURNED? 🔥🐸
Imagine wiping 70% of the circulating supply off the map forever... 🤯
📉 Supply drops from ~420.69 trillion to ~126 trillion
📈 Scarcity: Spikes instantly
💥 Math: Same market cap = ~3.33x price increase per token
If $PEPE maintained its volume and market cap, a supply shock of this scale would turn liquidity into pure rocket fuel. 🚀
Will we ever see a burn this huge, or is it just the ultimate community dream? 👀👇
$PEPE
{spot}(PEPEUSDT)
#pepe #Write2Earn #memecoins #NFA✅ & #DYOR
🚨 IMAGIN, WHAT IF 70% OF $PEPE IS BURNED? 🔥🐸
Imagine wiping 70% of the circulating supply off the map forever... 🤯
📉 Supply drops from ~420.69 trillion to ~126 trillion
📈 Scarcity: Spikes instantly
💥 Math: Same market cap = ~3.33x price increase per token
If $PEPE maintained its volume and market cap, a supply shock of this scale would turn liquidity into pure rocket fuel. 🚀
Will we ever see a burn this huge, or is it just the ultimate community dream? 👀👇
$PEPE
#pepe #Write2Earn #memecoins #NFA✅ & #DYOR
5
1.4k

·
--
$PEPE Volume Is Cooling—Should Traders Be Worried? 🐸📊
$PEPE’s 24-hour trading volume eased to $1.22B from $1.24B. That’s a small decline, but the context matters.
Here’s the interesting part: lower turnover during a pullback can suggest selling pressure isn’t accelerating. However, it doesn’t prove buyers are returning or that a recovery is coming.
🐂 Bulls may see a quieter correction; 🐻 bears may argue that fading participation signals weakening interest.
What would convince you more: falling sell volume or a clear price recovery?
#PEPE #Crypto #Memecoins #Altcoins #BinanceSquare
$PEPE Volume Is Cooling—Should Traders Be Worried? 🐸📊
$PEPE ’s 24-hour trading volume eased to $1.22B from $1.24B. That’s a small decline, but the context matters.
Here’s the interesting part: lower turnover during a pullback can suggest selling pressure isn’t accelerating. However, it doesn’t prove buyers are returning or that a recovery is coming.
🐂 Bulls may see a quieter correction; 🐻 bears may argue that fading participation signals weakening interest.
What would convince you more: falling sell volume or a clear price recovery?
#PEPE #Crypto #Memecoins #Altcoins #BinanceSquare

2
251

·
--
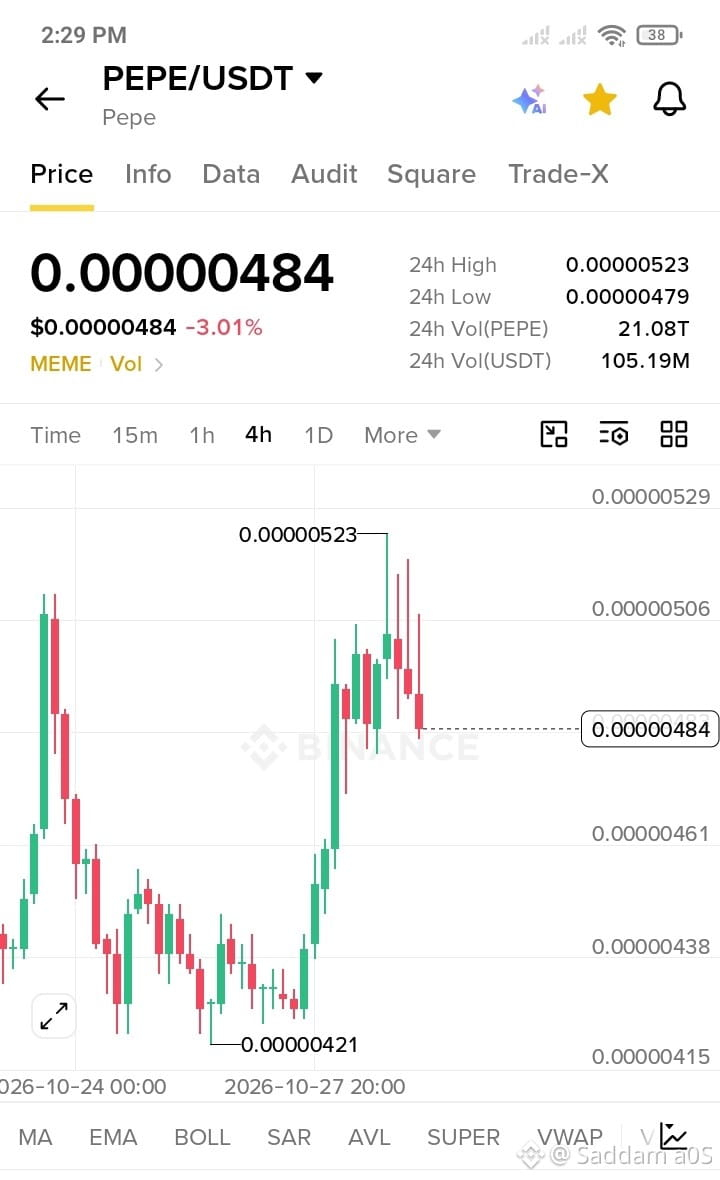
This is a meme coin.
pepe price :0.00000485$ 3%
24h high :0.00000523$
2rh low:0.00000479$
Volume: 20.81T PEPE
Biyers 59%
Look at the hart..📉📈
Share your prediction 🙏
Key levels to watch:
Resistance: 0.00000523 (the top you see marked). If it breaks and holds above that, next move up.
Support: 0.00000490 (current), then 0.00000479, then 0.00000461. If 0.00000479 breaks, a deeper correction to 0.00000438 is possible.
#PEPE #BTC #MEME
5
1.3k

·
--
$PEPE just reminded us why dormant wallets matter.
Two wallets quiet for 4-12 months moved 2.27 trillion $PEPE, about $10.19M (Lookonchain/Arkham via BSCN, Oct 29). Where the tokens went is not confirmed — so this is not confirmed selling, and I won't call it that.
Around $0.00000508, up about 4.7% on Binance (CoinDesk markets, 11:12 PM PKT), inside today's $0.00000478-$0.00000523 range. It absorbed the move instead of dumping, narrowing the gap to $SHIB's market cap to about $1.06B. Memes led the sector board, up 2.97% while AI fell 8.51% (SoSoValue, Oct 29) — rotation, not one coin alone.
Open interest near $509.7M with funding slightly positive (JustScreener) says longs are crowding in. That can fuel a push, but makes a rejection sharper.
I'm leaning bullish above the $0.00000485 open, but only leaning — the unknown whale destination is what proves this wrong.
If $0.00000523 breaks, momentum traders get their trigger. If it rejects, expect a fast trip back toward $0.00000485. Below $0.00000478, my lean is invalidated.
Whales waking — distribution or reshuffle? Does $PEPE clear $0.00000523 first, or reject?
Trigger again: $0.00000523. Not financial advice. DYOR.
$PEPE $DOGE $SHIB
#PEPE #MemeCoins
$PEPE just reminded us why dormant wallets matter.
Two wallets quiet for 4-12 months moved 2.27 trillion $PEPE , about $10.19M (Lookonchain/Arkham via BSCN, Oct 29). Where the tokens went is not confirmed — so this is not confirmed selling, and I won't call it that.
Around $0.00000508, up about 4.7% on Binance (CoinDesk markets, 11:12 PM PKT), inside today's $0.00000478-$0.00000523 range. It absorbed the move instead of dumping, narrowing the gap to $SHIB 's market cap to about $1.06B. Memes led the sector board, up 2.97% while AI fell 8.51% (SoSoValue, Oct 29) — rotation, not one coin alone.
Open interest near $509.7M with funding slightly positive (JustScreener) says longs are crowding in. That can fuel a push, but makes a rejection sharper.
I'm leaning bullish above the $0.00000485 open, but only leaning — the unknown whale destination is what proves this wrong.
If $0.00000523 breaks, momentum traders get their trigger. If it rejects, expect a fast trip back toward $0.00000485. Below $0.00000478, my lean is invalidated.
Whales waking — distribution or reshuffle? Does $PEPE clear $0.00000523 first, or reject?
Trigger again: $0.00000523. Not financial advice. DYOR.
$PEPE $DOGE $SHIB
#PEPE #MemeCoins
110

·
--
Oh, look, $PEPE is doing something again. The 'smart money' (read: Justin Sun's wallets) decided it was time to pump their bags. And remember that April 2026 ETF chatter? Still a meme, still moving on pure vibes. Bears are probably polishing their 'told you so' speeches. 💅🤡📉 Are you still waiting for fundamentals, or just the next whale fart? #PEPE #Memecoin
Oh, look, $PEPE is doing something again. The 'smart money' (read: Justin Sun's wallets) decided it was time to pump their bags. And remember that April 2026 ETF chatter? Still a meme, still moving on pure vibes. Bears are probably polishing their 'told you so' speeches. 💅🤡📉 Are you still waiting for fundamentals, or just the next whale fart? #PEPE #Memecoin
185

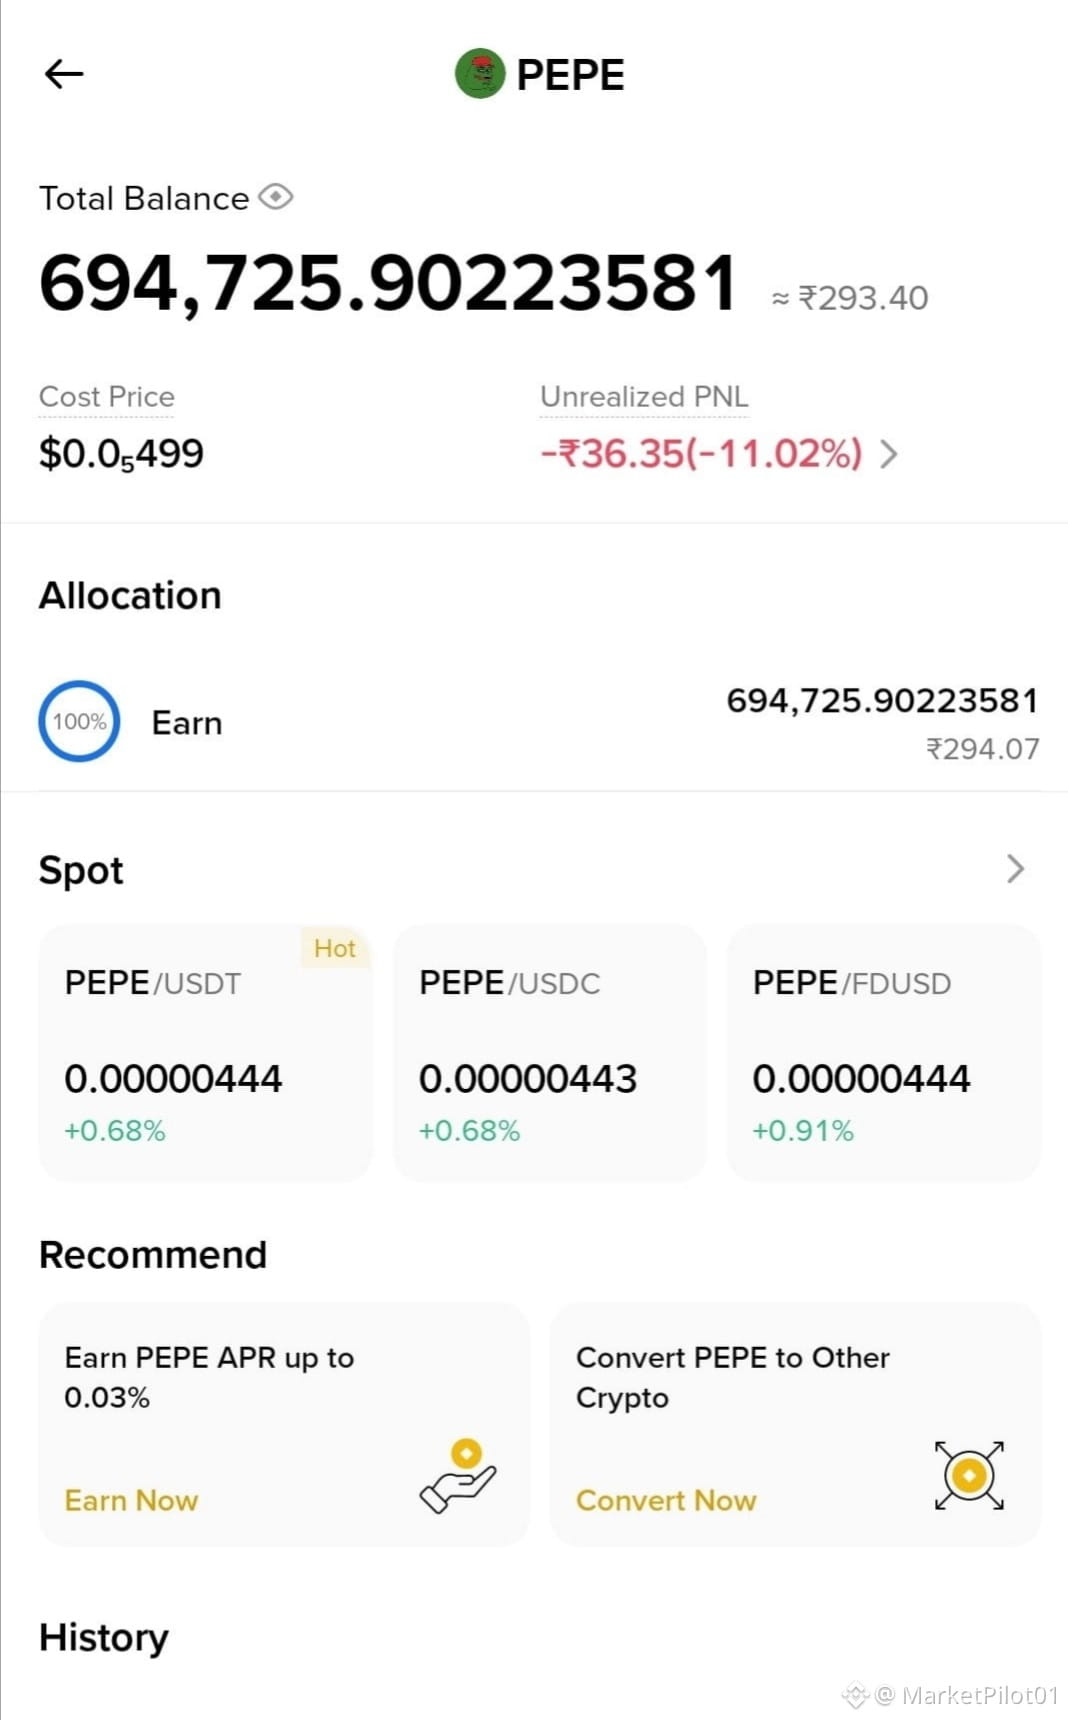
🐸💰 **50 MILLION $PEPE = $50 MILLION DREAM?!** 🤣🚀
Imagine waking up one morning and seeing **$PEPE at $1!** 😭🔥
I've got **50 MILLION PEPE** sitting in my wallet. If this crazy dream ever becomes reality, that's a whopping **$50 MILLION!** 🤑💎
No more charts, no more stress, no more checking prices every five minutes! 😂
Just imagine becoming a millionaire thanks to a little green frog! 🐸👑
I know it's a wild dream, but in crypto, dreams never sleep! 🤣
**Who's holding PEPE and dreaming of $1?** 👇
#PEPE #PepeCoin #memecoins #CryptoDream #BİNANCESQUARE
Just a fun hypothetical scenario, not a price prediction!

3
221

🐸🚀 What’s your next move, #PEPE Army? 👀💚
Something BIG is coming… 💸📈 Are you ready for the next move?
🐸 $PEPE to $1? 🤑💎 A dream that keeps the community HODLing!
🎯 What’s YOUR target for $PEPE?
✈️ Next stop: THE MOON? 🌕🚀
Drop your targets in the comments! 👇🔥
Let’s see how many true #PEPE believers are still holding! 💚🐸
#PEPE #Memecoins #Crypto
🐸🚀 What’s your next move, #PEPE Army? 👀💚
Something BIG is coming… 💸📈 Are you ready for the next move?
🐸 $PEPE to $1? 🤑💎 A dream that keeps the community HODLing!
🎯 What’s YOUR target for $PEPE ?
✈️ Next stop: THE MOON? 🌕🚀
Drop your targets in the comments! 👇🔥
Let’s see how many true #PEPE believers are still holding! 💚🐸
#PEPE #Memecoins #Crypto
1
379


Статья
Justin Sun’s PEPE Stack: Bullish Signal or Concentration Risk?🐸Reportedly 2.82% of supply, about $51M. Here's what the data shows and what it doesn't.
After the dormant whale story, I kept asking one question: who actually owns this much PEPE? A new report puts one name at the top. 🤔
📊 What Happened?
On October 27, Arkham Intelligence identified a large PEPE position across known and suspected wallets linked to Tron founder Justin Sun. Reports put it at about 2.82% of PEPE's total supply, worth roughly $51M, making him the largest individual holder.
🔎 How Big Is It?
Here's the part I like checking myself. The addresses received 11.85 trillion PEPE through two withdrawals from Poloniex on October 17 and October 26.
PEPE's supply is about 420 trillion, so 2.82% works out to roughly 11.9 trillion. That matches the withdrawals, which makes the report look internally consistent. (That's my own arithmetic, not from the report.)
📐 Why Concentration Matters
When one holder owns this much, the token becomes more sensitive to what that holder does. Analysts say this raises questions about liquidity and how easily the price can move. Big holders are normal for small, speculative coins. It's still worth knowing.
🔄 The Bullish Read
There's a case that this is accumulation. Santiment saw outflows from exchanges roughly eight times the October 11–15 average, before PEPE gained around 13% between its October 17 and 22 closes. Tokens leaving exchanges can mean fewer coins available to sell.
Interest is climbing too. PEPE futures volume rose about 72.7% to $587.9M, and open interest rose 7.1% to $316.1M.
🧱 What We Don't Know
Please read the fine print. The position spans known and suspected Sun-linked wallets, so not every address is confirmed. And holding says nothing about intent.
The whale news is mixed as well. A $1.64M deposit to Coinbase raised profit-taking questions, while two dormant wallets moved about $10.19M of PEPE with no destination named.
⚠️ The Risk Scenario
A holder this size can sell as easily as accumulate. If large amounts ever head to exchanges, thin liquidity could make the move sharper. Rising futures open interest adds leverage on top. PEPE surged as much as 16% on October 28, and fast rallies can reverse fast.
👀 Three Things to Watch Next
Any Sun-linked transfers to exchanges.Whether exchange balances keep falling, per Santiment.Whether futures open interest keeps climbing alongside the price.
💡 The Bottom Line
PEPE's reported top holder owns nearly 3% of supply, and exchange outflows are rising. That can be a bullish signal or a concentration risk, and the data can't tell us which yet.
The real question isn't whether the whale is buying. It's what the whale does next.
That's the part worth watching.
This post is for informational and educational purposes only and is not financial advice. Crypto markets are volatile. Always conduct your own research before making financial decisions.
#BinanceSquare #PEPE #MemeCoins #Whales #CryptoNews
{spot}(PEPEUSDT)
Justin Sun’s PEPE Stack: Bullish Signal or Concentration Risk?
🐸Reportedly 2.82% of supply, about $51M. Here's what the data shows and what it doesn't.
After the dormant whale story, I kept asking one question: who actually owns this much PEPE? A new report puts one name at the top. 🤔
📊 What Happened?
On October 27, Arkham Intelligence identified a large PEPE position across known and suspected wallets linked to Tron founder Justin Sun. Reports put it at about 2.82% of PEPE's total supply, worth roughly $51M, making him the largest individual holder.
🔎 How Big Is It?
Here's the part I like checking myself. The addresses received 11.85 trillion PEPE through two withdrawals from Poloniex on October 17 and October 26.
PEPE's supply is about 420 trillion, so 2.82% works out to roughly 11.9 trillion. That matches the withdrawals, which makes the report look internally consistent. (That's my own arithmetic, not from the report.)
📐 Why Concentration Matters
When one holder owns this much, the token becomes more sensitive to what that holder does. Analysts say this raises questions about liquidity and how easily the price can move. Big holders are normal for small, speculative coins. It's still worth knowing.
🔄 The Bullish Read
There's a case that this is accumulation. Santiment saw outflows from exchanges roughly eight times the October 11–15 average, before PEPE gained around 13% between its October 17 and 22 closes. Tokens leaving exchanges can mean fewer coins available to sell.
Interest is climbing too. PEPE futures volume rose about 72.7% to $587.9M, and open interest rose 7.1% to $316.1M.
🧱 What We Don't Know
Please read the fine print. The position spans known and suspected Sun-linked wallets, so not every address is confirmed. And holding says nothing about intent.
The whale news is mixed as well. A $1.64M deposit to Coinbase raised profit-taking questions, while two dormant wallets moved about $10.19M of PEPE with no destination named.
⚠️ The Risk Scenario
A holder this size can sell as easily as accumulate. If large amounts ever head to exchanges, thin liquidity could make the move sharper. Rising futures open interest adds leverage on top. PEPE surged as much as 16% on October 28, and fast rallies can reverse fast.
👀 Three Things to Watch Next
Any Sun-linked transfers to exchanges.Whether exchange balances keep falling, per Santiment.Whether futures open interest keeps climbing alongside the price.
💡 The Bottom Line
PEPE's reported top holder owns nearly 3% of supply, and exchange outflows are rising. That can be a bullish signal or a concentration risk, and the data can't tell us which yet.
The real question isn't whether the whale is buying. It's what the whale does next.
That's the part worth watching.
This post is for informational and educational purposes only and is not financial advice. Crypto markets are volatile. Always conduct your own research before making financial decisions.
#BinanceSquare #PEPE #MemeCoins #Whales #CryptoNews
1
1
228

·
--
Рост
I fooled my girlfriend into becoming a Pepe maxi 😂😇
Today, I told her that Sunday was going to be VERY exciting! 😬😂
She asked me why, and I told her that PEPE is going to hit $0.01 within the next 2 days!🤣🚀
That silly girl actually believed me and got so emotional that she bought 50 MILLION PEPE coins! 😂🐸
Now we have just 2 days left, and the target is HUGE! 😇🎯
But hey, in crypto, anything is possible! 😂🚀
Let's imagine you had only 2 days and your target was $0.01 for PEPE. How many PEPE coins would you buy?🐸💰
I just want to know how big your dreams are and how much your heart would dare to invest! 😂🤔❤️
#PEPE #Memecoins #CryptoCommunity #BinanceSquare
$PEPE
{spot}(PEPEUSDT)
$IDOL
{future}(IDOLUSDT)
$BEAT
{future}(BEATUSDT)
I fooled my girlfriend into becoming a Pepe maxi 😂😇
Today, I told her that Sunday was going to be VERY exciting! 😬😂
She asked me why, and I told her that PEPE is going to hit $0.01 within the next 2 days!🤣🚀
That silly girl actually believed me and got so emotional that she bought 50 MILLION PEPE coins! 😂🐸
Now we have just 2 days left, and the target is HUGE! 😇🎯
But hey, in crypto, anything is possible! 😂🚀
Let's imagine you had only 2 days and your target was $0.01 for PEPE. How many PEPE coins would you buy?🐸💰
I just want to know how big your dreams are and how much your heart would dare to invest! 😂🤔❤️
#PEPE #Memecoins #CryptoCommunity #BinanceSquare
$PEPE
$IDOL
$BEAT

Bitcoin Matrix:
these are best
3
8
3.9k

·
--
$PEPE MEME COIN MOMENTUM IS HEATING UP
Current Price: $0.00000541 | 24H: +11.09%
Buy Zone: $0.00000520–$0.00000535
Entry Confirmation: Holds above $0.00000540
TP1: $0.00000560
TP2: $0.00000585
TP3: $0.00000620
Stop Loss: $0.00000505
$PEPE is attracting attention, but meme coins can reverse quickly. If the breakout holds, buyers may push higher. If support fails, wait for a new setup and manage risk carefully.
#PEPE #PepeCoin #MemeCoins #CryptoAnalysis

1
899

🚨 PEPE WHALES ARE MOVING $10.19 MILLION! 🐸🐋
Two long-dormant $PEPE whale wallets have suddenly come alive, moving a massive 2.27 trillion PEPE tokens worth approximately $10.19 million on October 28.
👀 The move comes as PEPE rallies roughly 12% in 24 hours, putting the memecoin back in the spotlight.
But here's the big question: Are these whales preparing to sell, repositioning their holdings, or anticipating another move higher?
⚠️ Large transfers don't automatically mean selling pressure. Wallet destinations and exchange flows matter.
With momentum picking up, PEPE traders will be watching whale activity closely.
🐸 Whales are moving. Volatility could follow.
#PEPE #Crypto #Memecoins
{spot}(PEPEUSDT)
🚨 PEPE WHALES ARE MOVING $10.19 MILLION! 🐸🐋
Two long-dormant $PEPE whale wallets have suddenly come alive, moving a massive 2.27 trillion PEPE tokens worth approximately $10.19 million on October 28.
👀 The move comes as PEPE rallies roughly 12% in 24 hours, putting the memecoin back in the spotlight.
But here's the big question: Are these whales preparing to sell, repositioning their holdings, or anticipating another move higher?
⚠️ Large transfers don't automatically mean selling pressure. Wallet destinations and exchange flows matter.
With momentum picking up, PEPE traders will be watching whale activity closely.
🐸 Whales are moving. Volatility could follow.
#PEPE #Crypto #Memecoins

Square-Creator-921f50a63c0117c5c177:
As baleias sabem que vai ser 10x em breve..🚀🚀🚀🚀🚀🚀
1
5
607

·
--
Рост
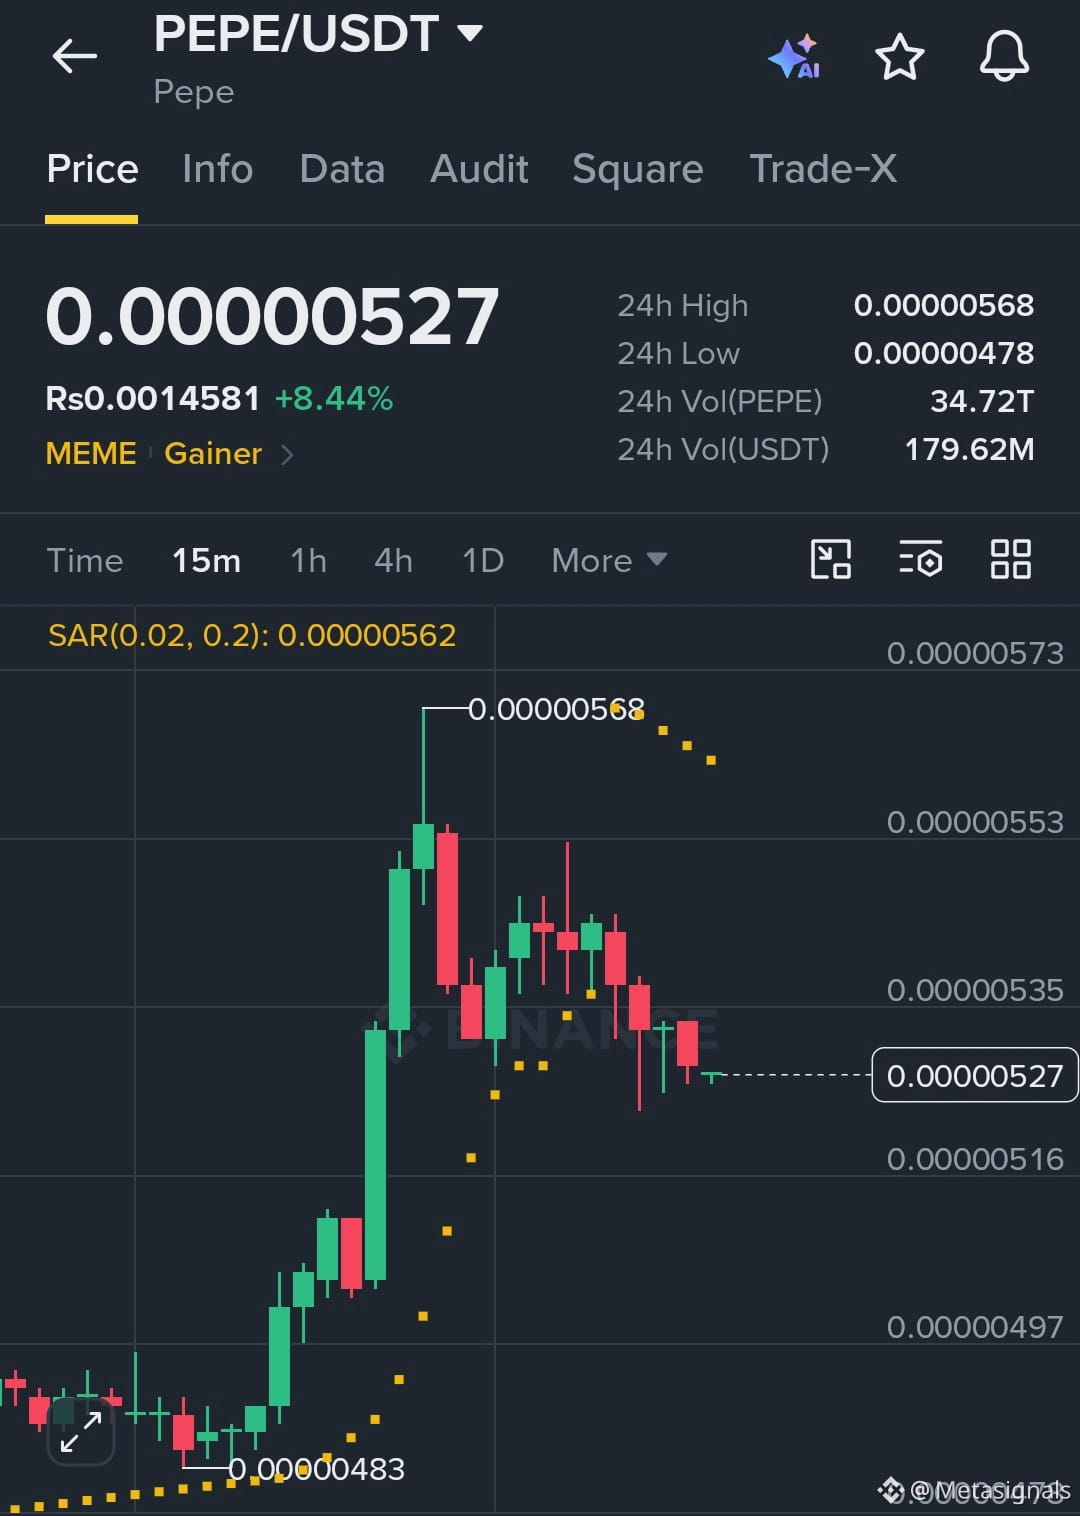
🚀 $PEPE IS READY FOR ITS NEXT MOVE 🐸
💚 Up 8.44% with $179M+ in 24H trading volume
🐂 Bulls, are you ready for the next breakout👀
🎯 Watch the $0.00000568 resistance — a breakout could spark another rally
⚠️ Trade smart. Confirm before you buy!
#PEPE #Crypto
#FedWatch
#EarningsSeason
#USMidtermElections
$PEPE
{spot}(PEPEUSDT)
🚀 $PEPE IS READY FOR ITS NEXT MOVE 🐸
💚 Up 8.44% with $179M+ in 24H trading volume
🐂 Bulls, are you ready for the next breakout👀
🎯 Watch the $0.00000568 resistance — a breakout could spark another rally
⚠️ Trade smart. Confirm before you buy!
#PEPE #Crypto
#FedWatch
#EarningsSeason
#USMidtermElections
$PEPE
💚 Up 8.44% with $179M+ in 24H trading volume
🐂 Bulls, are you ready for the next breakout👀
🎯 Watch the $0.00000568 resistance — a breakout could spark another rally
⚠️ Trade smart. Confirm before you buy!
#PEPE #Crypto
#FedWatch
#EarningsSeason
#USMidtermElections
$PEPE
395

🐸 Can $PEPE Reach $1? 🐋 Can $WHITEWHALE Reach $1? 🚀
The crypto community is always searching for the next big opportunity! 🌕🔥
🐸 $PEPE — Can this meme coin surprise the market? 🐋 $WHITEWHALE — Could it gain more attention and momentum?
💎 Which one has greater potential in the next bull run?
👇 Share your prediction in the comments!
🚀 $PEPE or 🐋 $WHITEWHALE — Which one are you watching?
⚠️ Crypto is highly volatile. Reaching $1 is not guaranteed. Always do your own research (DYOR) before investing.
#PEPE #WHITEWHALE #Crypto #MemeCoins #CryptoCommunity #Altcoins #BullRun


Beryl Dravland
·
--
🐸 Can $PEPE reach $1?
🐋 Can $WhiteWhale reach $1?
🐿️ Can $PNUT reach $1?
🐧 Can $PENGU reach $1?
The only one that can reach $5 is WhiteWhale
🐋 Can $WhiteWhale reach $1?
🐿️ Can $PNUT reach $1?
🐧 Can $PENGU reach $1?
The only one that can reach $5 is WhiteWhale
1
164
Войдите, чтобы посмотреть больше материала
Присоединяйтесь к пользователям криптовалют по всему миру на Binance Square
⚡️ Получайте новейшую и полезную информацию о криптоактивах.
💬 Нам доверяет крупнейшая в мире криптобиржа.
👍 Получите достоверные аналитические данные от верифицированных создателей контента.
Эл. почта/номер телефона
В тренде
1
#EarningsSeason
Просмотров: 6.6M
32,959 обсуждают
2
#USMidtermElections
Просмотров: 80,468
1,059 обсуждают
3
#StrategySTRCReaches$99.95ForFirstTimeIn165Days
Просмотров: 391
24 обсуждают
4
#BinanceWillListPredictPREDICT
Просмотров: 8,879
301 обсуждают
5
#SwitzerlandFirstSpotBitcoinETFExpectedToTradeInNovember
Просмотров: 531
38 обсуждают
6
#StrategyReports$21BQ3OperatingProfit
Просмотров: 350
24 обсуждают
7
#TwoAddressesHoldingAbout1.28BUSDTFrozen
Просмотров: 2,967
130 обсуждают
8
#FirstDigitalBlacklistsAttackerAddressHoldingAbout3.4MFDUSD
Просмотров: 195
8 обсуждают
9
#BitcoinDropsBelow$80K
Просмотров: 59,278
153 обсуждают
10
#BoEOpensConsultationOnTokenizedCollateralForClearing
Просмотров: 2,009
41 обсуждают