

#follow4more
follow4more
Просмотров: 2.7M
8,567 обсуждают
Популярные
Новые

·
--
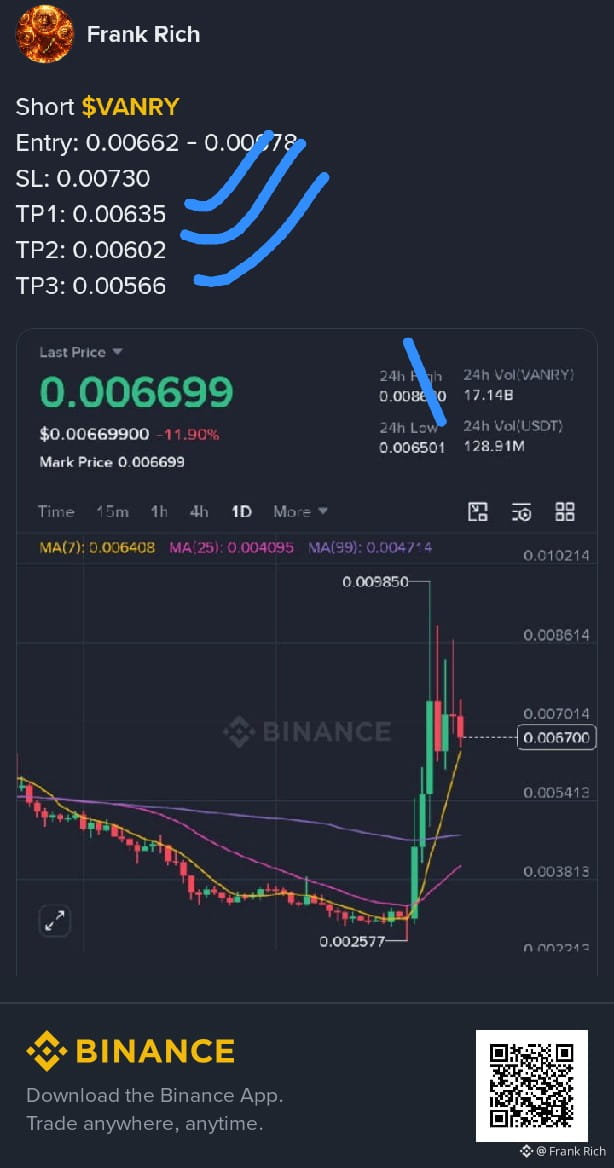
Congratulations to my follows all target 🎯 hitted 🔥💯 #VANRYUSDT $VANRY #Follow4more
Congratulations to my follows all target 🎯 hitted 🔥💯 #VANRYUSDT $VANRY #Follow4more
261


Статья
"Support & Resistance: How I Learned the Hard Way"What Is Support and Resistance? The Lesson That Cost Me Money
I still remember my third month of trading. A coin was pumping like crazy, green candles were everywhere, and people online were convinced it was about to explode. I had around $300 in my trading account, which felt like a fortune back then. So, naturally, I did what every overexcited beginner shouldn't do. I bought almost all in.
For the first few hours, everything looked perfect. Price moved slightly higher, and I was already calculating imaginary profits. Then it dropped. I told myself it was just a small correction, nothing serious. But the next morning, it dropped again, and suddenly those imaginary profits didn't seem so funny.
A few days later, price climbed back toward my entry. I felt relieved, thinking I was finally getting another chance. But just as it reached my buying price, sellers pushed it down again. The same thing happened a few days later, then again the following week. Four attempts, four rejections, and somehow I still believed the fifth one would make me rich.
Eventually, I sold at a loss. I blamed whales, market manipulation, and even the exchange for my terrible timing. Looking back, I can laugh about it now, but that loss genuinely hurt. The embarrassing part? The chart was warning me the whole time. I just didn't understand what it was saying.
Why does price keep stopping at the same place?
Imagine you're bouncing a ball inside a room. When you throw it toward the floor, it hits the ground and bounces back up. When it reaches the ceiling, it gets pushed down again. That's a simple way to understand support and resistance in trading. One acts like a floor, while the other behaves like a ceiling.
Support is a price area where buyers have previously shown enough interest to slow down or stop a decline. Resistance is the opposite, an area where sellers have repeatedly stepped in and stopped price from climbing higher. These levels aren't magical numbers. They're simply places where buying and selling pressure have created noticeable reactions before.
For example, imagine $BTC keeps falling toward $60,000 but bounces whenever it reaches that area. After seeing this happen several times, traders begin watching $60,000 as potential support. Now imagine Bitcoin repeatedly climbs toward $65,000 but struggles to move above it. That area may become resistance because sellers keep appearing there.
The mistake I made was buying directly below resistance without even realizing it. I thought a rising price meant more upside was guaranteed. But every time my coin approached that same level, sellers were waiting. I wasn't unlucky because the price stopped climbing. I was inexperienced because I never bothered to ask why.
Why do traders keep reacting at these levels?
Here's something that took me longer to understand than it should have. Support and resistance aren't really about lines drawn on a chart. They're about people. More specifically, they're about memory, fear, greed, and regret. Traders remember prices where they made money, lost money, or missed opportunities.
Imagine buying a coin at $10 because you're convinced it will reach $15. Instead, it crashes to $6, leaving you staring at a painful loss. For weeks, you keep checking the chart, hoping for a recovery. Then one day, the price finally returns to $10. What's your first thought? Probably something like, "Just let me get my money back."
So you sell. But thousands of other traders might be thinking exactly the same thing. As price approaches $10, more people start selling to escape their losing positions. That selling pressure can make it difficult for price to move higher. Suddenly, the same area becomes resistance, not because of some mysterious force, but because people remember getting hurt there.
Support can develop through similar behavior. Traders remember where price bounced before, and some place buy orders there expecting another recovery. Others who missed the previous bounce don't want to miss the next one. When enough buyers show up, price may react again. It's almost like the market has a memory, but really, it's the people trading it.
What happens when the wall finally breaks?
This is where things get interesting. Support and resistance don't last forever, even when they've held several times. Sometimes buyers become strong enough to push through resistance. Other times, sellers overwhelm the buyers defending support. And when that happens, something surprising can follow.
Imagine a coin repeatedly struggles to break above $10. After several failed attempts, strong buying finally pushes it toward $11. Later, price pulls back toward $10, but instead of falling through, buyers step in. The old resistance has now become potential support. It's like breaking through a ceiling and discovering that the same ceiling is now the floor beneath your feet.
The opposite can happen when support breaks. A price that previously attracted buyers may start attracting sellers when the market returns to it. Traders who bought near the old support might sell just to escape their losses. That's how former support can turn into resistance. Same price area, completely different reaction.
But there's one warning I wish someone had given me earlier. Not every breakout is real, and support or resistance isn't an exact line. Sometimes price briefly breaks through a level, attracts excited traders, and then reverses sharply. These fake breakouts have trapped me more times than I'd like to admit. That's why I now think of support and resistance as zones rather than perfect numbers.
These days, before entering a trade, I look left on the chart and check where price struggled before. I pay attention to previous bounces, repeated rejections, and how price behaves around those areas. I don't assume every support will hold or every resistance will break. I still lose trades sometimes, but at least I'm no longer buying blindly into the same wall that hurt me years ago.
My biggest lesson? The market often gives us warnings long before we learn how to recognize them.
Which support or resistance level has burned you the most? 😅
Not financial advice. #dyor
#TradingTales #Write2Earn!
#Follow4more #nohaexpertofcrypto
$BTC
{future}(BTCUSDT)
"Support & Resistance: How I Learned the Hard Way"
What Is Support and Resistance? The Lesson That Cost Me Money
I still remember my third month of trading. A coin was pumping like crazy, green candles were everywhere, and people online were convinced it was about to explode. I had around $300 in my trading account, which felt like a fortune back then. So, naturally, I did what every overexcited beginner shouldn't do. I bought almost all in.
For the first few hours, everything looked perfect. Price moved slightly higher, and I was already calculating imaginary profits. Then it dropped. I told myself it was just a small correction, nothing serious. But the next morning, it dropped again, and suddenly those imaginary profits didn't seem so funny.
A few days later, price climbed back toward my entry. I felt relieved, thinking I was finally getting another chance. But just as it reached my buying price, sellers pushed it down again. The same thing happened a few days later, then again the following week. Four attempts, four rejections, and somehow I still believed the fifth one would make me rich.
Eventually, I sold at a loss. I blamed whales, market manipulation, and even the exchange for my terrible timing. Looking back, I can laugh about it now, but that loss genuinely hurt. The embarrassing part? The chart was warning me the whole time. I just didn't understand what it was saying.
Why does price keep stopping at the same place?
Imagine you're bouncing a ball inside a room. When you throw it toward the floor, it hits the ground and bounces back up. When it reaches the ceiling, it gets pushed down again. That's a simple way to understand support and resistance in trading. One acts like a floor, while the other behaves like a ceiling.
Support is a price area where buyers have previously shown enough interest to slow down or stop a decline. Resistance is the opposite, an area where sellers have repeatedly stepped in and stopped price from climbing higher. These levels aren't magical numbers. They're simply places where buying and selling pressure have created noticeable reactions before.
For example, imagine $BTC keeps falling toward $60,000 but bounces whenever it reaches that area. After seeing this happen several times, traders begin watching $60,000 as potential support. Now imagine Bitcoin repeatedly climbs toward $65,000 but struggles to move above it. That area may become resistance because sellers keep appearing there.
The mistake I made was buying directly below resistance without even realizing it. I thought a rising price meant more upside was guaranteed. But every time my coin approached that same level, sellers were waiting. I wasn't unlucky because the price stopped climbing. I was inexperienced because I never bothered to ask why.
Why do traders keep reacting at these levels?
Here's something that took me longer to understand than it should have. Support and resistance aren't really about lines drawn on a chart. They're about people. More specifically, they're about memory, fear, greed, and regret. Traders remember prices where they made money, lost money, or missed opportunities.
Imagine buying a coin at $10 because you're convinced it will reach $15. Instead, it crashes to $6, leaving you staring at a painful loss. For weeks, you keep checking the chart, hoping for a recovery. Then one day, the price finally returns to $10. What's your first thought? Probably something like, "Just let me get my money back."
So you sell. But thousands of other traders might be thinking exactly the same thing. As price approaches $10, more people start selling to escape their losing positions. That selling pressure can make it difficult for price to move higher. Suddenly, the same area becomes resistance, not because of some mysterious force, but because people remember getting hurt there.
Support can develop through similar behavior. Traders remember where price bounced before, and some place buy orders there expecting another recovery. Others who missed the previous bounce don't want to miss the next one. When enough buyers show up, price may react again. It's almost like the market has a memory, but really, it's the people trading it.
What happens when the wall finally breaks?
This is where things get interesting. Support and resistance don't last forever, even when they've held several times. Sometimes buyers become strong enough to push through resistance. Other times, sellers overwhelm the buyers defending support. And when that happens, something surprising can follow.
Imagine a coin repeatedly struggles to break above $10. After several failed attempts, strong buying finally pushes it toward $11. Later, price pulls back toward $10, but instead of falling through, buyers step in. The old resistance has now become potential support. It's like breaking through a ceiling and discovering that the same ceiling is now the floor beneath your feet.
The opposite can happen when support breaks. A price that previously attracted buyers may start attracting sellers when the market returns to it. Traders who bought near the old support might sell just to escape their losses. That's how former support can turn into resistance. Same price area, completely different reaction.
But there's one warning I wish someone had given me earlier. Not every breakout is real, and support or resistance isn't an exact line. Sometimes price briefly breaks through a level, attracts excited traders, and then reverses sharply. These fake breakouts have trapped me more times than I'd like to admit. That's why I now think of support and resistance as zones rather than perfect numbers.
These days, before entering a trade, I look left on the chart and check where price struggled before. I pay attention to previous bounces, repeated rejections, and how price behaves around those areas. I don't assume every support will hold or every resistance will break. I still lose trades sometimes, but at least I'm no longer buying blindly into the same wall that hurt me years ago.
My biggest lesson? The market often gives us warnings long before we learn how to recognize them.
Which support or resistance level has burned you the most? 😅
Not financial advice. #dyor
#TradingTales #Write2Earn!
#Follow4more #nohaexpertofcrypto
$BTC
125

·
--
🔥 LET’S HIT 200 FOLLOWERS TOGETHER! 🚀
❤️ Follow me and I’ll follow you back!!! ❤️🩹❤️🩹
✅ Follow 💬 Comment “DONE” 🔔
LET’S REACH 200 FOLLOWERS! 🚀🔥
#Folow #followforfollowback #CryptoCommunty #BTC #Follow4more
🔥 LET’S HIT 200 FOLLOWERS TOGETHER! 🚀
❤️ Follow me and I’ll follow you back!!! ❤️🩹❤️🩹
✅ Follow 💬 Comment “DONE” 🔔
LET’S REACH 200 FOLLOWERS! 🚀🔥
#Folow #followforfollowback #CryptoCommunty #BTC #Follow4more
❤️ Follow me and I’ll follow you back!!! ❤️🩹❤️🩹
✅ Follow 💬 Comment “DONE” 🔔
LET’S REACH 200 FOLLOWERS! 🚀🔥
#Folow #followforfollowback #CryptoCommunty #BTC #Follow4more

srmritunjay:
Done
42
7
206

·
--
$BTC
{spot}(BTCUSDT)
📊 Bitcoin (BTC): What Should Traders Watch Next? 🚀
Bitcoin traders should focus on market structure, support and resistance, and volume before making any trading decisions.
🔹 Market Structure: Is BTC making higher highs or lower lows?
🔹 Support & Resistance: Watch important price levels for possible reactions.
🔹 Order Blocks: Look for areas where strong buying or selling previously occurred.
🔹 Risk Management: Always use a clear trading plan and avoid emotional decisions.
Remember: No setup guarantees profit. Always do your own research before trading.
💬 What do you think about BTC? Bullish 📈 or Bearish 📉? Share your analysis below!
#Bitcoin #BTC #Crypto #BinanceSquare #trading #FedWatch #TipMeAndRich #Follow4more
$BTC
📊 Bitcoin (BTC): What Should Traders Watch Next? 🚀
Bitcoin traders should focus on market structure, support and resistance, and volume before making any trading decisions.
🔹 Market Structure: Is BTC making higher highs or lower lows?
🔹 Support & Resistance: Watch important price levels for possible reactions.
🔹 Order Blocks: Look for areas where strong buying or selling previously occurred.
🔹 Risk Management: Always use a clear trading plan and avoid emotional decisions.
Remember: No setup guarantees profit. Always do your own research before trading.
💬 What do you think about BTC? Bullish 📈 or Bearish 📉? Share your analysis below!
#Bitcoin #BTC #Crypto #BinanceSquare #trading #FedWatch #TipMeAndRich #Follow4more
55

·
--
Рост
What about this quote says !
Everything is risk
The minute you were born
it was risk, starting your own project is risk, going to University is risk, getting married is risk, it's all risk.
Then this quote close with these words ! ( WAIT UNTIL THE END AND SEE BEING GIVEN THE BILL OFF NOT TRYING )
#Follow4more #CanMicrosoftDeliverOnAI
$XAU
{future}(XAUUSDT)
What about this quote says !
Everything is risk
The minute you were born
it was risk, starting your own project is risk, going to University is risk, getting married is risk, it's all risk.
Then this quote close with these words ! ( WAIT UNTIL THE END AND SEE BEING GIVEN THE BILL OFF NOT TRYING )
#Follow4more #CanMicrosoftDeliverOnAI
$XAU
120

·
--
$ZEC: Trading at $1,248.78; 30-day change: -11.89%. Neutral/mixed amid competing signals.
Fundamentals and valuation
Core driver: The FOMC held its federal funds target at 3.75%–4.00%, while two officials favored a 25bps hike. Grayscale’s Zcash Trust recorded $41.09M in inflows over four consecutive days after three weeks of withdrawals, countering continued rate restraint with renewed institutional interest.
Valuation and flows: ZEC’s $21.18B market capitalization and 4.03% turnover contrast with an FDV ratio of 1.24, indicating FDV above market cap and a potential token-unlock overhang. Daily large-order net flow was -$5.11M. Taker buyers accounted for 47% of volume and large-order buyers for 33%.
Trend and technicals
Key levels: The price is below the MA60 benchmark at $1,260.82 and above the MA20 at $1,215.56. A daily close below the latter would weaken the near-term recovery structure.
$ZEC #CryptoPatience #Follow4more #BinanceSquareFamily
{spot}(ZECUSDT)
$ZEC : Trading at $1,248.78; 30-day change: -11.89%. Neutral/mixed amid competing signals.
Fundamentals and valuation
Core driver: The FOMC held its federal funds target at 3.75%–4.00%, while two officials favored a 25bps hike. Grayscale’s Zcash Trust recorded $41.09M in inflows over four consecutive days after three weeks of withdrawals, countering continued rate restraint with renewed institutional interest.
Valuation and flows: ZEC’s $21.18B market capitalization and 4.03% turnover contrast with an FDV ratio of 1.24, indicating FDV above market cap and a potential token-unlock overhang. Daily large-order net flow was -$5.11M. Taker buyers accounted for 47% of volume and large-order buyers for 33%.
Trend and technicals
Key levels: The price is below the MA60 benchmark at $1,260.82 and above the MA20 at $1,215.56. A daily close below the latter would weaken the near-term recovery structure.
$ZEC #CryptoPatience #Follow4more #BinanceSquareFamily

1
271

·
--
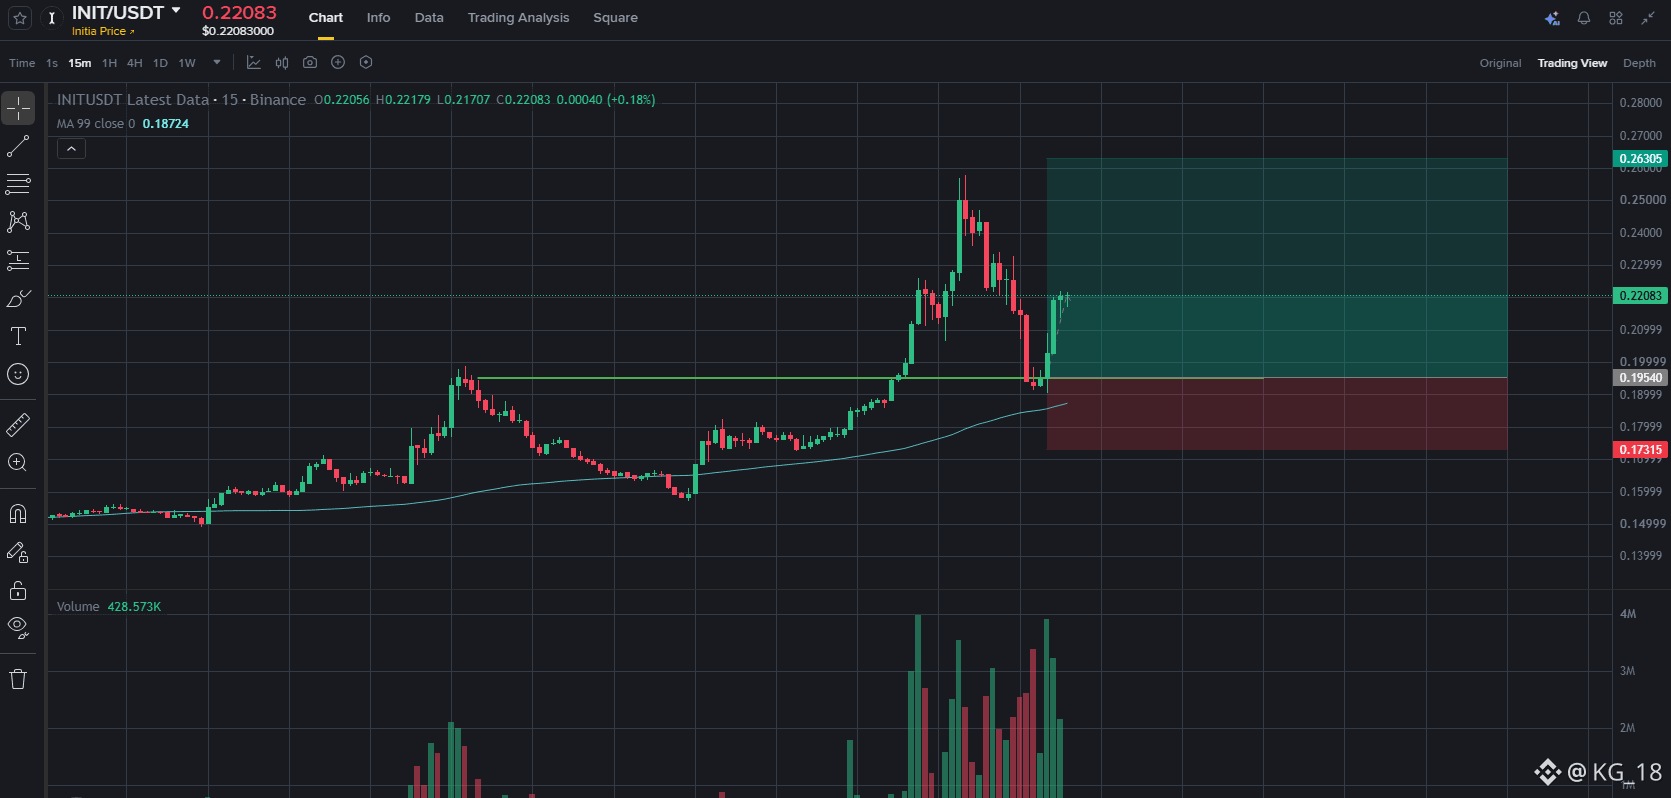
Halfway through the target and looking clean...📈✨
The setup on $INIT is moving just like script, comfortably in profit and halfway to the full target zone. Are you still doubting? Follow and stay active.
#BinanceSquareFamily #INIT #cryptotrading #Follow4more #FollowYourBrotherForMore
{future}(INITUSDT)
Halfway through the target and looking clean...📈✨
The setup on $INIT is moving just like script, comfortably in profit and halfway to the full target zone. Are you still doubting? Follow and stay active.
#BinanceSquareFamily #INIT #cryptotrading #Follow4more #FollowYourBrotherForMore
The setup on $INIT is moving just like script, comfortably in profit and halfway to the full target zone. Are you still doubting? Follow and stay active.
#BinanceSquareFamily #INIT #cryptotrading #Follow4more #FollowYourBrotherForMore
135
·
--
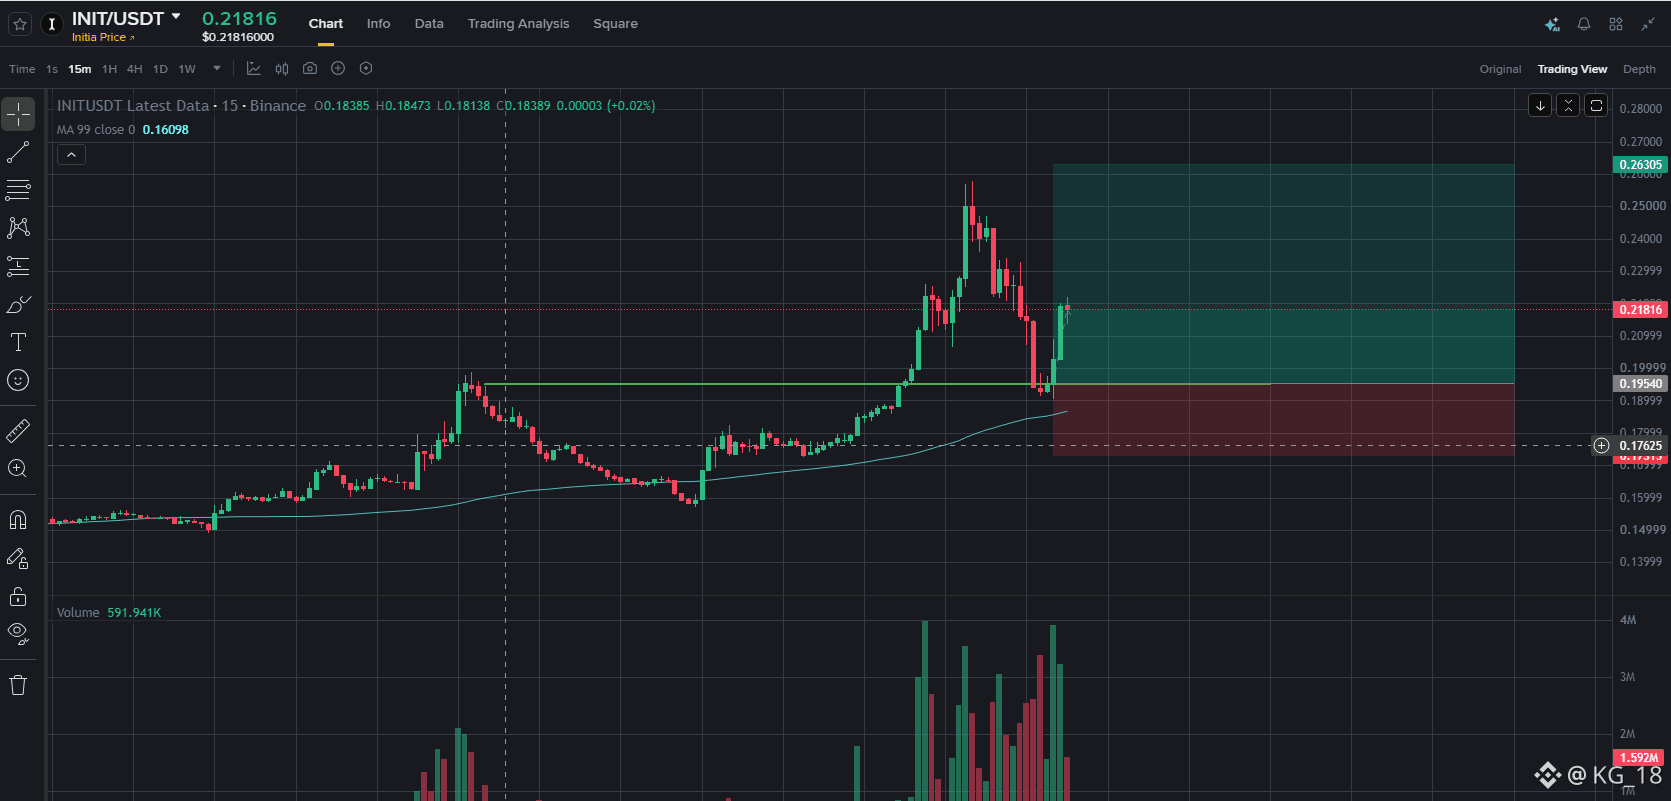
It's gonna do like movie, you watch or join by following and staying clued to count your blessing one by one with @Kobby_Gabuna18 .
Stuck in profit with $INIT trade with took with the #BinanceSquareFamily
Following #Follow4more .#FollowYourBrotherForMore .#Follow_Like_Comment .#FollowMeAndGetReward
{future}(INITUSDT)
It's gonna do like movie, you watch or join by following and staying clued to count your blessing one by one with @KG_18 .
Stuck in profit with $INIT trade with took with the #BinanceSquareFamily
Following #Follow4more .#FollowYourBrotherForMore .#Follow_Like_Comment .#FollowMeAndGetReward
Stuck in profit with $INIT trade with took with the #BinanceSquareFamily
Following #Follow4more .#FollowYourBrotherForMore .#Follow_Like_Comment .#FollowMeAndGetReward
150

·
--
Рост
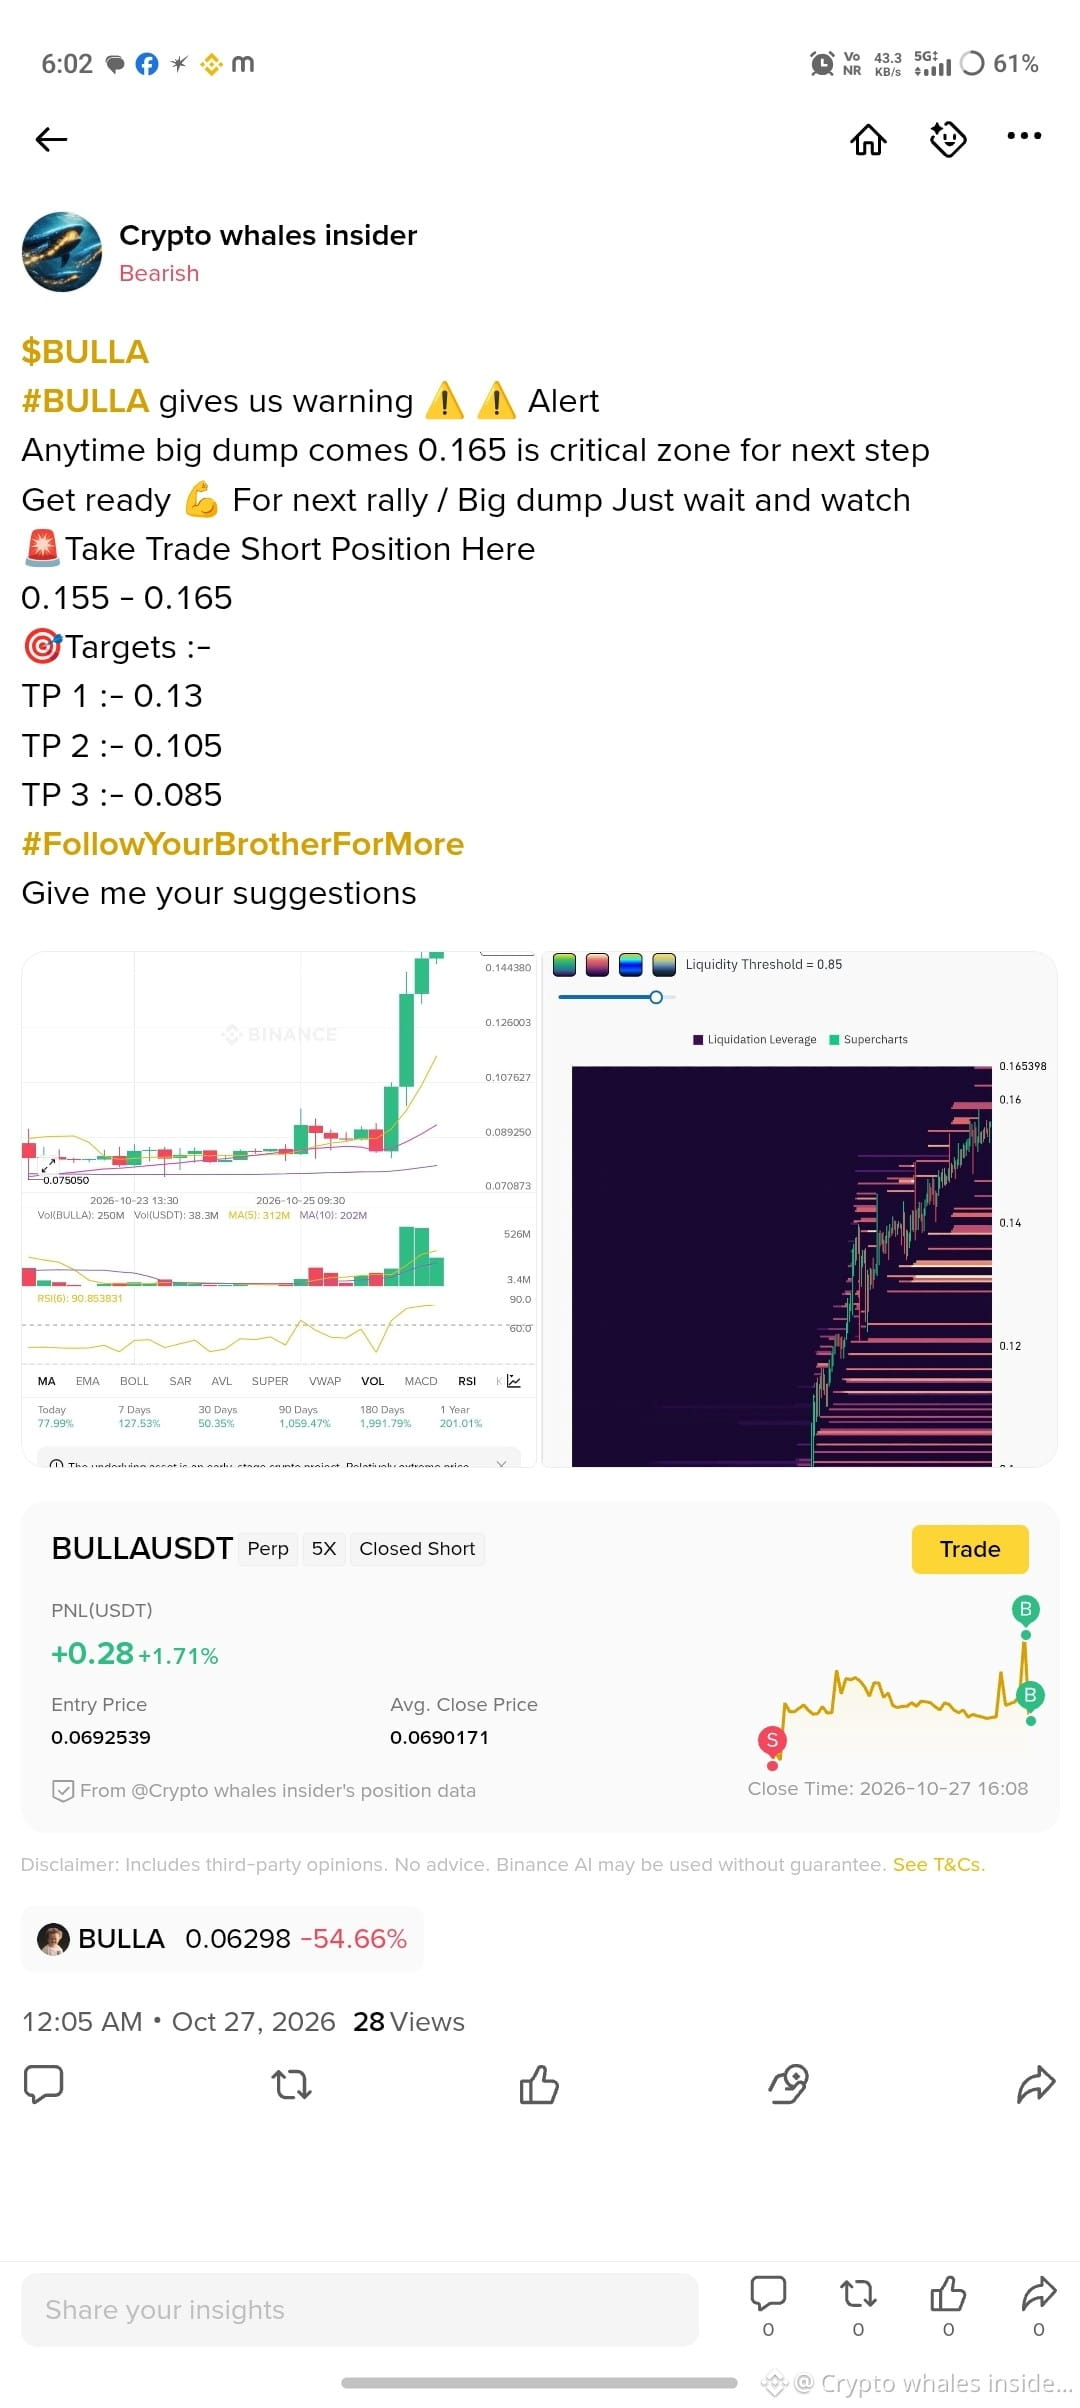
I don't know why I get this wrong position yesterday it was ok and was in profits and today's it's shown in losss why??
what should I do????$AKE $PIPPIN #TrendingPredictions #Market_Update #FOMCWatch #viralmypost #Follow4more
I don't know why I get this wrong position yesterday it was ok and was in profits and today's it's shown in losss why??
what should I do????$AKE $PIPPIN #TrendingPredictions #Market_Update #FOMCWatch #viralmypost #Follow4more
what should I do????$AKE $PIPPIN #TrendingPredictions #Market_Update #FOMCWatch #viralmypost #Follow4more
Jacqualine Pinder AkDJ:
0.02除以0.00017等于多少总会算吧!
庄家还有一百倍的利润居然还做多?
1
484


·
--
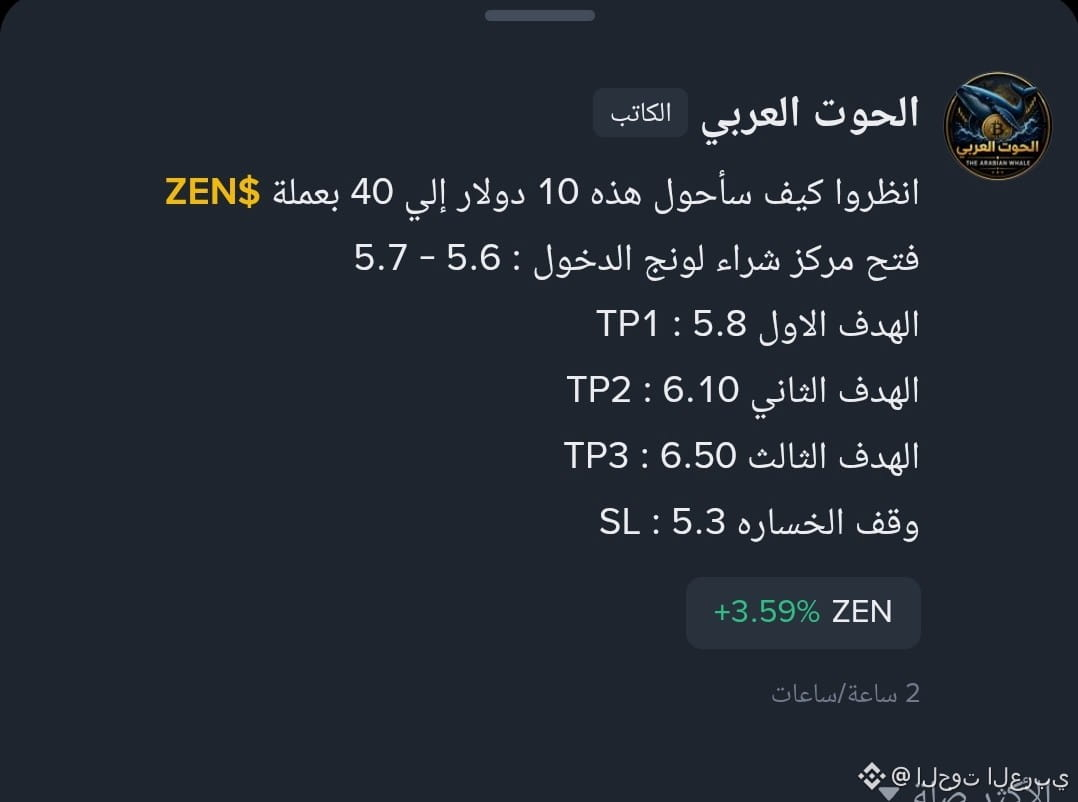
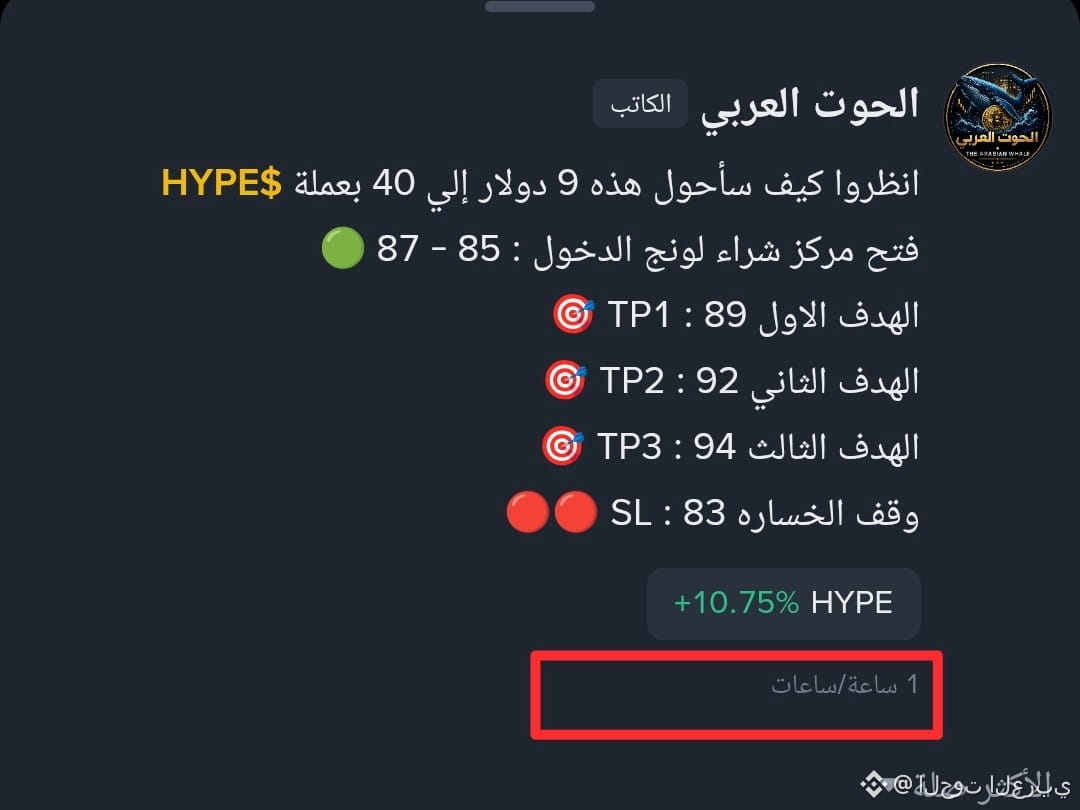
قمت بنشر صفقات شراء اليوم بعملة $HYPE & $ZEN
🎯صفقة وصلت 3 اهداف و اكثر
🎯صفقة وصلت هدفين و اكثر
لو عايز صفقات ناجحه #تابعني
#Follow4more #followandearn
قمت بنشر صفقات شراء اليوم بعملة $HYPE & $ZEN
🎯صفقة وصلت 3 اهداف و اكثر
🎯صفقة وصلت هدفين و اكثر
لو عايز صفقات ناجحه #تابعني
#Follow4more #followandearn
🎯صفقة وصلت 3 اهداف و اكثر
🎯صفقة وصلت هدفين و اكثر
لو عايز صفقات ناجحه #تابعني
#Follow4more #followandearn
2
175

·
--
Рост
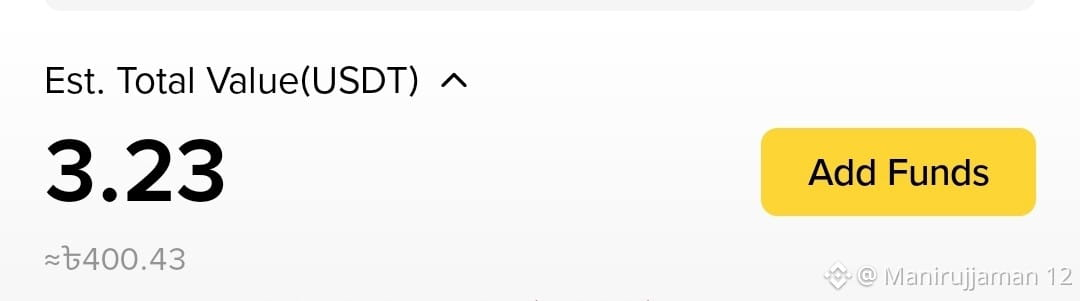
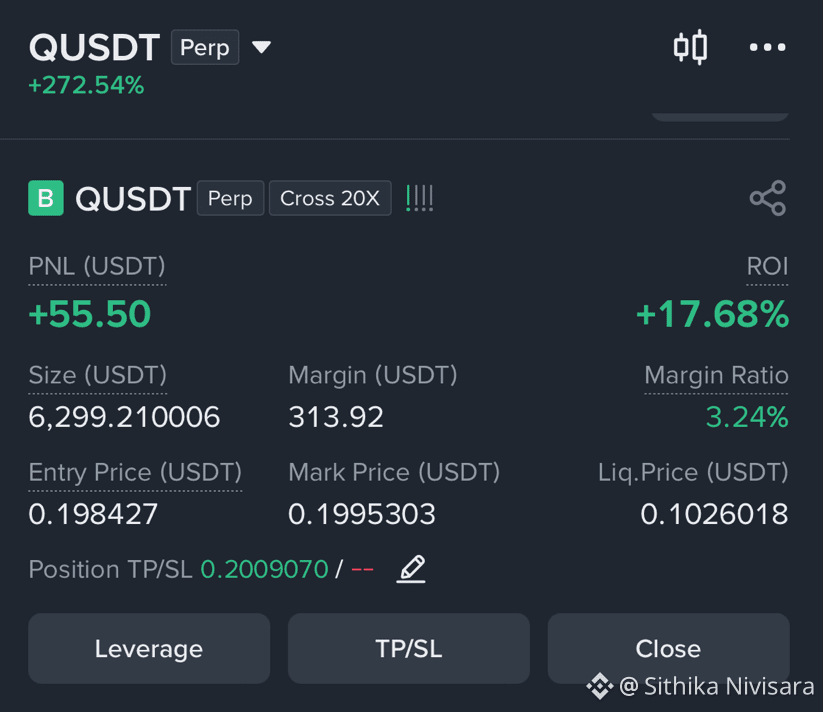
Stay Follow me —10 lucky winners will each receive a $3 gift. #eveyone #Follow4more #gift_time #3 #EarningsSeason $USDT
Stay Follow me —10 lucky winners will each receive a $3 gift. #eveyone #Follow4more #gift_time #3 #EarningsSeason $USDT
1
1
66


108
·
--
What if we all bought just 1 $SOL, held it, and forgot about it? 😂🚀 Imagine checking back years later and seeing it worth thousands! 💎🔥 Just 1 SOL, zero stress, and a dream! WHO’S IN? 👀🙌$SOL #EarningsSeason #BinancePick #Follow4more
What if we all bought just 1 $SOL , held it, and forgot about it? 😂🚀 Imagine checking back years later and seeing it worth thousands! 💎🔥 Just 1 SOL, zero stress, and a dream! WHO’S IN? 👀🙌$SOL #EarningsSeason #BinancePick #Follow4more

128
·
--
Падение
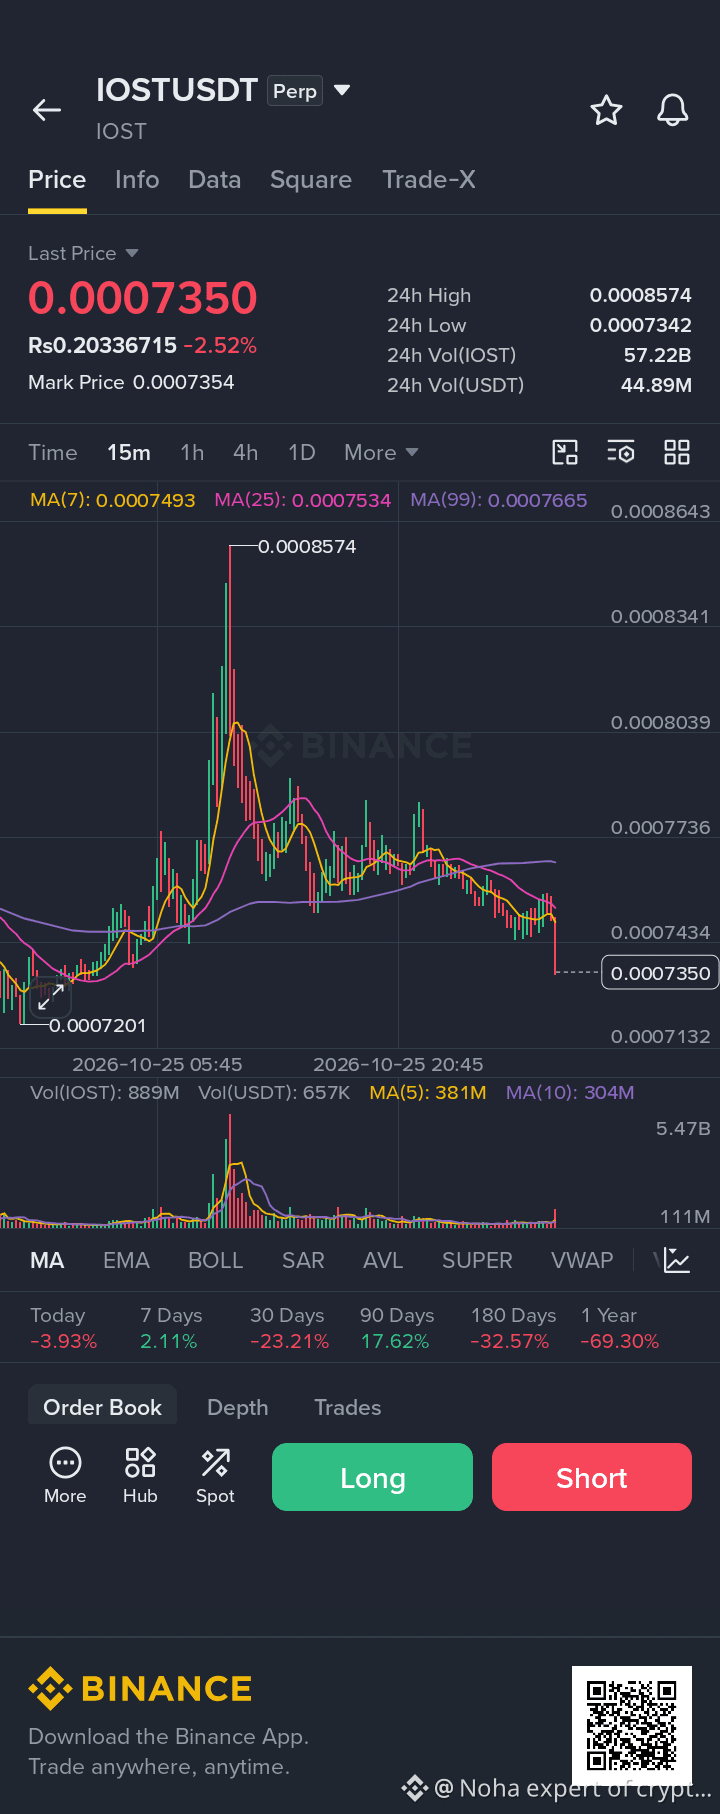
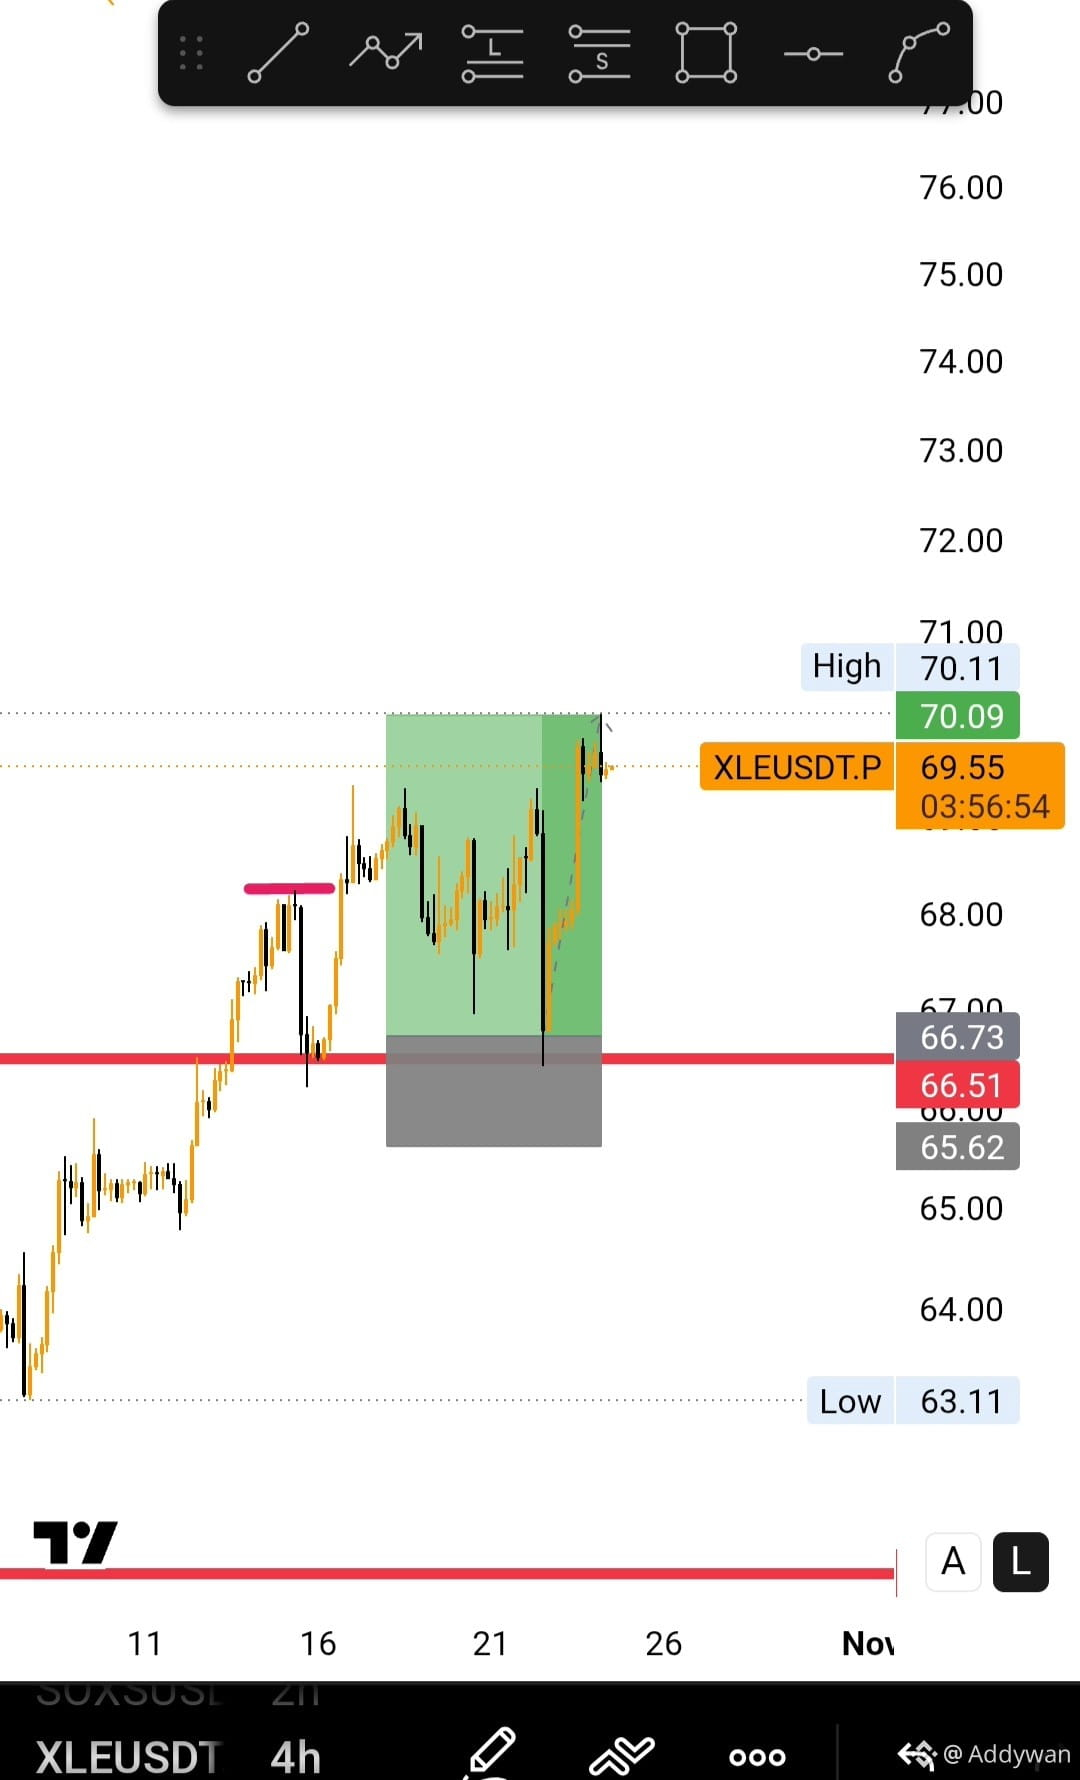
go short here $IOST
{future}(IOSTUSDT)
it I'll dump towrd 0.00073
target 2: 0.000725
#TradingTales #signals #Write2Earn
#Follow4more #nohaexpertofcrypto
go short here $IOST
it I'll dump towrd 0.00073
target 2: 0.000725
#TradingTales #signals #Write2Earn
#Follow4more #nohaexpertofcrypto
it I'll dump towrd 0.00073
target 2: 0.000725
#TradingTales #signals #Write2Earn
#Follow4more #nohaexpertofcrypto
582


·
--
Рост
🚀 BIGTIME, REZ & PARTI — BULLISH WATCHLIST! 🔥
💚 $BIGTIME $REZ & $PARTI are on my radar for potential bullish moves!
📈 Watching these three altcoins closely for a possible recovery and fresh momentum.
⚡ Patience, smart research, and the right strategy matter in this volatile market.
🎯 Keep watching, stay focused, and never ignore risk management.
🤝 Follow me for more daily crypto updates, bullish watchlists & hidden alpha opportunities! 🚀
❤️ Like • 💬 Comment • 🔁 Share
Let’s grow together and build a strong crypto community! 💎🔥
#altcoins #CryptoPatience #BinanceSquareFamily
#Binance #Follow4more

2
577



Binance News
·
--
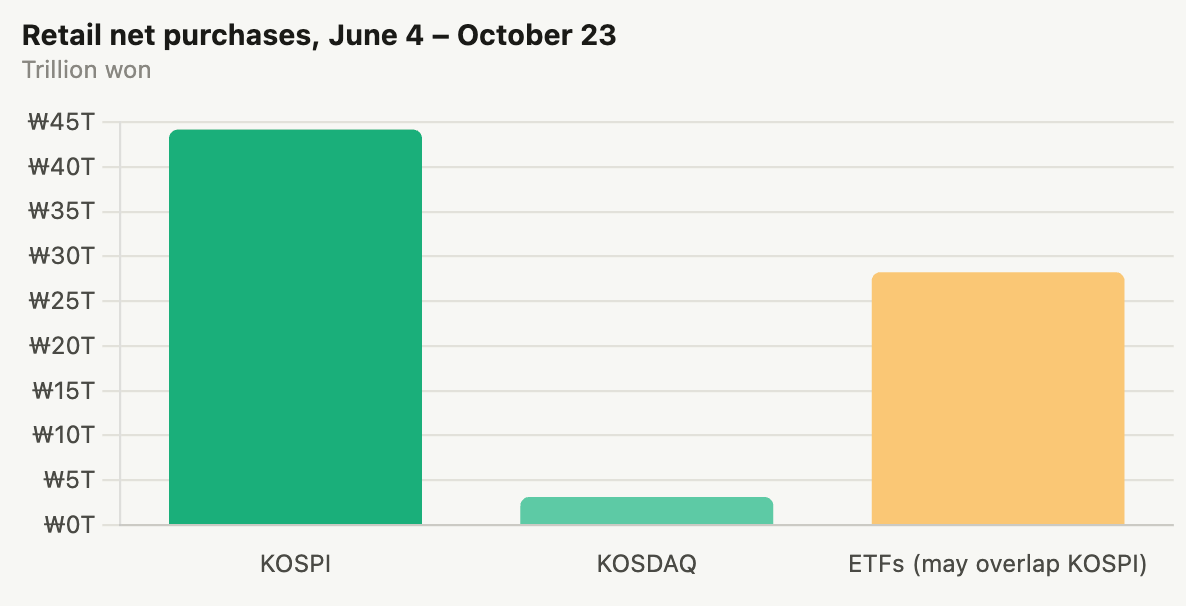
TradFi News | Korean Investor Deposits Fall 36.5% From Their June Peak to ₩88.7 Trillion as Retail Keeps Buying the KOSPI Slide
Investor deposits at South Korean securities firms fell to ₩88.68 trillion on October 22, down ₩51.01 trillion, or 36.5%, from a record ₩139.69 trillion on June 4, according to the Korea Financial Investment Association. The balance dropped below ₩90 trillion on October 21 for the first time in about nine months, returning to early-2026 levels.The decline largely reflects cash being spent on stocks rather than leaving the market. From June 4 to October 23, individual investors were net buyers of ₩44.17 trillion on KOSPI and ₩3.15 trillion on KOSDAQ, plus ₩28.25 trillion of ETFs. Unlike the first half of the year, new deposits have not kept pace with that spending. The KOSPI closed at 5,533.77 on October 22, 39.3% below its June record close.
2
Войдите, чтобы посмотреть больше материала
Присоединяйтесь к пользователям криптовалют по всему миру на Binance Square
⚡️ Получайте новейшую и полезную информацию о криптоактивах.
💬 Нам доверяет крупнейшая в мире криптобиржа.
👍 Получите достоверные аналитические данные от верифицированных создателей контента.
Эл. почта/номер телефона
В тренде
1
#$1.5BInLeveragedCryptoBetsLiquidated
Просмотров: 4,301
66 обсуждают
2
#KOSPIFalls3.53%BackBelow6000
Просмотров: 8,981
287 обсуждают
3
#USMidtermElections
Просмотров: 124,332
1,556 обсуждают
4
#StrategySTRCReaches$99.95ForFirstTimeIn165Days
Просмотров: 2,411
64 обсуждают
5
#BinanceWillListPredictPREDICT
Просмотров: 35,018
732 обсуждают
6
#SwitzerlandFirstSpotBitcoinETFExpectedToTradeInNovember
Просмотров: 1,420
76 обсуждают
7
#StrategyReports$21BQ3OperatingProfit
Просмотров: 1,434
43 обсуждают
8
#TwoAddressesHoldingAbout1.28BUSDTFrozen
Просмотров: 17,627
425 обсуждают
9
#FirstDigitalBlacklistsAttackerAddressHoldingAbout3.4MFDUSD
Просмотров: 622
18 обсуждают
10
#BitcoinDropsBelow$80K
Просмотров: 73,502
174 обсуждают