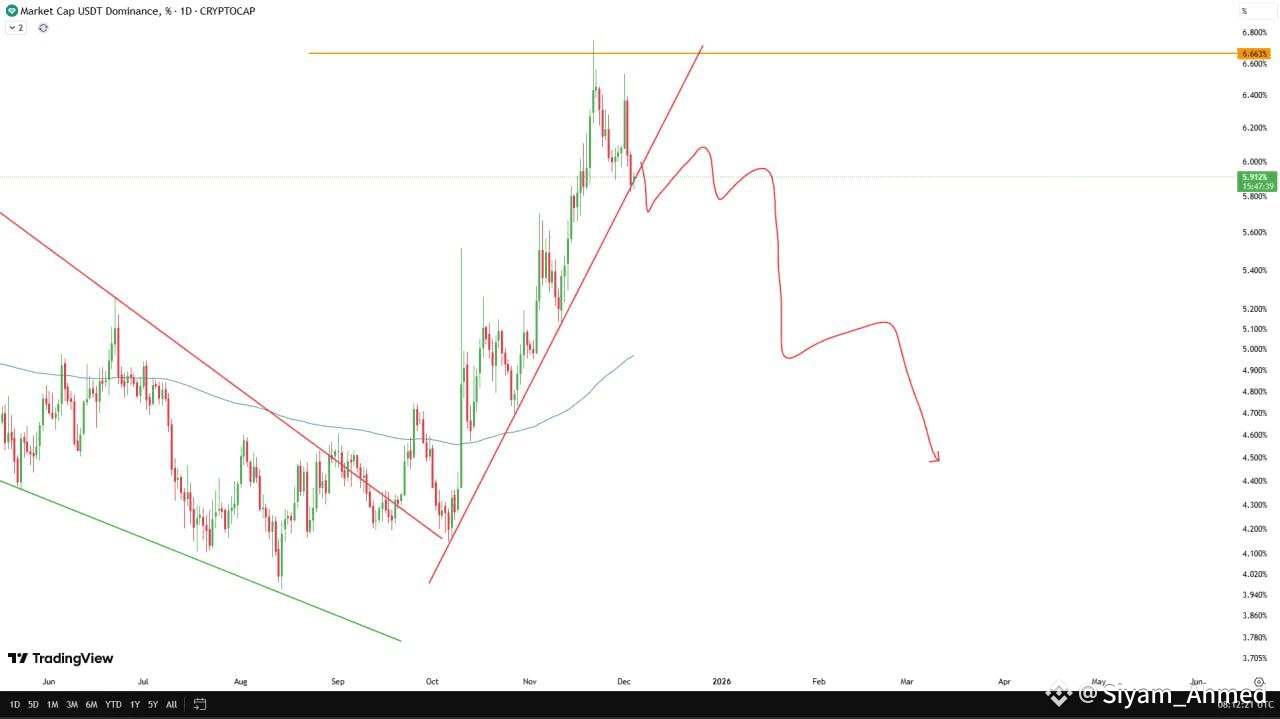
The USDT Dominance Index ($USDT.D) is currently trading along a crucial ascending trendline on the daily chart. After a strong upward move, dominance is showing signs of exhaustion near the resistance zone. If this trendline fails to hold and a clean breakdown occurs, it may signal the beginning of a bearish trend for USDT dominance.
A decline in USDT.D typically indicates that stablecoin liquidity is flowing back into cryptocurrencies, increasing buying pressure across the market. This scenario often aligns with altcoin rallies and strong upward momentum in major assets like BTC and ETH.
If the trendline break is confirmed, traders can expect a broader market recovery and potential bullish waves in the coming weeks. However, a bounce from the trendline could delay the move, so monitoring key levels is essential.$BTC $ETH $SOL
