
RedwanCrypto
366 Публикации

RedwanCrypto
Отправить жалобу
Заблокировать пользователя
Crypto trader | Sharing market insights, DeFi trends & strategies | Learning, earning, growing in Web3 | DYOR | NFA | #Crypto #BinanceSquare
Открытая сделка
Трейдер с частыми сделками
2.5 г
900 подписок(и/а)
439 подписчиков(а)
465 понравилось
Посты
Портфель
Все
Цитирования
PINNED
·
--
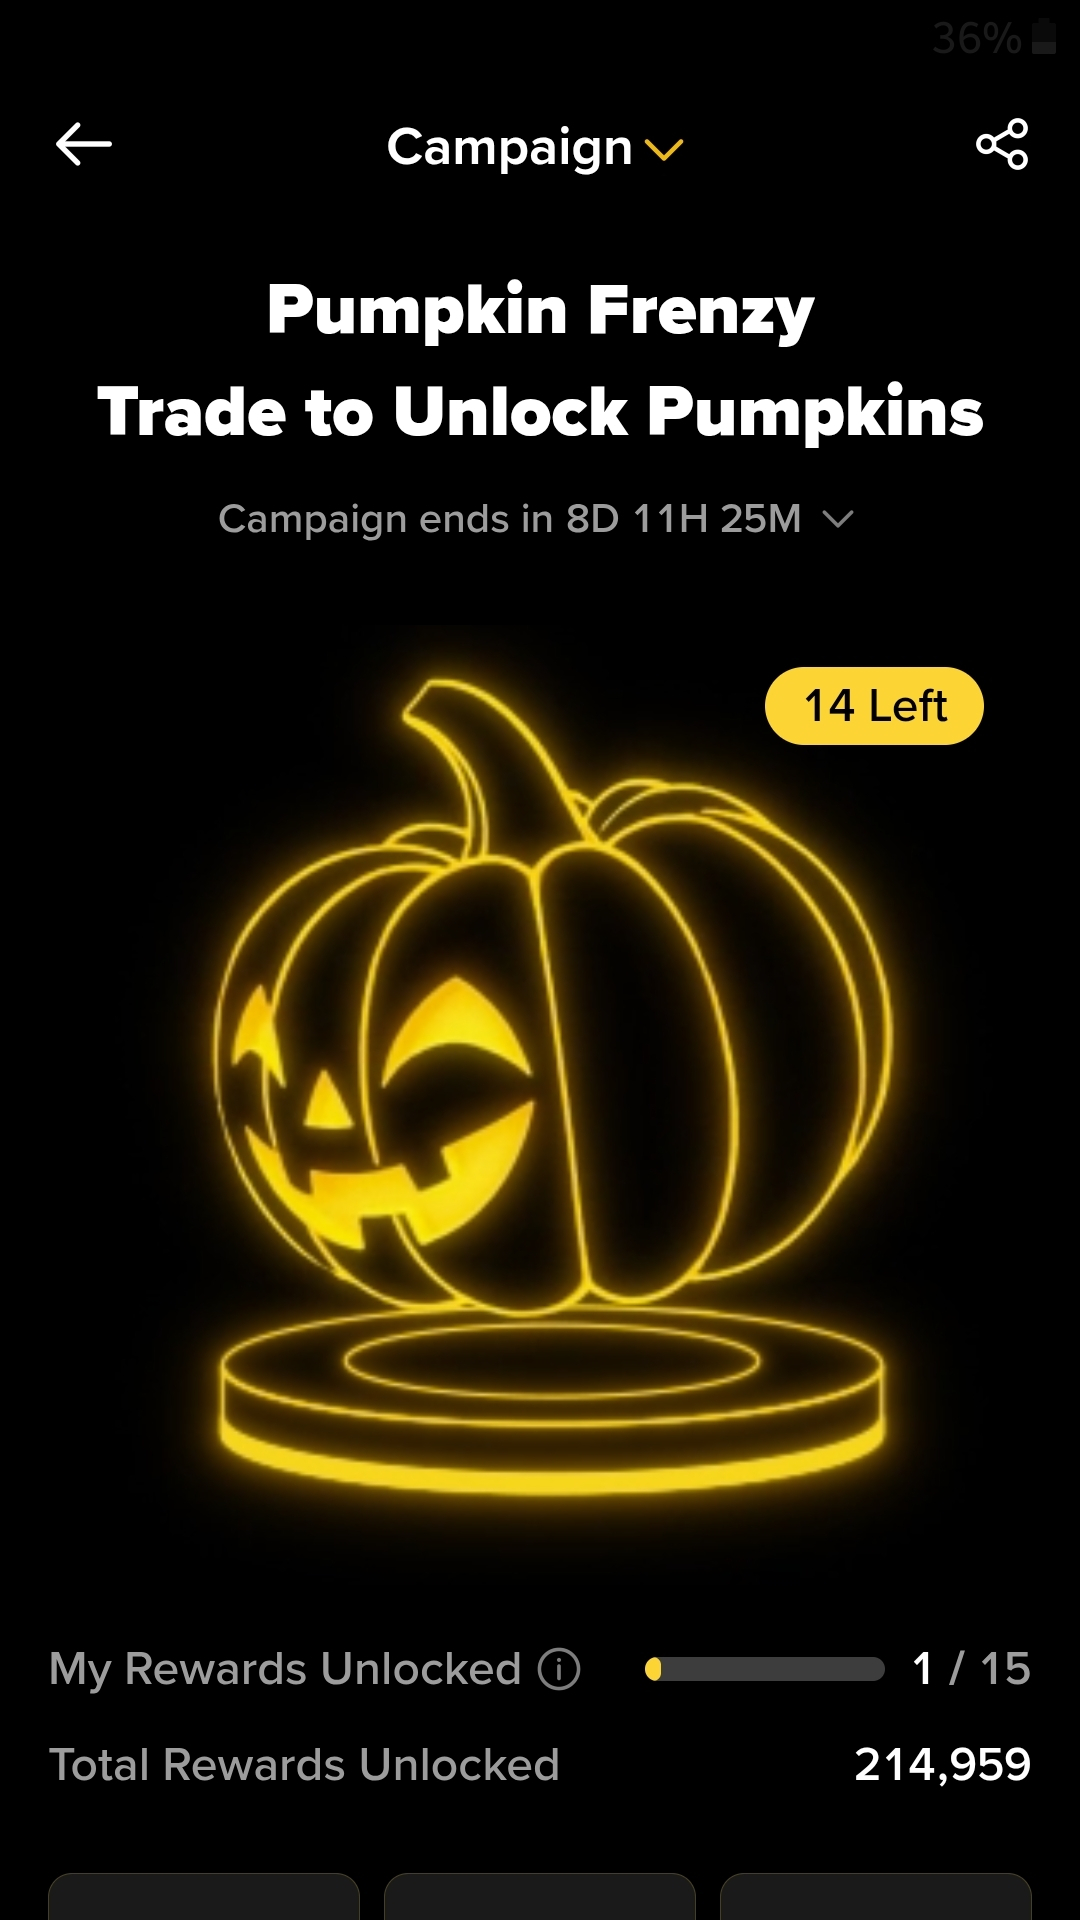
[Join and enjoy in Pumpkin mystery reward](https://www.binance.com/referral/mystery-box/Pumpkin-Frenzy/claim?ref=898907627) 💰💵 $BTC
Join and enjoy in Pumpkin mystery reward 💰💵 $BTC
63
4
58
37.1k
PINNED
·
--
Торговля за 30 дней $ETH 1.4K USDT
🎓 I just recived my certificate for completing AI UNLOCKED AGENTS AND SKILLS course. Let's study together.🎉🎉⭐️
#BinanceAcademyKH #BTC☀ #CryptoNewss $BTC $BNB $ETH
🎓 I just recived my certificate for completing AI UNLOCKED AGENTS AND SKILLS course. Let's study together.🎉🎉⭐️
#BinanceAcademyKH #BTC☀ #CryptoNewss $BTC $BNB $ETH
#BinanceAcademyKH #BTC☀ #CryptoNewss $BTC $BNB $ETH

1
2
170
·
--
1
13
·
--
Рост
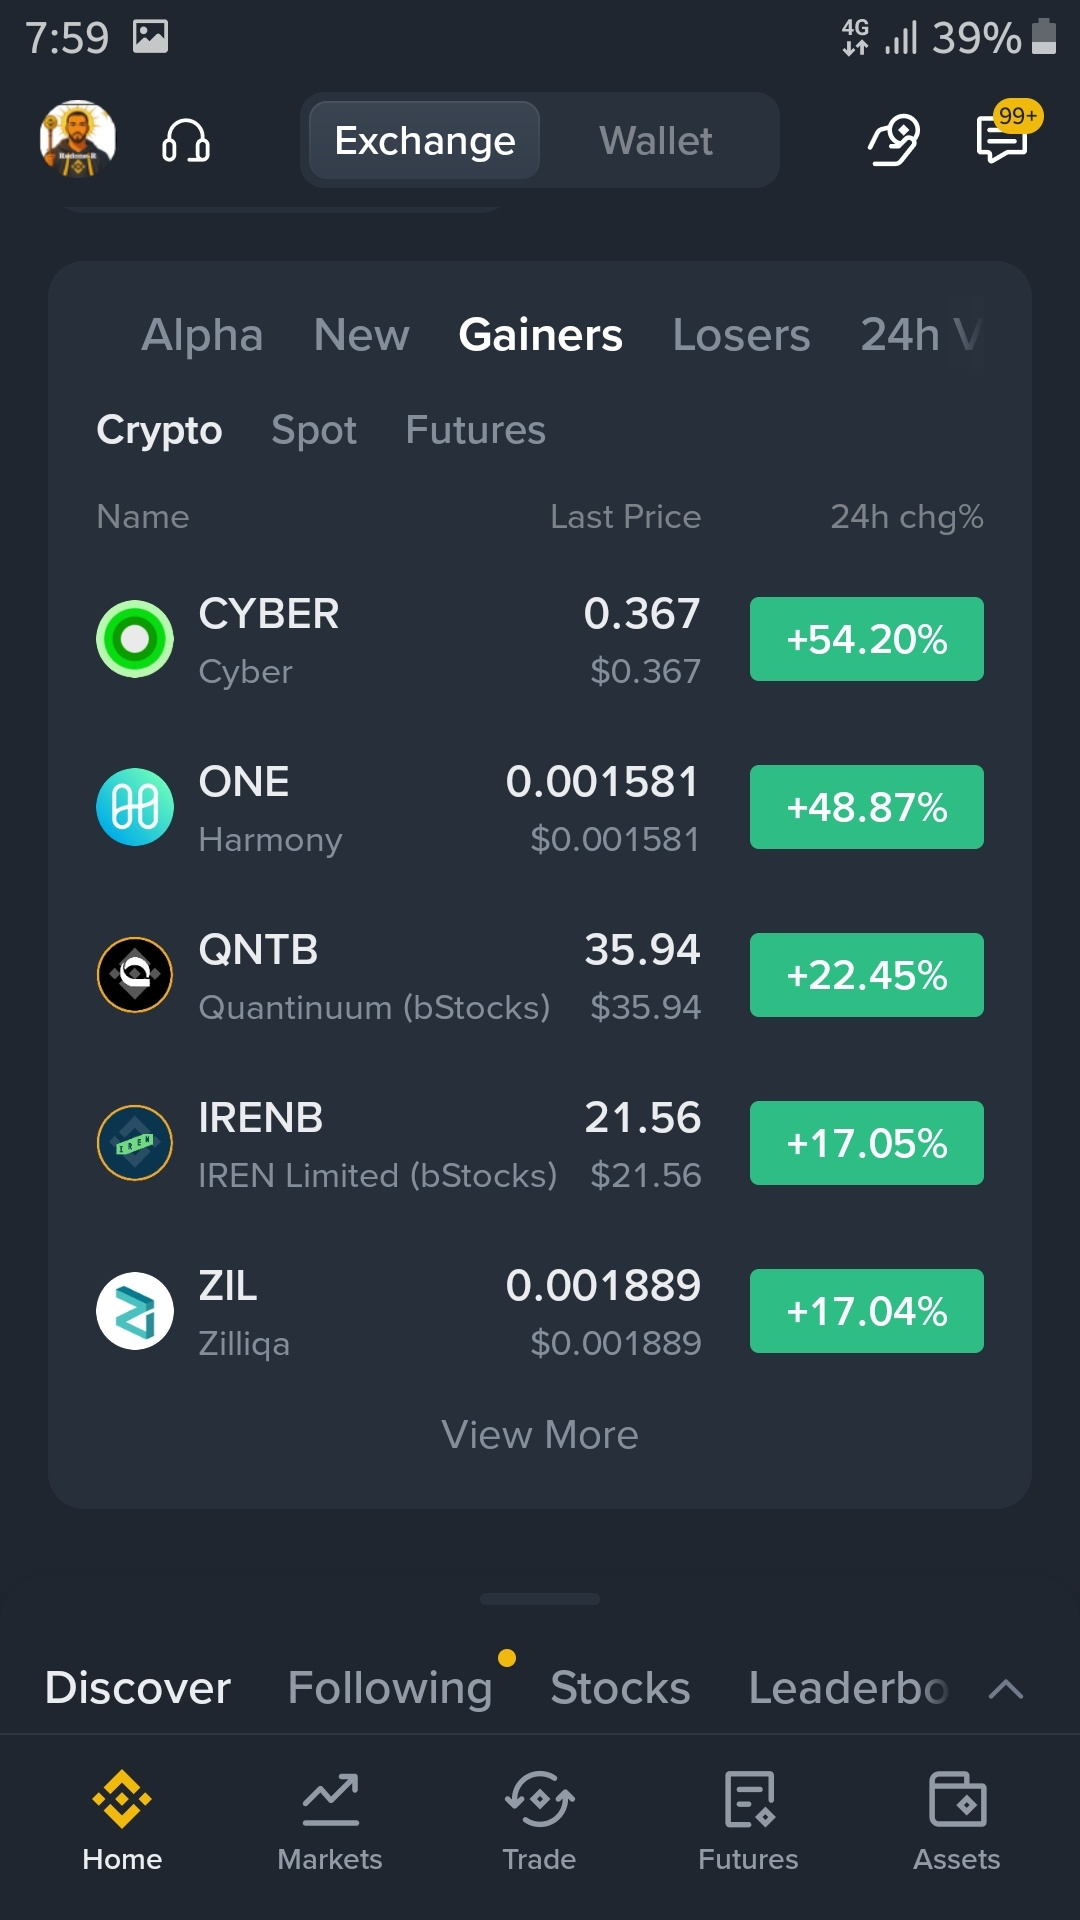
Todays top gainers😃
$CYBER 54.20%
$ONE 48.87%
$QNTB 28.24%
Todays top gainers😃
$CYBER 54.20%
$ONE 48.87%
$QNTB 28.24%
$CYBER 54.20%
$ONE 48.87%
$QNTB 28.24%
1
675
·
--
Падение
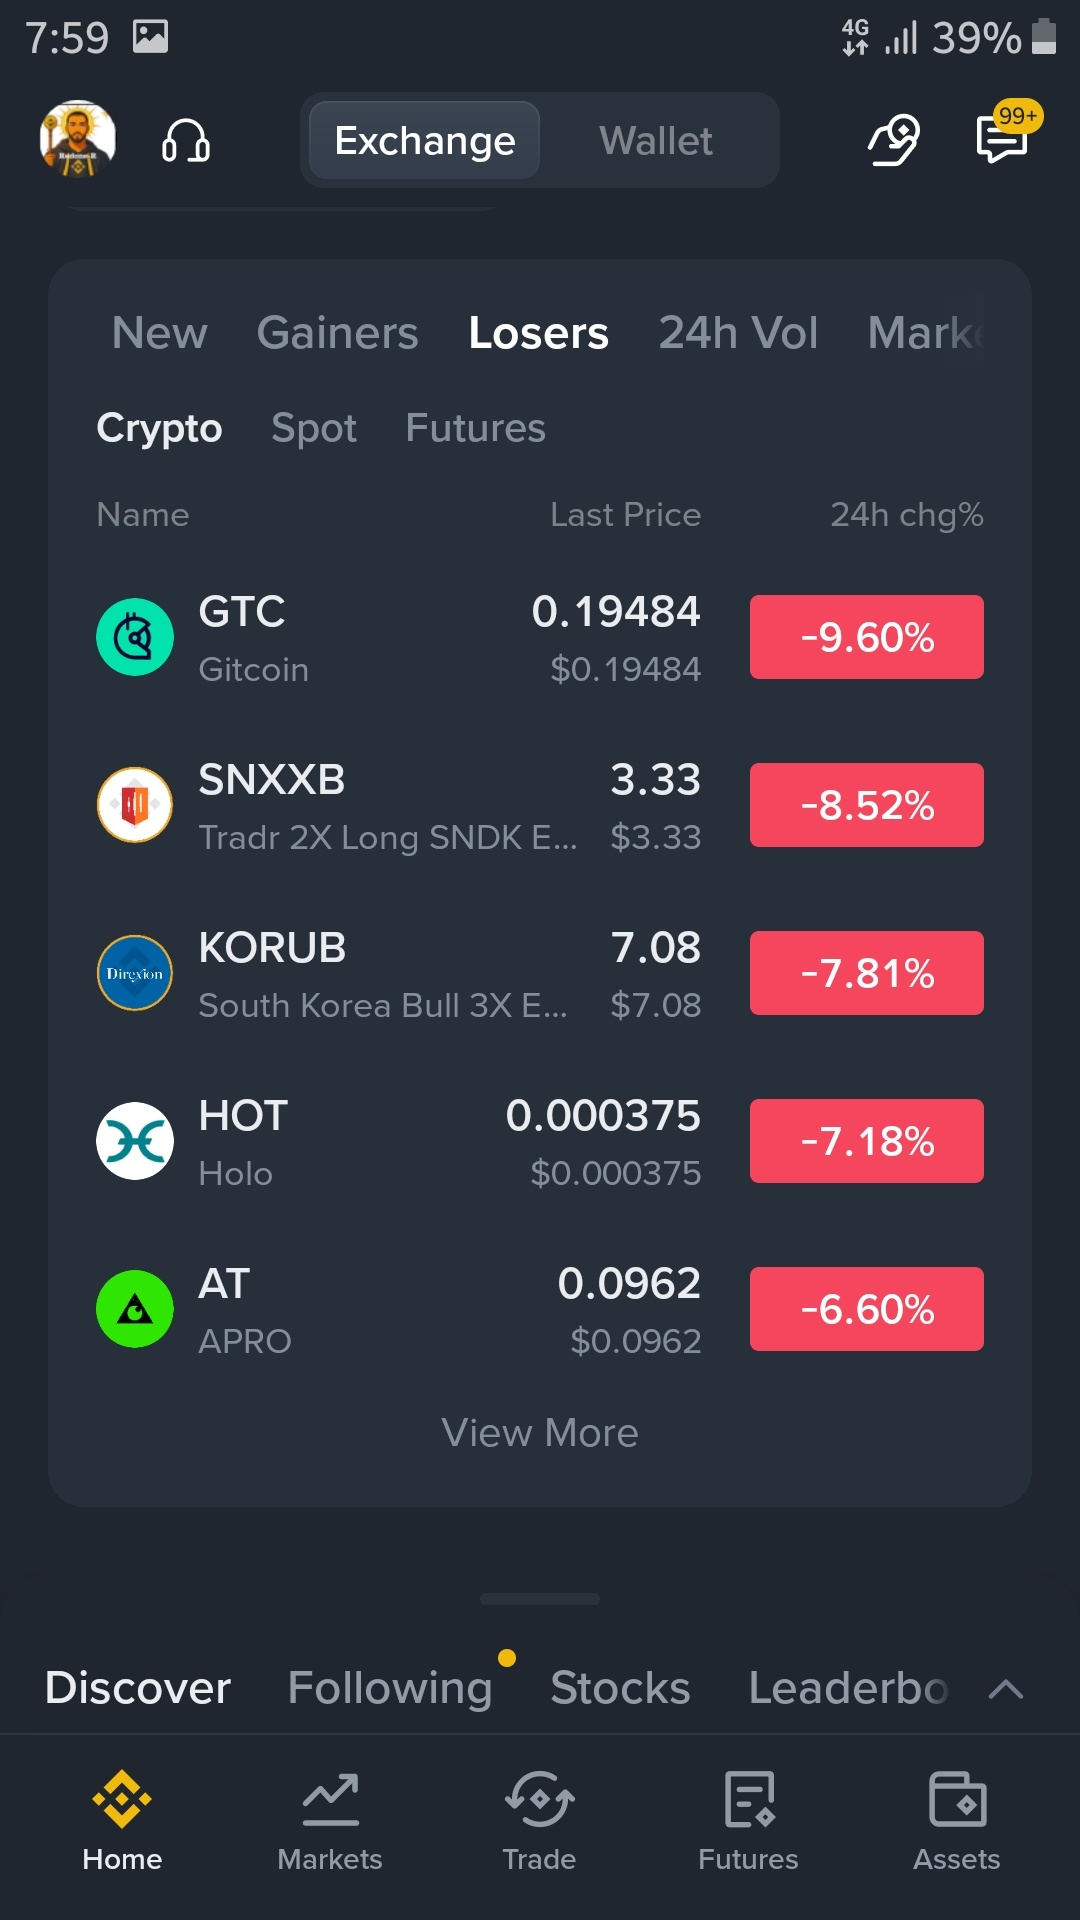
Todays top losers😃
$GTC -9.60%
$SNXXB -8.52%
$KORUB
{spot}(KORUBUSDT)
-7.81%
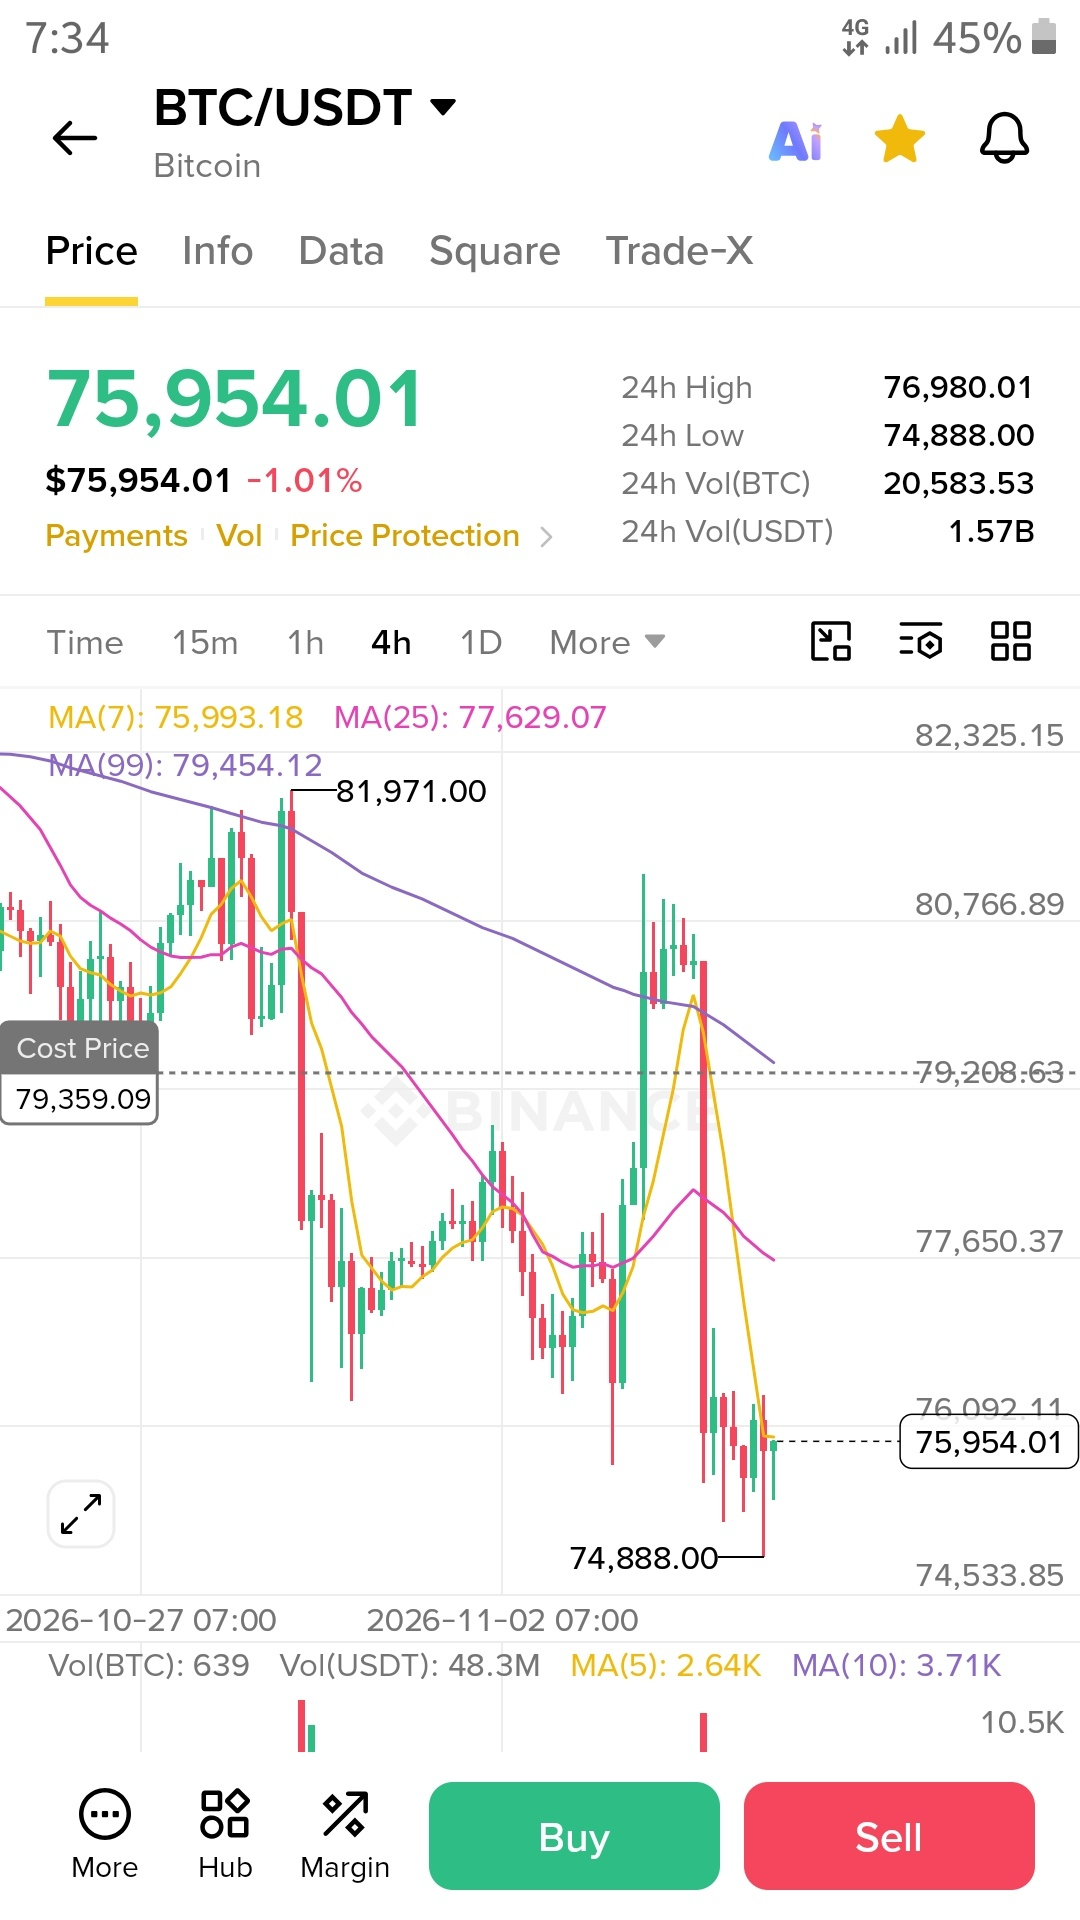
#BitcoinRebounds$75KAsChipsLead
Todays top losers😃
$GTC -9.60%
$SNXXB -8.52%
$KORUB
-7.81%
#BitcoinRebounds$75KAsChipsLead
$GTC -9.60%
$SNXXB -8.52%
$KORUB
-7.81%
#BitcoinRebounds$75KAsChipsLead
1
124
·
--
Рост
1
168
·
--
Падение
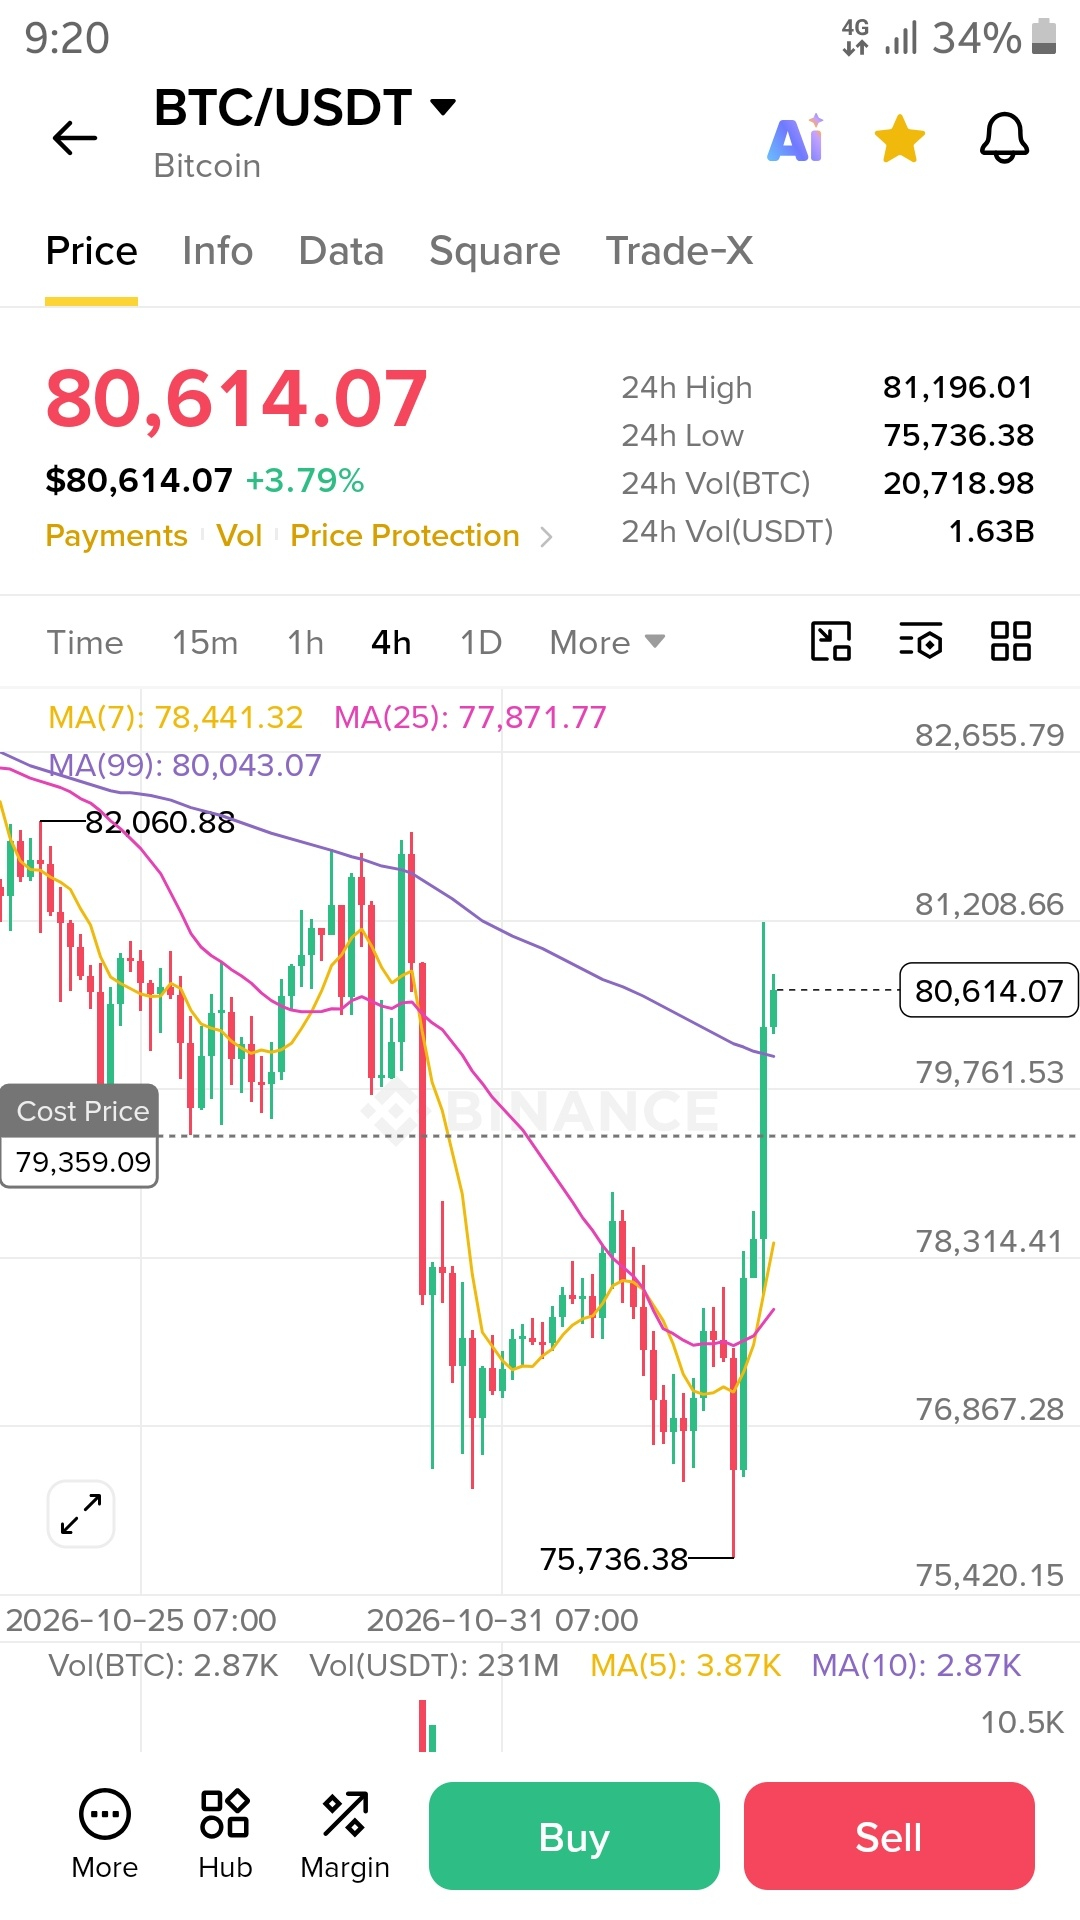
📊 ONE CHART. THREE SIGNALS. A BETTER WAY TO UNDERSTAND MARKET CONDITIONS.
You don't always need ten indicators covering your entire screen.
Sometimes three carefully selected tools can provide useful market context.
Here's a simple combination worth understanding:
🔵 1. Moving Average (MA)
Helps identify the broader price direction and potential dynamic support or resistance areas.
🟢 2. Relative Strength Index (RSI)
Provides information about momentum and possible overbought or oversold conditions.
🟡 3. Volume
Shows trading activity and helps evaluate participation behind price movements.
Why combine them?
Because each indicator measures something different:
• Moving averages: Trend context.
• RSI: Momentum context.
• Volume: Market participation.
When these signals align, they can provide a more complete picture.
However, indicators can produce misleading signals, especially during volatile market conditions.
Use them as analytical tools, not prediction machines.
💬 What's your favorite three-indicator combination? #TradingIndicators #CryptoCharts #RedwanCrypto #BinancePicks
#JobsReportRaisesHikeOdds $BTC
📊 ONE CHART. THREE SIGNALS. A BETTER WAY TO UNDERSTAND MARKET CONDITIONS.
You don't always need ten indicators covering your entire screen.
Sometimes three carefully selected tools can provide useful market context.
Here's a simple combination worth understanding:
🔵 1. Moving Average (MA)
Helps identify the broader price direction and potential dynamic support or resistance areas.
🟢 2. Relative Strength Index (RSI)
Provides information about momentum and possible overbought or oversold conditions.
🟡 3. Volume
Shows trading activity and helps evaluate participation behind price movements.
Why combine them?
Because each indicator measures something different:
• Moving averages: Trend context.
• RSI: Momentum context.
• Volume: Market participation.
When these signals align, they can provide a more complete picture.
However, indicators can produce misleading signals, especially during volatile market conditions.
Use them as analytical tools, not prediction machines.
💬 What's your favorite three-indicator combination? #TradingIndicators #CryptoCharts #RedwanCrypto #BinancePicks
#JobsReportRaisesHikeOdds $BTC
You don't always need ten indicators covering your entire screen.
Sometimes three carefully selected tools can provide useful market context.
Here's a simple combination worth understanding:
🔵 1. Moving Average (MA)
Helps identify the broader price direction and potential dynamic support or resistance areas.
🟢 2. Relative Strength Index (RSI)
Provides information about momentum and possible overbought or oversold conditions.
🟡 3. Volume
Shows trading activity and helps evaluate participation behind price movements.
Why combine them?
Because each indicator measures something different:
• Moving averages: Trend context.
• RSI: Momentum context.
• Volume: Market participation.
When these signals align, they can provide a more complete picture.
However, indicators can produce misleading signals, especially during volatile market conditions.
Use them as analytical tools, not prediction machines.
💬 What's your favorite three-indicator combination? #TradingIndicators #CryptoCharts #RedwanCrypto #BinancePicks
#JobsReportRaisesHikeOdds $BTC
1
78
·
--
Падение
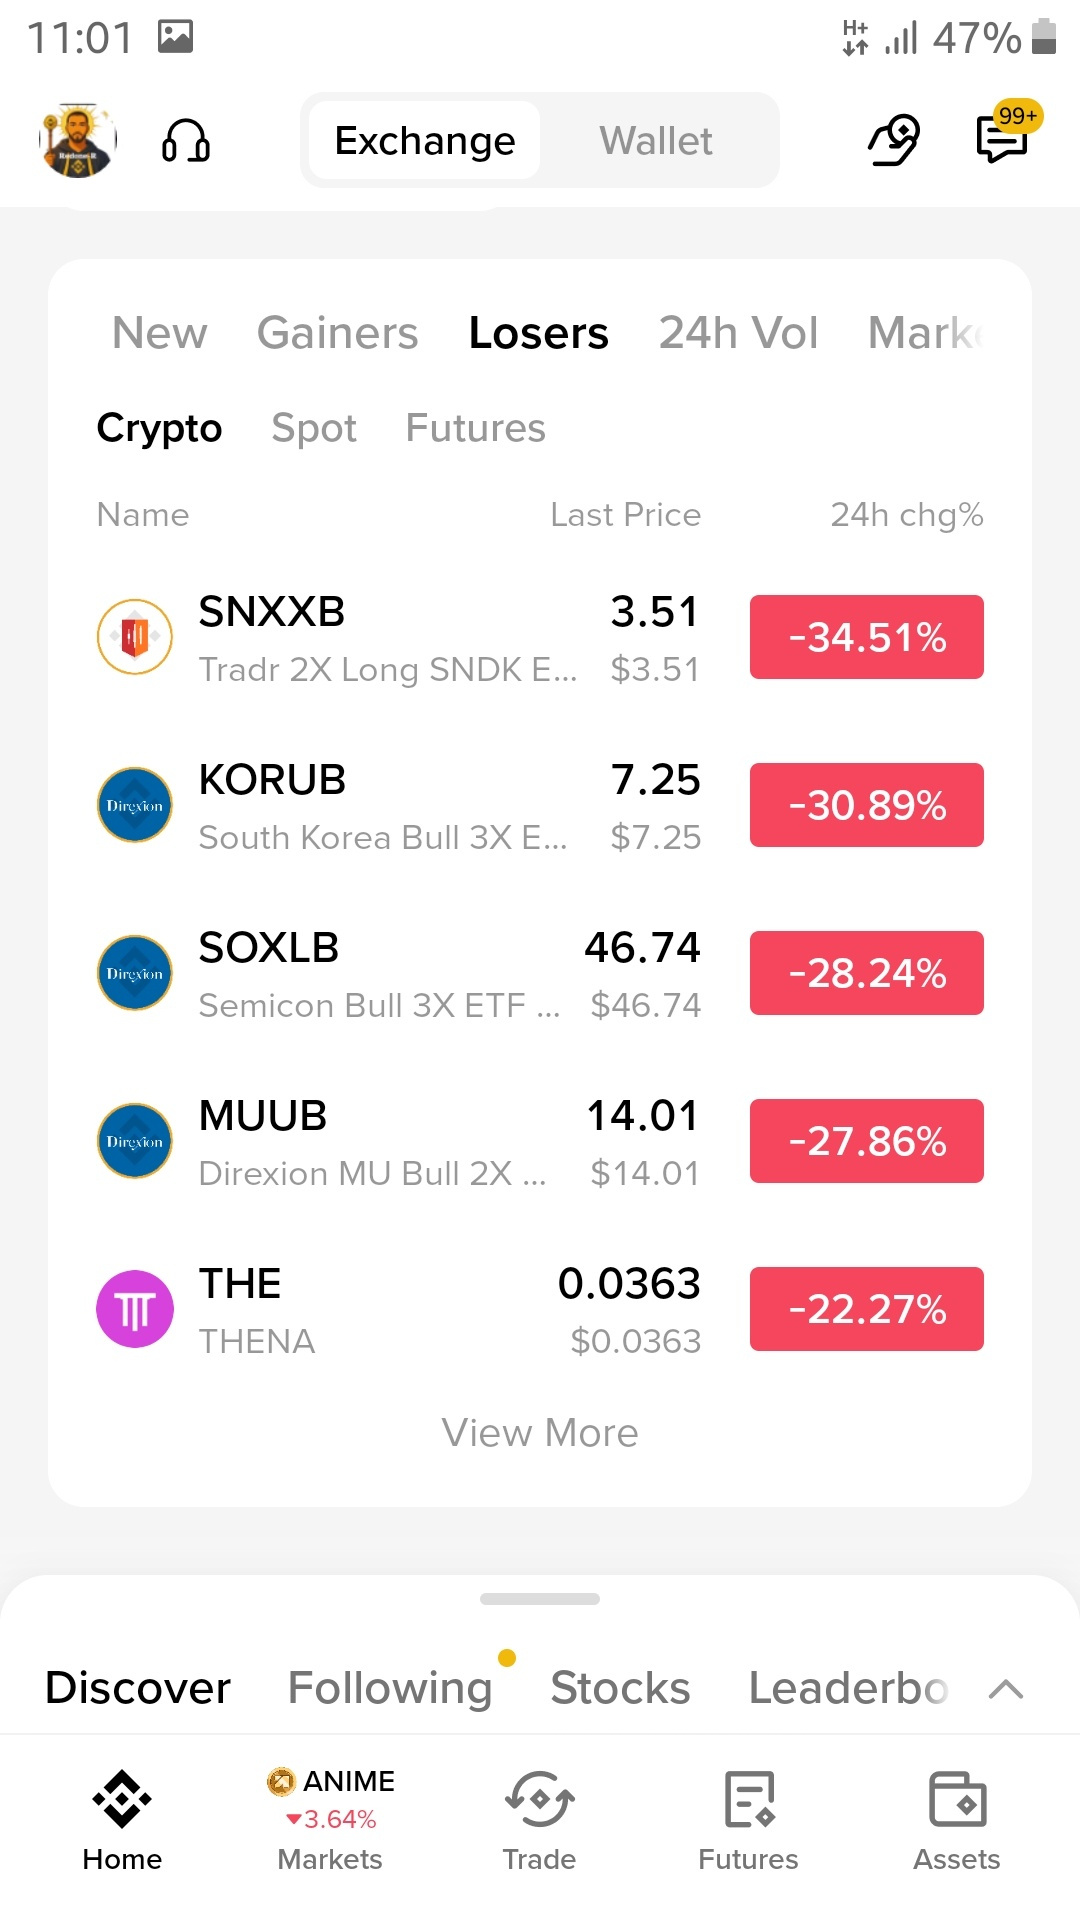
Todays top losers😃
$SNXXB -34.54%
$KORUB -30.89%
$SOXLB -28.24
Todays top losers😃
$SNXXB -34.54%
$KORUB -30.89%
$SOXLB -28.24
$SNXXB -34.54%
$KORUB -30.89%
$SOXLB -28.24
1
1.6k
·
--
Рост
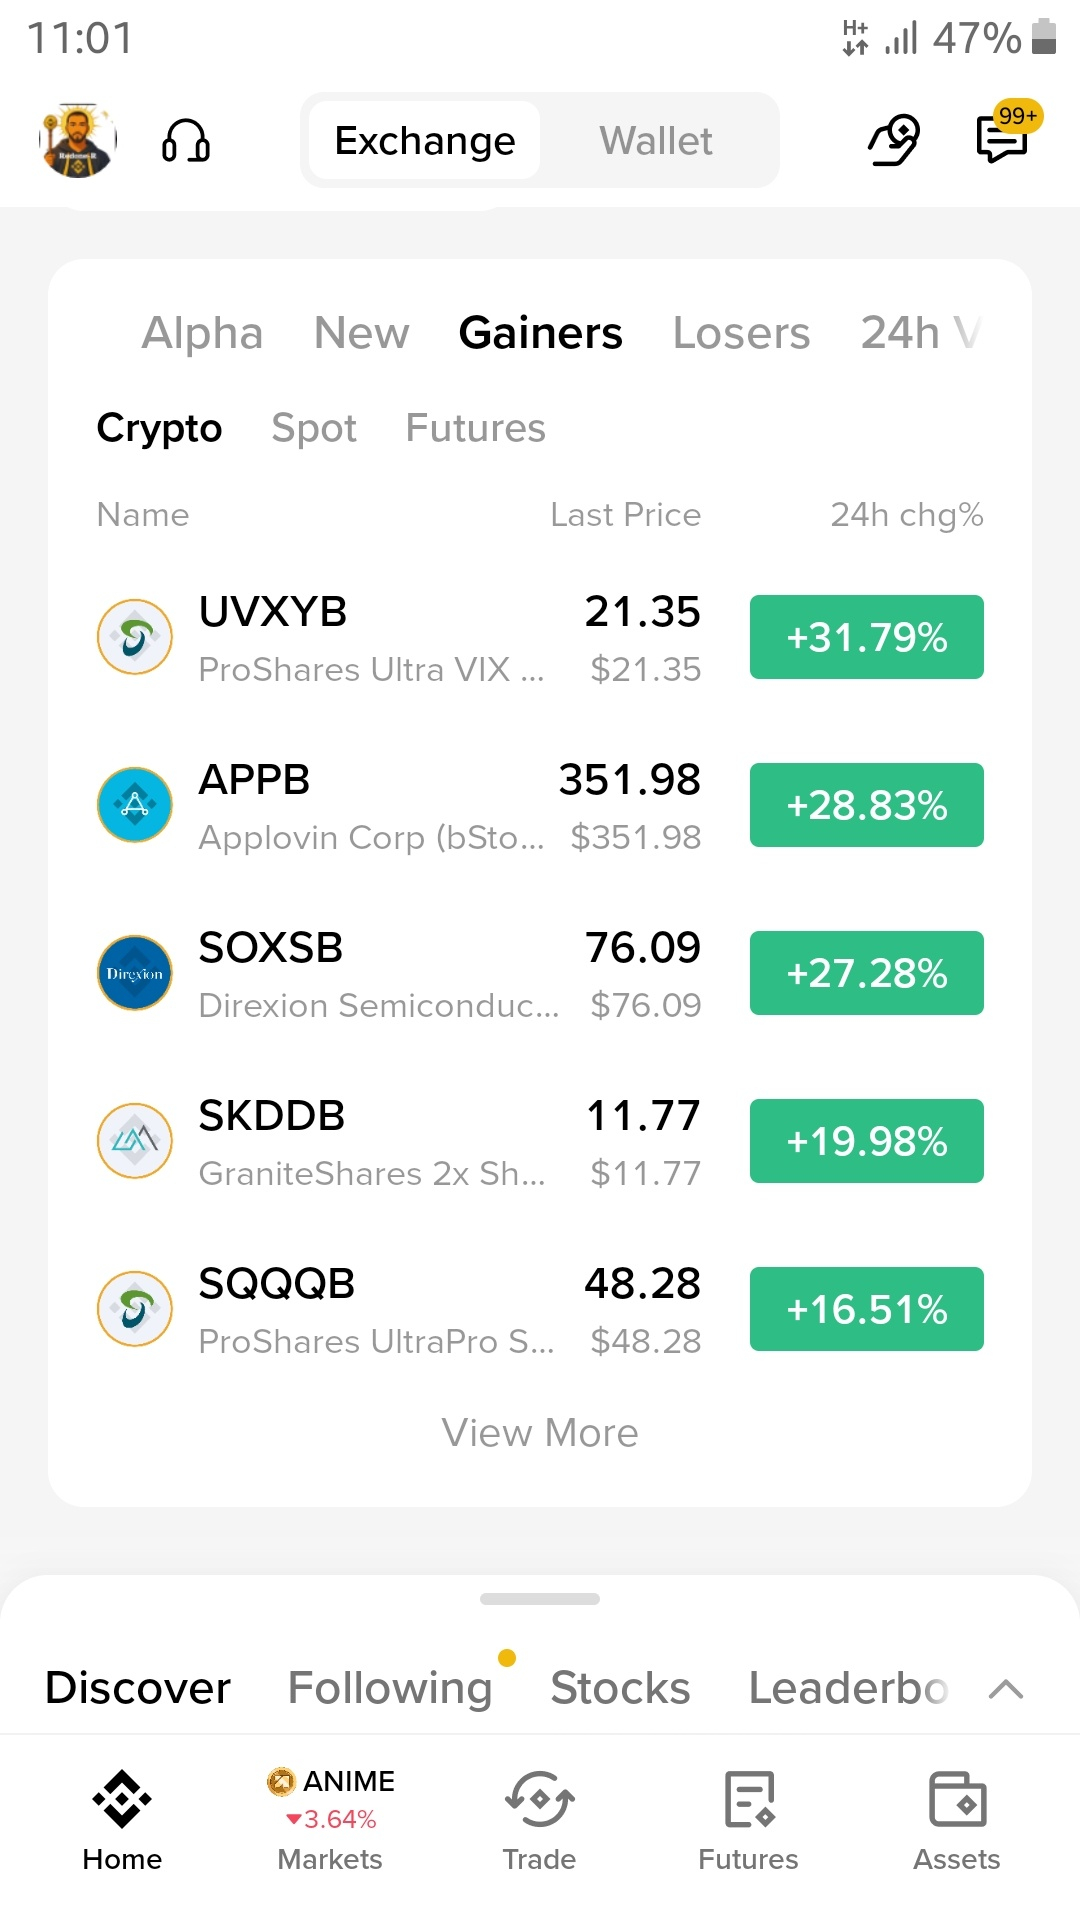
Todays market top gainers🚀🚀
$UVXYB 31.79%
$APPB 28.83%
$SOXLB 27.28%
Todays market top gainers🚀🚀
$UVXYB 31.79%
$APPB 28.83%
$SOXLB 27.28%
$UVXYB 31.79%
$APPB 28.83%
$SOXLB 27.28%
1
557
·
--
Рост
24
1
17
2.8k
·
--
Падение
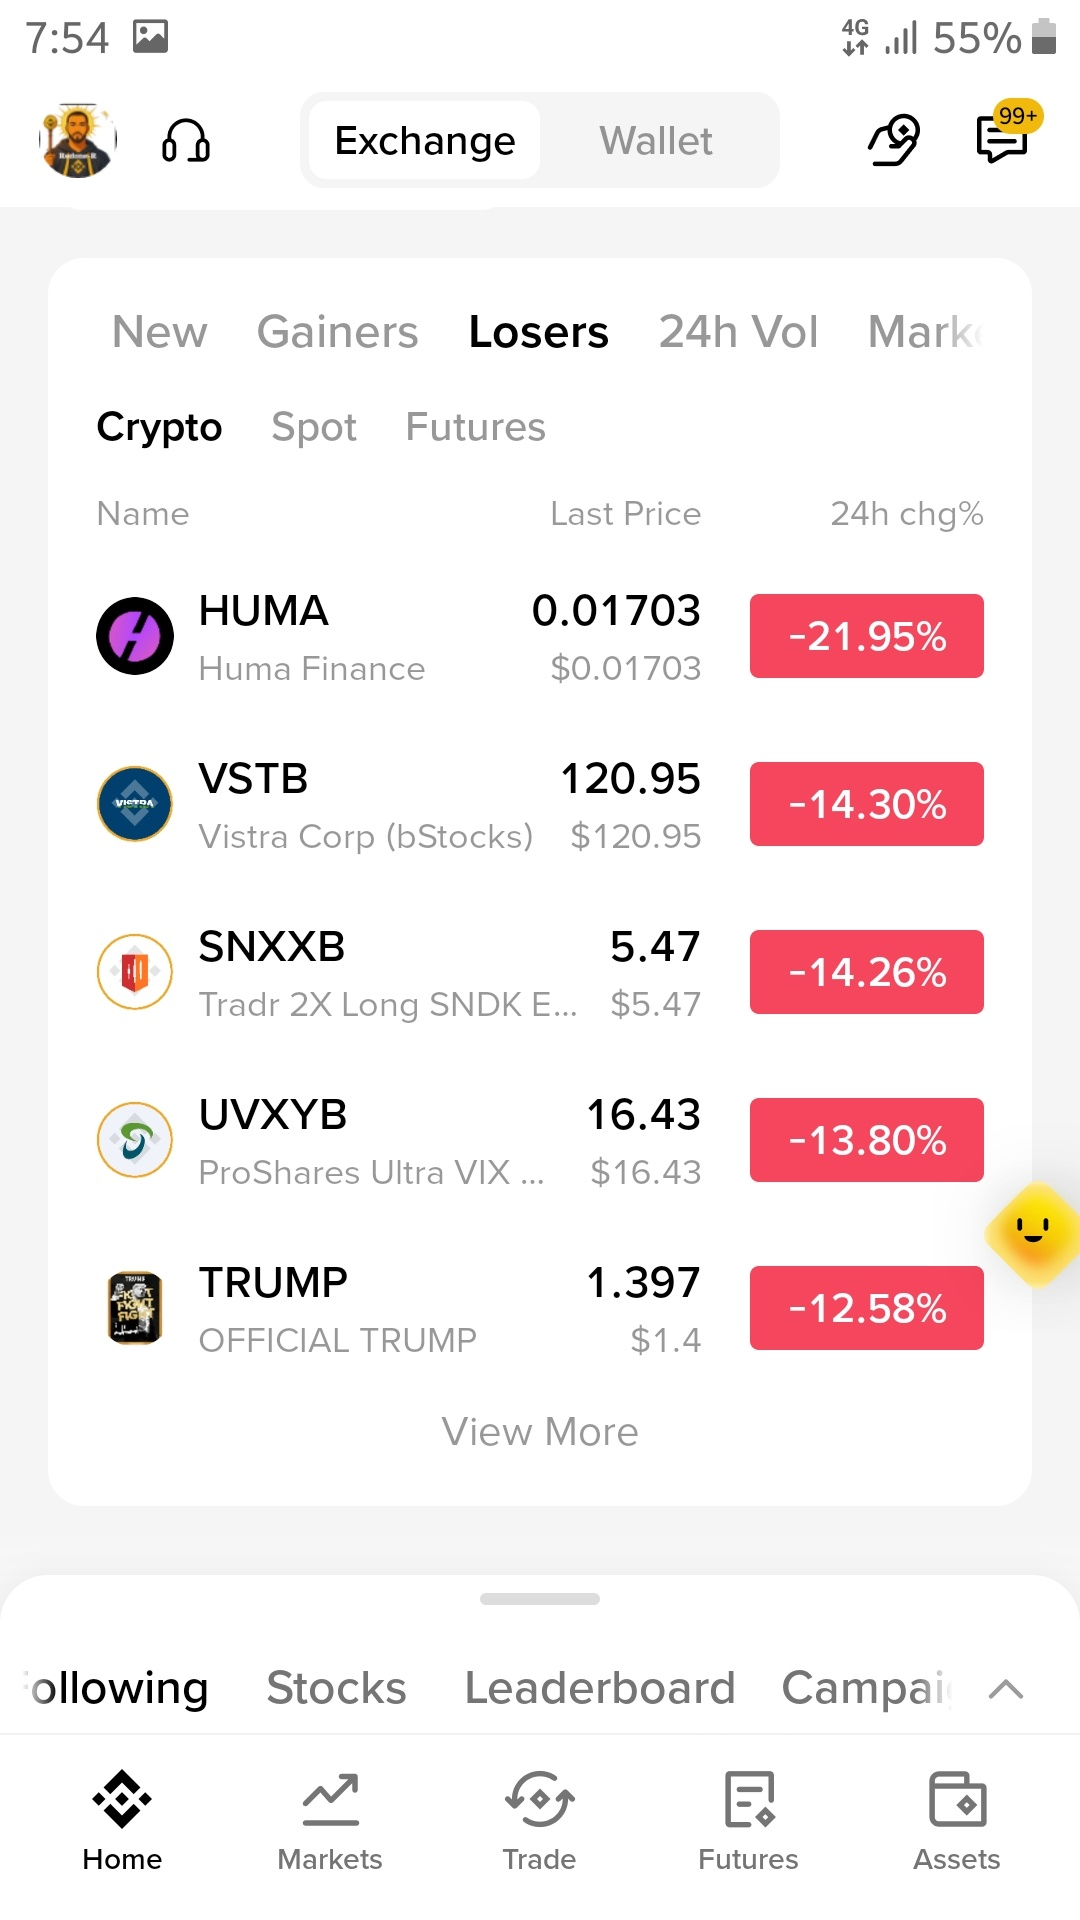
todays market top losers
$HUMA -21.95%
$VSTB 14.30%
$SNXXB -14.30%
todays market top losers
$HUMA -21.95%
$VSTB 14.30%
$SNXXB -14.30%
$HUMA -21.95%
$VSTB 14.30%
$SNXXB -14.30%
3
1.1k
·
--
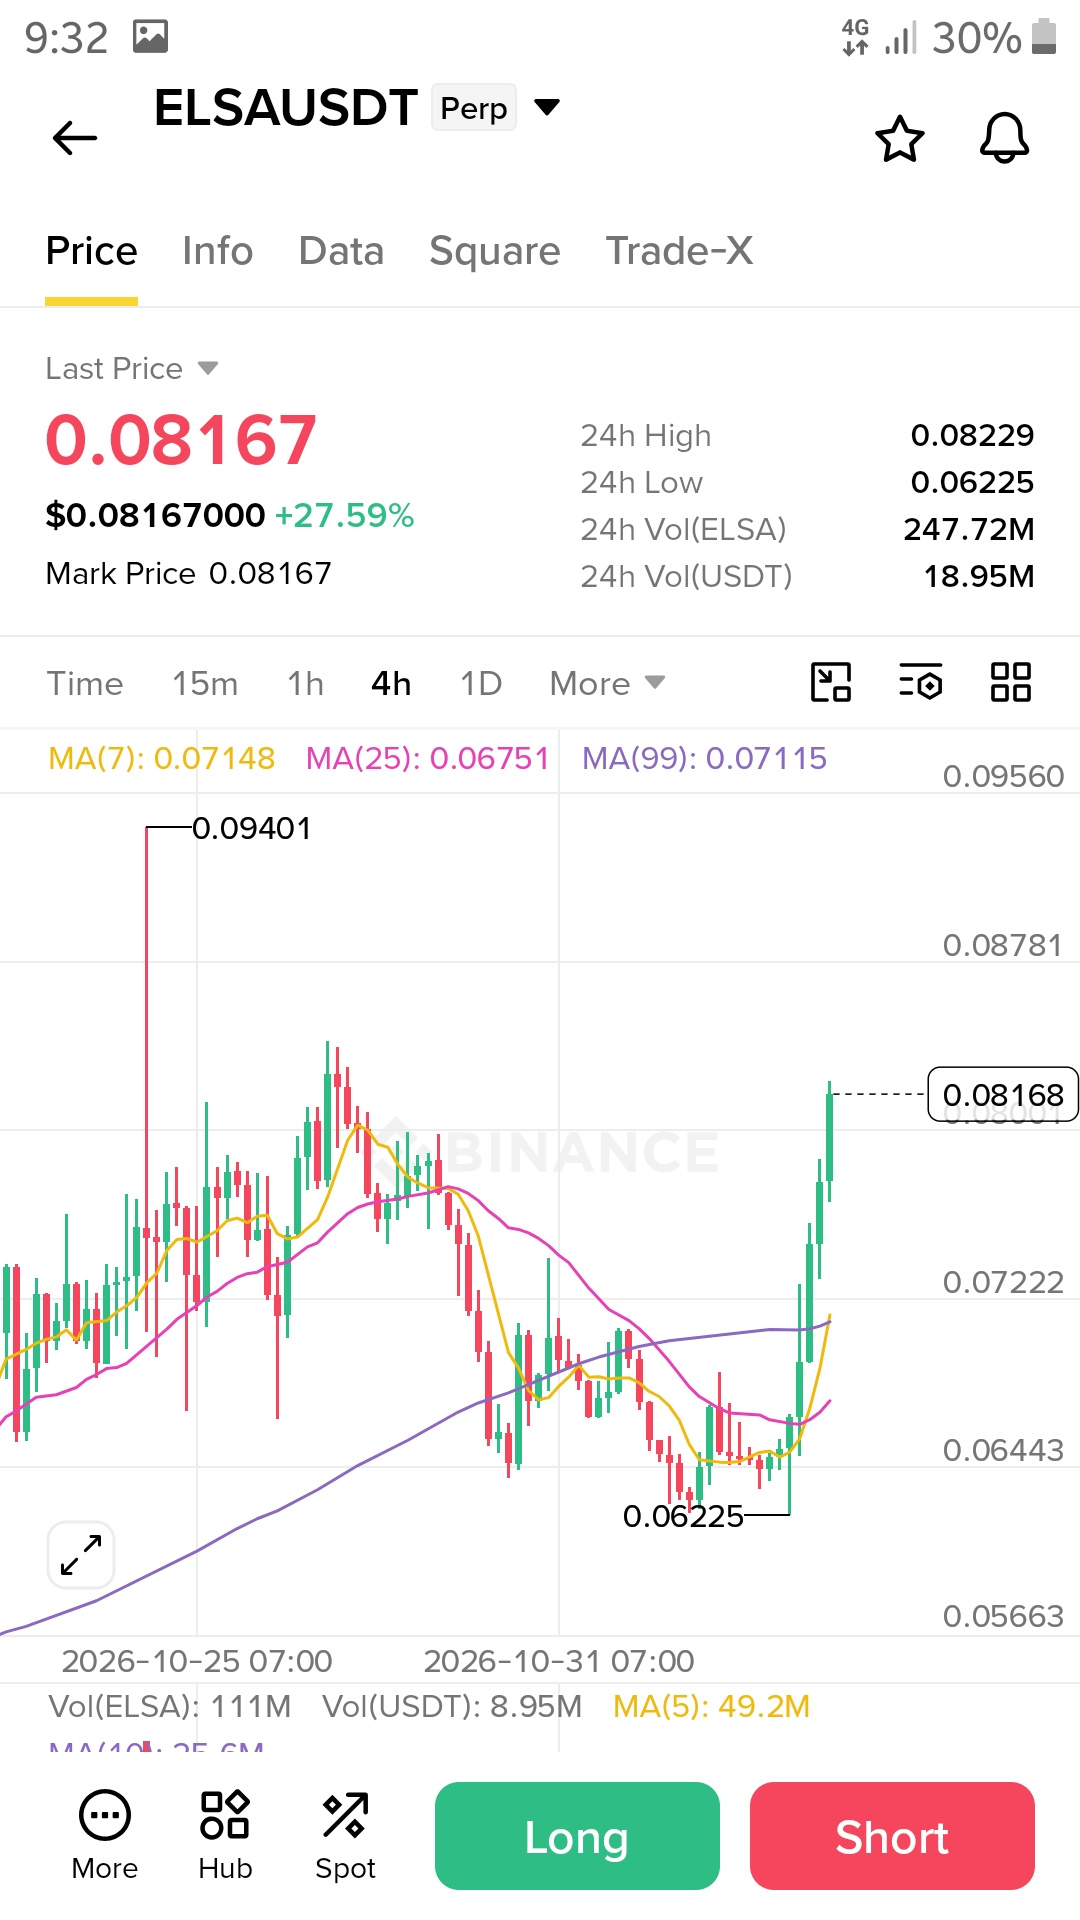
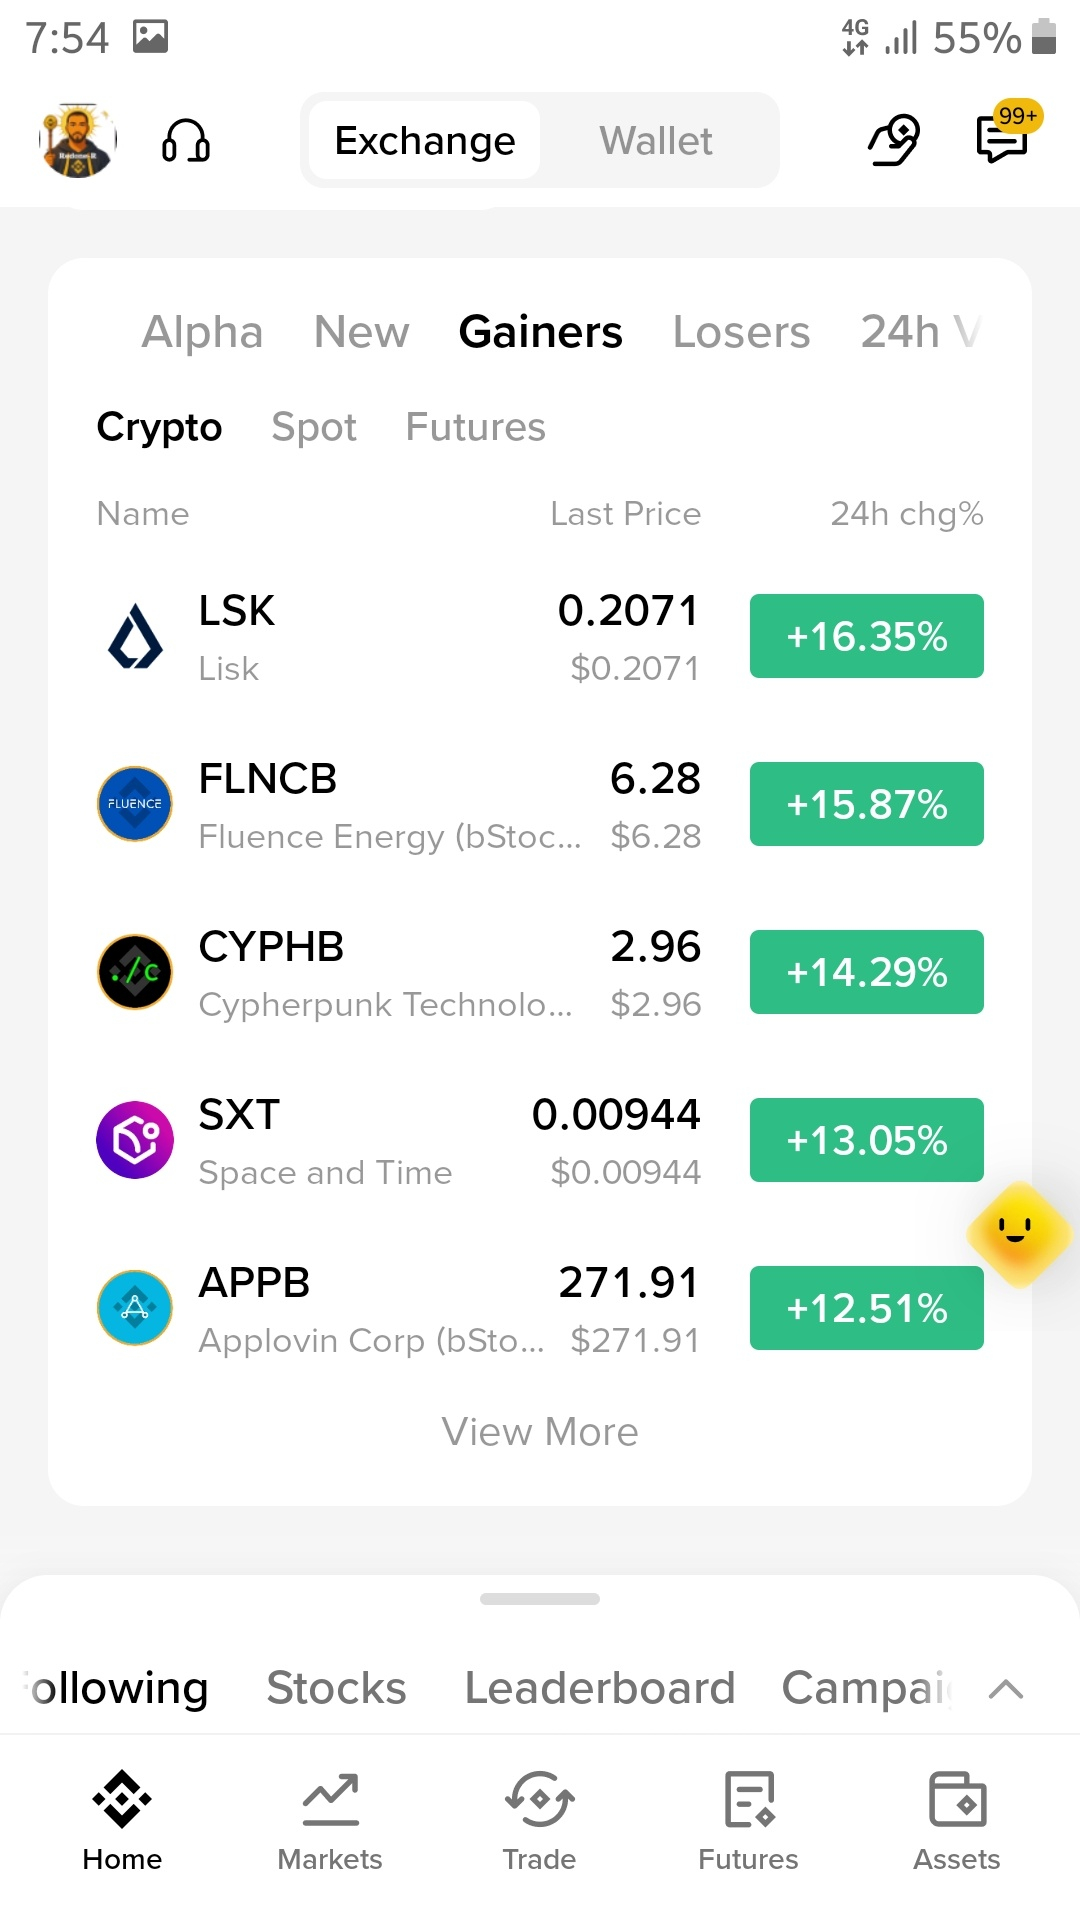
Todays top gainers🚀🚀
$LSK 6.35%
$FLNCB 15.87%
$CYPHB 14.29%
Todays top gainers🚀🚀
$LSK 6.35%
$FLNCB 15.87%
$CYPHB 14.29%
$LSK 6.35%
$FLNCB 15.87%
$CYPHB 14.29%
5
1k
·
--
I want to say congragulate to my self🎓
and l'm waiting my friends comment🙄
I want to say congragulate to my self🎓
and l'm waiting my friends comment🙄
and l'm waiting my friends comment🙄
RedwanCrypto
·
--
🎓 I just recived my certificate for completing AI UNLOCKED AGENTS AND SKILLS course. Let's study together.🎉🎉⭐️
#BinanceAcademyKH #BTC☀ #CryptoNewss $BTC $BNB $ETH
#BinanceAcademyKH #BTC☀ #CryptoNewss $BTC $BNB $ETH
2
13
Войдите, чтобы посмотреть больше материала
Присоединяйтесь к пользователям криптовалют по всему миру на Binance Square
⚡️ Получайте новейшую и полезную информацию о криптоактивах.
💬 Нам доверяет крупнейшая в мире криптобиржа.
👍 Получите достоверные аналитические данные от верифицированных создателей контента.
Эл. почта/номер телефона
В тренде
JobsReportRaisesHikeOdds
Просмотров: 226,188
1,835 обсуждают
TradFi News | US Adds 165,000 Jobs in October, More Than Double the 65,000 Forecast, as Unemployment Falls to 4.1%
Binance News
·Лайков: 30
·Просмотров: 21.1k
CPITestsDecemberRateOutlook
Просмотров: 12,504
193 обсуждают
BitcoinRebounds$75KAsChipsLead
Просмотров: 19,541
210 обсуждают