
DMNKHD
237 Публикации

DMNKHD
Отправить жалобу
Заблокировать пользователя
🚀 Crypto Enthusiast | BTC • ETH • BNB 📊 Market Insights 📚 Trading Education 🧠 Risk Management | Learn Smart, Grow Together!
Открытая сделка

Владелец BTC
Трейдер с частыми сделками
1.9 г
500 подписок(и/а)
71 подписчиков(а)
21 понравилось
Посты
Портфель
PINNED
·
--
🎁 CRYPTO QUIZ CHALLENGE! 🧠🚀
Test your Bitcoin knowledge!
**QUESTION:**
What is the maximum supply of Bitcoin (BTC)?
A) 10 Million BTC
B) 21 Million BTC
C) 50 Million BTC
D) 100 Million BTC
👇 Comment your answer: A, B, C or D!
🎁 Think carefully before answering!
{spot}(BTCUSDT)
🎁 CRYPTO QUIZ CHALLENGE! 🧠🚀
Test your Bitcoin knowledge!
**QUESTION:**
What is the maximum supply of Bitcoin (BTC)?
A) 10 Million BTC
B) 21 Million BTC
C) 50 Million BTC
D) 100 Million BTC
👇 Comment your answer: A, B, C or D!
🎁 Think carefully before answering!
Test your Bitcoin knowledge!
**QUESTION:**
What is the maximum supply of Bitcoin (BTC)?
A) 10 Million BTC
B) 21 Million BTC
C) 50 Million BTC
D) 100 Million BTC
👇 Comment your answer: A, B, C or D!
🎁 Think carefully before answering!

2
1
55
·
--
Проверено

Статья
🚀 GOLDMAN SACHS INCREASES BITCOIN ETF HOLDINGS BY 121% TO $1.283 BILLION!Goldman Sachs is attracting attention in the cryptocurrency market after its Bitcoin $ETFT.ETF holdings reportedly increased by 121% during the third quarter of 2026. According to the Binance News report, citing ChainCatcher and Crypto Briefing, Goldman Sachs' latest 13F filing with the U.S. Securities and Exchange Commission (SEC) showed that its spot Bitcoin ETF holdings were valued at approximately $1.283 billion as of September 30, 2026. This represents a significant increase from approximately $580 million at the end of the second quarter. The development is particularly interesting because Goldman Sachs is one of the world's major financial institutions, and its investment exposure highlights the growing connection between traditional finance and the cryptocurrency market. However, an important detail deserves attention: Goldman Sachs does not directly hold Bitcoin through these reported positions. Instead, it gains Bitcoin exposure through regulated exchange-traded funds (ETFs). A Bitcoin ETF allows investors to gain exposure to Bitcoin's price movements through a traditional investment product without directly managing cryptocurrency wallets or private keys. Among Goldman Sachs' reported positions, BlackRock's iShares Bitcoin Trust ($IBIT ) was its largest individual holding, valued at approximately $778.3 million. Interestingly, the report also states that Goldman Sachs' share count in IBIT declined by approximately 5% during the quarter. This is an important distinction because the value of an investment can increase even when the number of shares held decreases, depending on the market price of the ETF. Therefore, the 121% increase in total reported holdings should not automatically be interpreted as a 121% increase in the number of Bitcoin ETF shares purchased. The filing provides an interesting picture of how a major financial institution is positioning itself within the growing digital-asset investment market.
Another notable development in the report involves Goldman Sachs' Fidelity Wise Origin Bitcoin Fund (FBTC) position. Its holdings reportedly increased more than 50-fold to approximately 5.48 million shares, valued at around $397.9 million. Goldman Sachs also opened a new position worth approximately $47.9 million in the Morgan Stanley Bitcoin Trust and increased its holdings in Grayscale Bitcoin Mini Trust. At the same time, the report states that the financial institution reduced its long position in Strategy by nearly 52%, bringing its position to approximately $422.6 million. These details show that institutional exposure to digital assets can involve different investment products and strategies rather than simply purchasing and holding $BTC directly. For the broader cryptocurrency market, institutional participation is an important development because large financial firms can influence investment trends, market sentiment and the adoption of regulated digital-asset products. Nevertheless, investors should not assume that one institution's portfolio decisions guarantee future Bitcoin price increases. A 13F filing is a periodic disclosure of certain investment holdings, not a live record of every transaction or a complete picture of an institution's investment strategy. The figures also represent reported investment values at a particular date and can change as market prices move. The bigger lesson is that Bitcoin is increasingly connected to traditional financial markets, and institutional investment activity deserves attention alongside blockchain development, market liquidity, regulation and investor demand. What do you think about Goldman Sachs increasing its reported Bitcoin ETF holdings by 121%? Is institutional participation a positive signal for Bitcoin's long-term future, or should investors remain cautious? Share your opinion below!
#BTCRemainsUnderPressureAfterHawkishFOMCMinutes #GoldmanSachsQ3BitcoinETFHoldingsReach$1.283B #TetherBackedUSATStablecoinLaunchesOnAvalanche
{future}(BTCUSDT)
🚀 GOLDMAN SACHS INCREASES BITCOIN ETF HOLDINGS BY 121% TO $1.283 BILLION!
Goldman Sachs is attracting attention in the cryptocurrency market after its Bitcoin $ETFT.ETF holdings reportedly increased by 121% during the third quarter of 2026. According to the Binance News report, citing ChainCatcher and Crypto Briefing, Goldman Sachs' latest 13F filing with the U.S. Securities and Exchange Commission (SEC) showed that its spot Bitcoin ETF holdings were valued at approximately $1.283 billion as of September 30, 2026. This represents a significant increase from approximately $580 million at the end of the second quarter. The development is particularly interesting because Goldman Sachs is one of the world's major financial institutions, and its investment exposure highlights the growing connection between traditional finance and the cryptocurrency market. However, an important detail deserves attention: Goldman Sachs does not directly hold Bitcoin through these reported positions. Instead, it gains Bitcoin exposure through regulated exchange-traded funds (ETFs). A Bitcoin ETF allows investors to gain exposure to Bitcoin's price movements through a traditional investment product without directly managing cryptocurrency wallets or private keys. Among Goldman Sachs' reported positions, BlackRock's iShares Bitcoin Trust ($IBIT ) was its largest individual holding, valued at approximately $778.3 million. Interestingly, the report also states that Goldman Sachs' share count in IBIT declined by approximately 5% during the quarter. This is an important distinction because the value of an investment can increase even when the number of shares held decreases, depending on the market price of the ETF. Therefore, the 121% increase in total reported holdings should not automatically be interpreted as a 121% increase in the number of Bitcoin ETF shares purchased. The filing provides an interesting picture of how a major financial institution is positioning itself within the growing digital-asset investment market.
Another notable development in the report involves Goldman Sachs' Fidelity Wise Origin Bitcoin Fund (FBTC) position. Its holdings reportedly increased more than 50-fold to approximately 5.48 million shares, valued at around $397.9 million. Goldman Sachs also opened a new position worth approximately $47.9 million in the Morgan Stanley Bitcoin Trust and increased its holdings in Grayscale Bitcoin Mini Trust. At the same time, the report states that the financial institution reduced its long position in Strategy by nearly 52%, bringing its position to approximately $422.6 million. These details show that institutional exposure to digital assets can involve different investment products and strategies rather than simply purchasing and holding $BTC directly. For the broader cryptocurrency market, institutional participation is an important development because large financial firms can influence investment trends, market sentiment and the adoption of regulated digital-asset products. Nevertheless, investors should not assume that one institution's portfolio decisions guarantee future Bitcoin price increases. A 13F filing is a periodic disclosure of certain investment holdings, not a live record of every transaction or a complete picture of an institution's investment strategy. The figures also represent reported investment values at a particular date and can change as market prices move. The bigger lesson is that Bitcoin is increasingly connected to traditional financial markets, and institutional investment activity deserves attention alongside blockchain development, market liquidity, regulation and investor demand. What do you think about Goldman Sachs increasing its reported Bitcoin ETF holdings by 121%? Is institutional participation a positive signal for Bitcoin's long-term future, or should investors remain cautious? Share your opinion below!
#BTCRemainsUnderPressureAfterHawkishFOMCMinutes #GoldmanSachsQ3BitcoinETFHoldingsReach$1.283B #TetherBackedUSATStablecoinLaunchesOnAvalanche
Another notable development in the report involves Goldman Sachs' Fidelity Wise Origin Bitcoin Fund (FBTC) position. Its holdings reportedly increased more than 50-fold to approximately 5.48 million shares, valued at around $397.9 million. Goldman Sachs also opened a new position worth approximately $47.9 million in the Morgan Stanley Bitcoin Trust and increased its holdings in Grayscale Bitcoin Mini Trust. At the same time, the report states that the financial institution reduced its long position in Strategy by nearly 52%, bringing its position to approximately $422.6 million. These details show that institutional exposure to digital assets can involve different investment products and strategies rather than simply purchasing and holding $BTC directly. For the broader cryptocurrency market, institutional participation is an important development because large financial firms can influence investment trends, market sentiment and the adoption of regulated digital-asset products. Nevertheless, investors should not assume that one institution's portfolio decisions guarantee future Bitcoin price increases. A 13F filing is a periodic disclosure of certain investment holdings, not a live record of every transaction or a complete picture of an institution's investment strategy. The figures also represent reported investment values at a particular date and can change as market prices move. The bigger lesson is that Bitcoin is increasingly connected to traditional financial markets, and institutional investment activity deserves attention alongside blockchain development, market liquidity, regulation and investor demand. What do you think about Goldman Sachs increasing its reported Bitcoin ETF holdings by 121%? Is institutional participation a positive signal for Bitcoin's long-term future, or should investors remain cautious? Share your opinion below!
#BTCRemainsUnderPressureAfterHawkishFOMCMinutes #GoldmanSachsQ3BitcoinETFHoldingsReach$1.283B #TetherBackedUSATStablecoinLaunchesOnAvalanche
1
88
·
--

Статья
📉 SOLANA PRICE UPDATE: Why Is SOL Falling? Is a Recovery Coming?Solana ($SOL ) is showing short-term weakness in the Binance chart provided, with its price at $72.83, down 1.58% at the time of the screenshot. The 24-hour high was $75.78, while the low was $72.22. One important technical signal is that SOL is trading below all three moving averages: MA(7) at $72.92, MA(25) at $73.25 and MA(99) at $74.26. This suggests that sellers currently have the upper hand on the 15-minute chart. The decline may reflect broader cryptocurrency market pressure, changing investor sentiment and short-term selling activity. However, the screenshot alone cannot confirm the exact reason behind the price movement. Traders should also remember that a 15-minute chart shows short-term price behaviour and does not establish Solana's long-term direction. A temporary decline does not automatically mean that a cryptocurrency project has lost its potential. At the same time, strong technology and past performance do not guarantee future price increases. Market participants should examine Bitcoin's movement, overall crypto sentiment, trading volume and relevant project developments before drawing conclusions. Understanding the difference between a temporary correction and a longer-lasting downtrend is important for responsible market analysis.
Looking ahead, traders may watch several important price levels from the screenshot. The $72.22 level is the displayed 24-hour low and could act as an important short-term support reference. If $SOL falls below this level, further weakness is possible, although a breakdown is not guaranteed. On the recovery side, $73.25 is an important reference because it matches the MA(25), while $74.26 corresponds to the MA(99). A sustained move above these averages could indicate improving short-term momentum. The previous high of $75.78 is another level worth monitoring. These are technical reference points, not guaranteed support or resistance levels, and market conditions can change quickly. My key lesson is simple: do not make emotional decisions because of a red candle. Study the chart, understand the risks, check reliable market information and avoid investing money you cannot afford to lose. What is your opinion about Solana? Will $SOL recover above $75, or could it fall below $72? Share your analysis and thoughts in the comments!
{spot}(SOLUSDT)
#LedgerHardwareImplantReportsExtendToDubai #CanadaAndUSLaunchOperationNiagaraAgainstApprovalPhishing
📉 SOLANA PRICE UPDATE: Why Is SOL Falling? Is a Recovery Coming?
Solana ($SOL ) is showing short-term weakness in the Binance chart provided, with its price at $72.83, down 1.58% at the time of the screenshot. The 24-hour high was $75.78, while the low was $72.22. One important technical signal is that SOL is trading below all three moving averages: MA(7) at $72.92, MA(25) at $73.25 and MA(99) at $74.26. This suggests that sellers currently have the upper hand on the 15-minute chart. The decline may reflect broader cryptocurrency market pressure, changing investor sentiment and short-term selling activity. However, the screenshot alone cannot confirm the exact reason behind the price movement. Traders should also remember that a 15-minute chart shows short-term price behaviour and does not establish Solana's long-term direction. A temporary decline does not automatically mean that a cryptocurrency project has lost its potential. At the same time, strong technology and past performance do not guarantee future price increases. Market participants should examine Bitcoin's movement, overall crypto sentiment, trading volume and relevant project developments before drawing conclusions. Understanding the difference between a temporary correction and a longer-lasting downtrend is important for responsible market analysis.
Looking ahead, traders may watch several important price levels from the screenshot. The $72.22 level is the displayed 24-hour low and could act as an important short-term support reference. If $SOL falls below this level, further weakness is possible, although a breakdown is not guaranteed. On the recovery side, $73.25 is an important reference because it matches the MA(25), while $74.26 corresponds to the MA(99). A sustained move above these averages could indicate improving short-term momentum. The previous high of $75.78 is another level worth monitoring. These are technical reference points, not guaranteed support or resistance levels, and market conditions can change quickly. My key lesson is simple: do not make emotional decisions because of a red candle. Study the chart, understand the risks, check reliable market information and avoid investing money you cannot afford to lose. What is your opinion about Solana? Will $SOL recover above $75, or could it fall below $72? Share your analysis and thoughts in the comments!
#LedgerHardwareImplantReportsExtendToDubai #CanadaAndUSLaunchOperationNiagaraAgainstApprovalPhishing
Looking ahead, traders may watch several important price levels from the screenshot. The $72.22 level is the displayed 24-hour low and could act as an important short-term support reference. If $SOL falls below this level, further weakness is possible, although a breakdown is not guaranteed. On the recovery side, $73.25 is an important reference because it matches the MA(25), while $74.26 corresponds to the MA(99). A sustained move above these averages could indicate improving short-term momentum. The previous high of $75.78 is another level worth monitoring. These are technical reference points, not guaranteed support or resistance levels, and market conditions can change quickly. My key lesson is simple: do not make emotional decisions because of a red candle. Study the chart, understand the risks, check reliable market information and avoid investing money you cannot afford to lose. What is your opinion about Solana? Will $SOL recover above $75, or could it fall below $72? Share your analysis and thoughts in the comments!
#LedgerHardwareImplantReportsExtendToDubai #CanadaAndUSLaunchOperationNiagaraAgainstApprovalPhishing
1
154
·
--

Статья
🚨 BINANCE LATEST NEWS: $6.5 BILLION COURT ORDER, NEW TRADING API & 600,000 XRP REWARDS!Binance is making headlines with several important developments that could attract attention across the cryptocurrency industry. One of the biggest stories is its legal action following the October 29, 2026 security incident, which affected approximately $6.34 billion in digital assets. On November 18, Binance announced that it had obtained a $6.5 billion worldwide freezing order from the Abu Dhabi Global Market Courts as part of its efforts to recover the stolen cryptocurrency. According to reports, approximately $2.85 billion had already been frozen or intercepted through cooperation with exchanges, stablecoin issuers, blockchain investigators and law enforcement agencies. The court order is particularly significant because it provides a legal framework for identifying, freezing and potentially returning stolen assets. Binance's legal team has also identified approximately 26,000 wallet addresses associated with the stolen funds. However, investors should understand an important difference: obtaining a freezing order does not mean Binance has recovered $6.5 billion. It is a legal measure intended to prevent the movement of assets and support recovery efforts. Binance has separately stated that it has completed replenishing the assets affected by the incident using company resources and other designated funds. It has also published a new Proof of Reserves snapshot covering 198 tokens, supporting its commitment to transparency. The company has said that it intends to replenish its Secure Asset Fund for Users (SAFU) to approximately $1 billion. These developments highlight how important cybersecurity, transparency and cooperation have become in the cryptocurrency industry. For crypto users, this story is a reminder that security is not simply about protecting passwords; it also involves exchange infrastructure, wallet monitoring, blockchain intelligence and responsible risk management.
Another important development is Binance's expansion of its trading technology. On November 18, Binance announced that its Stock Options Trading API had gone live, allowing eligible users to interact with U.S.-listed stock options through programmatic tools. The API supports searching for option contracts, placing and cancelling orders, exercising eligible long positions and checking positions, trade history and settlement information. This development may interest developers and experienced market participants who want to integrate trading systems with automated technology. However, options are complex financial instruments and can involve substantial losses. Binance has also announced a campaign offering a total of 600,000 $XRP in rewards to eligible users holding Ripple USD (RLUSD). The campaign is scheduled to run from November 20 to December 18, 2026, subject to Binance's eligibility requirements and regional availability. Rewards are calculated using qualifying balances and campaign rules; they are not guaranteed income for every participant. These announcements demonstrate that the digital-asset industry continues to develop through new financial products, technology, security improvements and promotional campaigns. Nevertheless, exciting headlines should never replace independent research. Before trusting any cryptocurrency announcement, verify the original information through official channels, understand the risks and check whether the relevant service is legally available in your country. The biggest lesson from this week's Binance news is that the future of crypto depends not only on innovation and trading opportunities but also on security, transparency, accountability and investor education. What do you think is the most important Binance development this week: the $6.5 billion court order, the new Stock Options API, or the 600,000 $XRP rewards campaign? Share your thoughts in the comments!#VisaPlansStablecoinPrefundingForAPACCrossBorderPayments
#MoreHikesExpectedIsBTCUnderPressure
{future}(XRPUSDT)
{stock_us}(API.US)
🚨 BINANCE LATEST NEWS: $6.5 BILLION COURT ORDER, NEW TRADING API & 600,000 XRP REWARDS!
Binance is making headlines with several important developments that could attract attention across the cryptocurrency industry. One of the biggest stories is its legal action following the October 29, 2026 security incident, which affected approximately $6.34 billion in digital assets. On November 18, Binance announced that it had obtained a $6.5 billion worldwide freezing order from the Abu Dhabi Global Market Courts as part of its efforts to recover the stolen cryptocurrency. According to reports, approximately $2.85 billion had already been frozen or intercepted through cooperation with exchanges, stablecoin issuers, blockchain investigators and law enforcement agencies. The court order is particularly significant because it provides a legal framework for identifying, freezing and potentially returning stolen assets. Binance's legal team has also identified approximately 26,000 wallet addresses associated with the stolen funds. However, investors should understand an important difference: obtaining a freezing order does not mean Binance has recovered $6.5 billion. It is a legal measure intended to prevent the movement of assets and support recovery efforts. Binance has separately stated that it has completed replenishing the assets affected by the incident using company resources and other designated funds. It has also published a new Proof of Reserves snapshot covering 198 tokens, supporting its commitment to transparency. The company has said that it intends to replenish its Secure Asset Fund for Users (SAFU) to approximately $1 billion. These developments highlight how important cybersecurity, transparency and cooperation have become in the cryptocurrency industry. For crypto users, this story is a reminder that security is not simply about protecting passwords; it also involves exchange infrastructure, wallet monitoring, blockchain intelligence and responsible risk management.
Another important development is Binance's expansion of its trading technology. On November 18, Binance announced that its Stock Options Trading API had gone live, allowing eligible users to interact with U.S.-listed stock options through programmatic tools. The API supports searching for option contracts, placing and cancelling orders, exercising eligible long positions and checking positions, trade history and settlement information. This development may interest developers and experienced market participants who want to integrate trading systems with automated technology. However, options are complex financial instruments and can involve substantial losses. Binance has also announced a campaign offering a total of 600,000 $XRP in rewards to eligible users holding Ripple USD (RLUSD). The campaign is scheduled to run from November 20 to December 18, 2026, subject to Binance's eligibility requirements and regional availability. Rewards are calculated using qualifying balances and campaign rules; they are not guaranteed income for every participant. These announcements demonstrate that the digital-asset industry continues to develop through new financial products, technology, security improvements and promotional campaigns. Nevertheless, exciting headlines should never replace independent research. Before trusting any cryptocurrency announcement, verify the original information through official channels, understand the risks and check whether the relevant service is legally available in your country. The biggest lesson from this week's Binance news is that the future of crypto depends not only on innovation and trading opportunities but also on security, transparency, accountability and investor education. What do you think is the most important Binance development this week: the $6.5 billion court order, the new Stock Options API, or the 600,000 $XRP rewards campaign? Share your thoughts in the comments!#VisaPlansStablecoinPrefundingForAPACCrossBorderPayments
#MoreHikesExpectedIsBTCUnderPressure
Another important development is Binance's expansion of its trading technology. On November 18, Binance announced that its Stock Options Trading API had gone live, allowing eligible users to interact with U.S.-listed stock options through programmatic tools. The API supports searching for option contracts, placing and cancelling orders, exercising eligible long positions and checking positions, trade history and settlement information. This development may interest developers and experienced market participants who want to integrate trading systems with automated technology. However, options are complex financial instruments and can involve substantial losses. Binance has also announced a campaign offering a total of 600,000 $XRP in rewards to eligible users holding Ripple USD (RLUSD). The campaign is scheduled to run from November 20 to December 18, 2026, subject to Binance's eligibility requirements and regional availability. Rewards are calculated using qualifying balances and campaign rules; they are not guaranteed income for every participant. These announcements demonstrate that the digital-asset industry continues to develop through new financial products, technology, security improvements and promotional campaigns. Nevertheless, exciting headlines should never replace independent research. Before trusting any cryptocurrency announcement, verify the original information through official channels, understand the risks and check whether the relevant service is legally available in your country. The biggest lesson from this week's Binance news is that the future of crypto depends not only on innovation and trading opportunities but also on security, transparency, accountability and investor education. What do you think is the most important Binance development this week: the $6.5 billion court order, the new Stock Options API, or the 600,000 $XRP rewards campaign? Share your thoughts in the comments!#VisaPlansStablecoinPrefundingForAPACCrossBorderPayments
#MoreHikesExpectedIsBTCUnderPressure
1
115
·
--
Статья
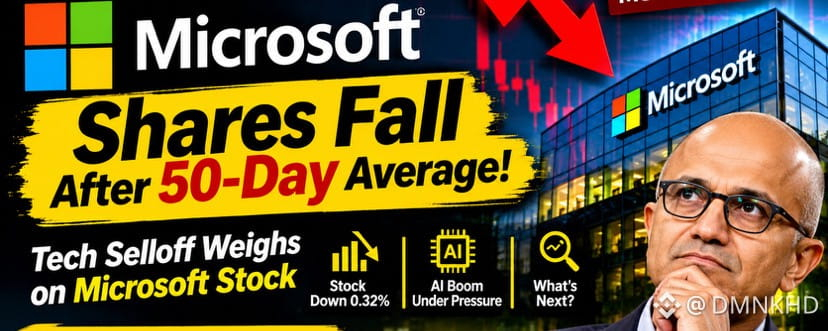
Microsoft Loses Its 50-Day Moving Average After Global Outage: Is MSFT Under Pressure?$MSFT is facing renewed market attention after its shares moved further below the important 50-day moving average following a global technology outage that affected users of Microsoft Teams and Outlook. According to the Binance News screenshot, Microsoft was trading at $504.66, down 0.32% on the day. Although the daily decline appears relatively small, the technical development has attracted attention because moving averages are commonly used by traders and investors to understand market trends and momentum. The incident also occurred during a wider wave of reported technology disruptions affecting banks, air travel, the NSA and Apple, highlighting how dependent modern businesses and institutions have become on interconnected digital infrastructure. Microsoft provides essential software and cloud-based services to businesses, educational institutions and individuals around the world. When important services experience interruptions, customers may begin asking questions about reliability, security and operational continuity. Even a temporary outage can create uncertainty because organizations depend on tools such as Teams and Outlook for communication and daily operations. At the same time, Microsoft shares have been facing pressure amid broader concerns about the technology sector and whether the rapid growth associated with artificial intelligence can continue at its current pace. Investors are evaluating the enormous spending on AI infrastructure, competition between technology companies and the possibility that future returns may not match today's expectations. The screenshot also highlights a contrasting development: NVIDIA's earnings results helped lift Nasdaq 100 futures by nearly 1%, while $MSFT remained a relative laggard during the session. This shows that even companies operating in the same technology sector can experience very different market reactions. A company can have strong long-term business opportunities while its stock price experiences short-term weakness. Therefore, investors should distinguish between a temporary market reaction, a technical breakdown and a genuine deterioration in business performance. One trading session or one service disruption alone cannot establish the long-term direction of Microsoft's share price.
Another important detail in the report is the analyst perspective. TD Cowen reportedly maintained a Buy rating on Microsoft, citing the company's artificial intelligence strategy. This suggests that some analysts continue to see potential in Microsoft's long-term AI opportunities despite the recent weakness. However, an analyst rating is an opinion, not a guarantee of future returns. The next developments could be important for determining how investors respond. First, market participants will be watching for Microsoft's official explanation of the outage, including its cause, the duration of the disruption and any measures introduced to prevent similar incidents. Second, investors will want to understand whether the event caused lasting customer impact or whether services returned to normal without significant consequences. Third, traders will monitor the 50-day moving average. A sustained move back above this level could ease some technical concerns, while continued weakness may keep pressure on market sentiment. The screenshot also mentions several wider market catalysts, including developments surrounding a possible Anthropic IPO, upcoming Federal Reserve minutes and comments from Governor Christopher Waller warning about inflation spreading. These events could influence interest-rate expectations and investor appetite for high-valuation technology stocks. Higher interest-rate expectations can create additional pressure on growth-oriented companies because investors may become less willing to pay premium valuations for future earnings. Nevertheless, Microsoft's long-term business outlook depends on much more than a moving-average indicator. Its cloud services, enterprise software, AI investments, customer relationships, competition and ability to deliver reliable products all deserve attention. For investors, the important lesson is to avoid making emotional decisions based on one negative headline or a small daily price movement. Study the company's fundamentals, understand the market environment, compare analyst expectations with actual performance and always consider risk before making financial decisions. What do you think about $MSFTB right now? Is this simply a temporary correction, or could it signal a bigger challenge for technology stocks? Share your thoughts below.
{future}(MSFTUSDT)
{spot}(MSFTBUSDT)
Microsoft Loses Its 50-Day Moving Average After Global Outage: Is MSFT Under Pressure?
$MSFT is facing renewed market attention after its shares moved further below the important 50-day moving average following a global technology outage that affected users of Microsoft Teams and Outlook. According to the Binance News screenshot, Microsoft was trading at $504.66, down 0.32% on the day. Although the daily decline appears relatively small, the technical development has attracted attention because moving averages are commonly used by traders and investors to understand market trends and momentum. The incident also occurred during a wider wave of reported technology disruptions affecting banks, air travel, the NSA and Apple, highlighting how dependent modern businesses and institutions have become on interconnected digital infrastructure. Microsoft provides essential software and cloud-based services to businesses, educational institutions and individuals around the world. When important services experience interruptions, customers may begin asking questions about reliability, security and operational continuity. Even a temporary outage can create uncertainty because organizations depend on tools such as Teams and Outlook for communication and daily operations. At the same time, Microsoft shares have been facing pressure amid broader concerns about the technology sector and whether the rapid growth associated with artificial intelligence can continue at its current pace. Investors are evaluating the enormous spending on AI infrastructure, competition between technology companies and the possibility that future returns may not match today's expectations. The screenshot also highlights a contrasting development: NVIDIA's earnings results helped lift Nasdaq 100 futures by nearly 1%, while $MSFT remained a relative laggard during the session. This shows that even companies operating in the same technology sector can experience very different market reactions. A company can have strong long-term business opportunities while its stock price experiences short-term weakness. Therefore, investors should distinguish between a temporary market reaction, a technical breakdown and a genuine deterioration in business performance. One trading session or one service disruption alone cannot establish the long-term direction of Microsoft's share price.
Another important detail in the report is the analyst perspective. TD Cowen reportedly maintained a Buy rating on Microsoft, citing the company's artificial intelligence strategy. This suggests that some analysts continue to see potential in Microsoft's long-term AI opportunities despite the recent weakness. However, an analyst rating is an opinion, not a guarantee of future returns. The next developments could be important for determining how investors respond. First, market participants will be watching for Microsoft's official explanation of the outage, including its cause, the duration of the disruption and any measures introduced to prevent similar incidents. Second, investors will want to understand whether the event caused lasting customer impact or whether services returned to normal without significant consequences. Third, traders will monitor the 50-day moving average. A sustained move back above this level could ease some technical concerns, while continued weakness may keep pressure on market sentiment. The screenshot also mentions several wider market catalysts, including developments surrounding a possible Anthropic IPO, upcoming Federal Reserve minutes and comments from Governor Christopher Waller warning about inflation spreading. These events could influence interest-rate expectations and investor appetite for high-valuation technology stocks. Higher interest-rate expectations can create additional pressure on growth-oriented companies because investors may become less willing to pay premium valuations for future earnings. Nevertheless, Microsoft's long-term business outlook depends on much more than a moving-average indicator. Its cloud services, enterprise software, AI investments, customer relationships, competition and ability to deliver reliable products all deserve attention. For investors, the important lesson is to avoid making emotional decisions based on one negative headline or a small daily price movement. Study the company's fundamentals, understand the market environment, compare analyst expectations with actual performance and always consider risk before making financial decisions. What do you think about $MSFTB right now? Is this simply a temporary correction, or could it signal a bigger challenge for technology stocks? Share your thoughts below.
Another important detail in the report is the analyst perspective. TD Cowen reportedly maintained a Buy rating on Microsoft, citing the company's artificial intelligence strategy. This suggests that some analysts continue to see potential in Microsoft's long-term AI opportunities despite the recent weakness. However, an analyst rating is an opinion, not a guarantee of future returns. The next developments could be important for determining how investors respond. First, market participants will be watching for Microsoft's official explanation of the outage, including its cause, the duration of the disruption and any measures introduced to prevent similar incidents. Second, investors will want to understand whether the event caused lasting customer impact or whether services returned to normal without significant consequences. Third, traders will monitor the 50-day moving average. A sustained move back above this level could ease some technical concerns, while continued weakness may keep pressure on market sentiment. The screenshot also mentions several wider market catalysts, including developments surrounding a possible Anthropic IPO, upcoming Federal Reserve minutes and comments from Governor Christopher Waller warning about inflation spreading. These events could influence interest-rate expectations and investor appetite for high-valuation technology stocks. Higher interest-rate expectations can create additional pressure on growth-oriented companies because investors may become less willing to pay premium valuations for future earnings. Nevertheless, Microsoft's long-term business outlook depends on much more than a moving-average indicator. Its cloud services, enterprise software, AI investments, customer relationships, competition and ability to deliver reliable products all deserve attention. For investors, the important lesson is to avoid making emotional decisions based on one negative headline or a small daily price movement. Study the company's fundamentals, understand the market environment, compare analyst expectations with actual performance and always consider risk before making financial decisions. What do you think about $MSFTB right now? Is this simply a temporary correction, or could it signal a bigger challenge for technology stocks? Share your thoughts below.
1
34
·
--
Проверено
Статья
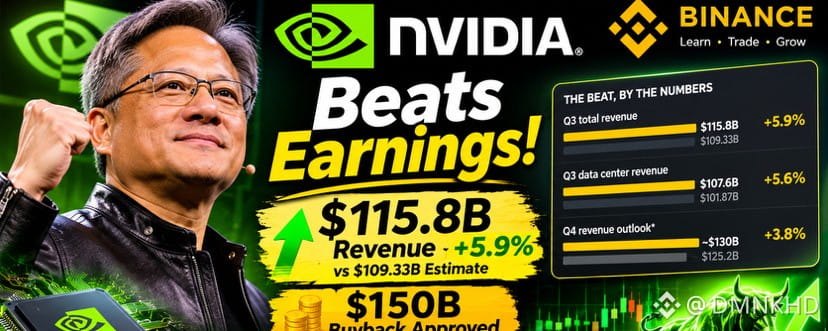
NVIDIA Beats Earnings Expectations: $115.8 Billion Revenue and $150 Billion Buyback$NVDAB third-quarter results, as presented in the Binance News screenshot, put the spotlight on demand for artificial intelligence computing. The graphic states that the company generated $115.8 billion in fiscal third-quarter revenue, compared with an analyst consensus estimate of $109.33 billion. That represents a beat of about 5.9%, while the article text says revenue was up 103% year over year. The data-center business appears to be the central driver: the graphic lists revenue at $107.6 billion, above the analyst estimate of $101.87 billion, a difference of roughly 5.6%. These figures matter because data centers house many of the processors and systems used to train and run AI models. Demand from cloud providers and businesses building AI infrastructure has made NVIDA a watched company, not only by technology investors but also by the financial market. When a company reports results above expectations, investors look beyond the number. They examine where growth came from, whether demand is sustainable, how much customers are spending, and whether the company can continue delivering products at scale. The screenshot’s figures suggest that AI infrastructure remains a major source of sales, but one quarterly report cannot prove that growth will continue at the same pace. A strong business can still have a volatile share price if expectations are already high or future results disappoint.
The outlook highlighted in the screenshot is also important. It says $NVDAB forecast fiscal fourth-quarter revenue of approximately $130 billion, compared with an analyst estimate of $125.2 billion. A forecast is management’s expectation, not a guaranteed result, so the coming quarter will show whether demand and supply conditions support that projection. The screenshot also reports that the company approved a $150 billion in share buybacks. A buyback allows a company to repurchase its own shares; it can return capital to shareholders and reduce the number of shares outstanding, although it does not automatically make a stock undervalued or guarantee a price increase. The article says NVIDIA shares rose more than 2% at one point in after-hours trading, while AI cloud providers CoreWeave and Nebius also gained. Such reactions can reflect optimism about the results and the wider AI infrastructure sector, but after-hours moves may change when trading resumes. The screenshot names Colette Kress as interim CEO; because leadership details can change, verify that statement against NVIDIA’s official investor-relations announcements before repeating it. Care applies to every number in a social-media screenshot: check the original earnings release, reporting period, whether figures are actual results or analyst estimates, and whether amounts are in US dollars. For readers following technology and markets, the main takeaway is that AI spending is influencing corporate earnings, semiconductor demand and investor sentiment. Still, this is a news summary, not a recommendation to buy or sell $NVDAB shares. Investors compare valuation, competition, customer concentration, supply constraints, cash flow and risk tolerance rather than reacting to one headline. What do you think will matter most for NVIDIA’s next quarter: continued AI demand, competition, or the ability to meet customer orders before making decisions?
{spot}(NVDABUSDT)
#NvidiaBeatsEstimatesWith$130BQ4Outlook #AnthropicIPOPriceCouldExceed$80
{future}(NVDAUSDT)
NVIDIA Beats Earnings Expectations: $115.8 Billion Revenue and $150 Billion Buyback
$NVDAB third-quarter results, as presented in the Binance News screenshot, put the spotlight on demand for artificial intelligence computing. The graphic states that the company generated $115.8 billion in fiscal third-quarter revenue, compared with an analyst consensus estimate of $109.33 billion. That represents a beat of about 5.9%, while the article text says revenue was up 103% year over year. The data-center business appears to be the central driver: the graphic lists revenue at $107.6 billion, above the analyst estimate of $101.87 billion, a difference of roughly 5.6%. These figures matter because data centers house many of the processors and systems used to train and run AI models. Demand from cloud providers and businesses building AI infrastructure has made NVIDA a watched company, not only by technology investors but also by the financial market. When a company reports results above expectations, investors look beyond the number. They examine where growth came from, whether demand is sustainable, how much customers are spending, and whether the company can continue delivering products at scale. The screenshot’s figures suggest that AI infrastructure remains a major source of sales, but one quarterly report cannot prove that growth will continue at the same pace. A strong business can still have a volatile share price if expectations are already high or future results disappoint.
The outlook highlighted in the screenshot is also important. It says $NVDAB forecast fiscal fourth-quarter revenue of approximately $130 billion, compared with an analyst estimate of $125.2 billion. A forecast is management’s expectation, not a guaranteed result, so the coming quarter will show whether demand and supply conditions support that projection. The screenshot also reports that the company approved a $150 billion in share buybacks. A buyback allows a company to repurchase its own shares; it can return capital to shareholders and reduce the number of shares outstanding, although it does not automatically make a stock undervalued or guarantee a price increase. The article says NVIDIA shares rose more than 2% at one point in after-hours trading, while AI cloud providers CoreWeave and Nebius also gained. Such reactions can reflect optimism about the results and the wider AI infrastructure sector, but after-hours moves may change when trading resumes. The screenshot names Colette Kress as interim CEO; because leadership details can change, verify that statement against NVIDIA’s official investor-relations announcements before repeating it. Care applies to every number in a social-media screenshot: check the original earnings release, reporting period, whether figures are actual results or analyst estimates, and whether amounts are in US dollars. For readers following technology and markets, the main takeaway is that AI spending is influencing corporate earnings, semiconductor demand and investor sentiment. Still, this is a news summary, not a recommendation to buy or sell $NVDAB shares. Investors compare valuation, competition, customer concentration, supply constraints, cash flow and risk tolerance rather than reacting to one headline. What do you think will matter most for NVIDIA’s next quarter: continued AI demand, competition, or the ability to meet customer orders before making decisions?
#NvidiaBeatsEstimatesWith$130BQ4Outlook #AnthropicIPOPriceCouldExceed$80
The outlook highlighted in the screenshot is also important. It says $NVDAB forecast fiscal fourth-quarter revenue of approximately $130 billion, compared with an analyst estimate of $125.2 billion. A forecast is management’s expectation, not a guaranteed result, so the coming quarter will show whether demand and supply conditions support that projection. The screenshot also reports that the company approved a $150 billion in share buybacks. A buyback allows a company to repurchase its own shares; it can return capital to shareholders and reduce the number of shares outstanding, although it does not automatically make a stock undervalued or guarantee a price increase. The article says NVIDIA shares rose more than 2% at one point in after-hours trading, while AI cloud providers CoreWeave and Nebius also gained. Such reactions can reflect optimism about the results and the wider AI infrastructure sector, but after-hours moves may change when trading resumes. The screenshot names Colette Kress as interim CEO; because leadership details can change, verify that statement against NVIDIA’s official investor-relations announcements before repeating it. Care applies to every number in a social-media screenshot: check the original earnings release, reporting period, whether figures are actual results or analyst estimates, and whether amounts are in US dollars. For readers following technology and markets, the main takeaway is that AI spending is influencing corporate earnings, semiconductor demand and investor sentiment. Still, this is a news summary, not a recommendation to buy or sell $NVDAB shares. Investors compare valuation, competition, customer concentration, supply constraints, cash flow and risk tolerance rather than reacting to one headline. What do you think will matter most for NVIDIA’s next quarter: continued AI demand, competition, or the ability to meet customer orders before making decisions?
#NvidiaBeatsEstimatesWith$130BQ4Outlook #AnthropicIPOPriceCouldExceed$80
2
2
1.2k
·
--
Статья
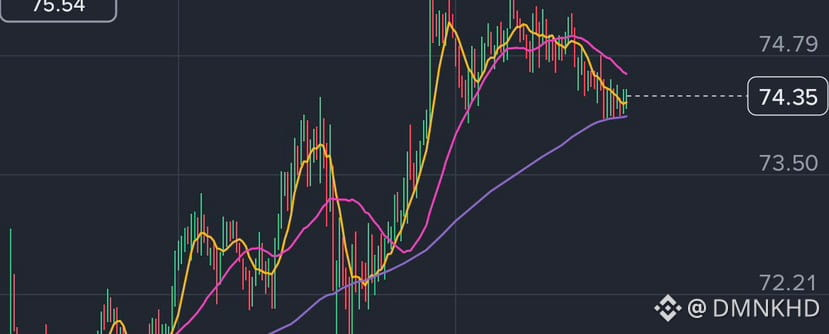
Update: Hovering at Critical SupportThe asset is currently testing a crucial technical floor, trading at 74.35 directly on the 99-period moving average (74.13), which is acting as the last line of defense. Short-term momentum has clearly shifted bearish; the price has retreated from the 75.78 peak, and the 7-period MA (74.28) has crossed below the 25-period MA (74.59). This bearish crossover confirms that sellers are in control of the immediate 15-minute trend. The primary concern is your cost price of 75.54, which means the position is underwater and struggling to find buyers near the upper end of this recent range. If the 74.13 support level fails, the next logical technical stop is around 72.21, which would significantly deepen the drawdown.
For those holding a position at 75.54, strict discipline is required at this pivot point. A bounce from 74.13 could offer a retest toward your breakeven, but a confirmed breakdown below it—especially on a 15-minute close—signals further downside. Aggressive buyers could attempt a small entry only with a tight stop-loss just under 74.00, targeting a short-term relief bounce. However, the safer approach is to wait for the price to reclaim the 25 MA (74.59) before adding exposure. If you are currently holding, consider trimming the position if support fails rather than averaging down into a falling trend. Patience and protecting capital remain the priority until the chart confirms a reversal.
$SOL
{spot}(SOLUSDT)
Update: Hovering at Critical Support
The asset is currently testing a crucial technical floor, trading at 74.35 directly on the 99-period moving average (74.13), which is acting as the last line of defense. Short-term momentum has clearly shifted bearish; the price has retreated from the 75.78 peak, and the 7-period MA (74.28) has crossed below the 25-period MA (74.59). This bearish crossover confirms that sellers are in control of the immediate 15-minute trend. The primary concern is your cost price of 75.54, which means the position is underwater and struggling to find buyers near the upper end of this recent range. If the 74.13 support level fails, the next logical technical stop is around 72.21, which would significantly deepen the drawdown.
For those holding a position at 75.54, strict discipline is required at this pivot point. A bounce from 74.13 could offer a retest toward your breakeven, but a confirmed breakdown below it—especially on a 15-minute close—signals further downside. Aggressive buyers could attempt a small entry only with a tight stop-loss just under 74.00, targeting a short-term relief bounce. However, the safer approach is to wait for the price to reclaim the 25 MA (74.59) before adding exposure. If you are currently holding, consider trimming the position if support fails rather than averaging down into a falling trend. Patience and protecting capital remain the priority until the chart confirms a reversal.
$SOL
For those holding a position at 75.54, strict discipline is required at this pivot point. A bounce from 74.13 could offer a retest toward your breakeven, but a confirmed breakdown below it—especially on a 15-minute close—signals further downside. Aggressive buyers could attempt a small entry only with a tight stop-loss just under 74.00, targeting a short-term relief bounce. However, the safer approach is to wait for the price to reclaim the 25 MA (74.59) before adding exposure. If you are currently holding, consider trimming the position if support fails rather than averaging down into a falling trend. Patience and protecting capital remain the priority until the chart confirms a reversal.
$SOL
88
·
--
Статья
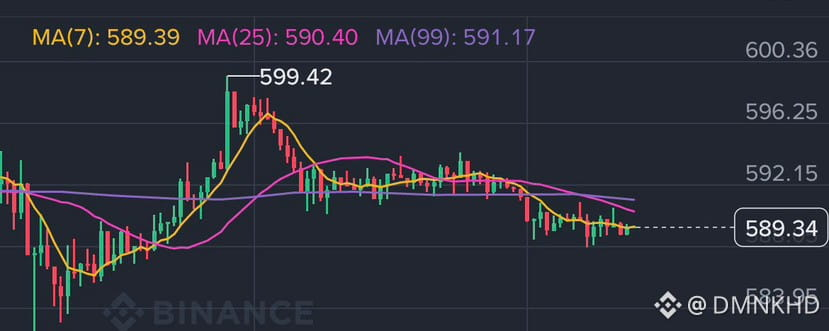
BNB Holders, Read This Before You Hit Buy 🚨$BNB remains in a fragile technical state, trading near 589.34 well below its 7, 25, and 99-period moving averages (589.39, 590.40, and 591.17). This alignment confirms sellers still control the 15-minute trend, and the failed push toward the 599.42 high left a clear ceiling of overhead resistance. Momentum shows no confirmed reversal signal yet; the price is simply consolidating near recent lows rather than building a base. The critical line in the sand is the 580.78 swing low—a break below it opens the door toward 572 and likely triggers further long liquidations. Until $BNB reclaims at least the 591–592 zone and holds above it, any bounce should be treated as a relief rally rather than a trend change.
From a risk-management perspective, this is not a clean entry point for a lump-sum buy. Aggressive traders could attempt a small speculative position near current levels with a hard stop just under 580.78, but the risk-to-reward is mediocre given the heavy overhead supply. More conservative buyers should wait for confirmation: a higher low above 580, followed by a decisive close above the moving average cluster near 591. Long-term investors may instead use a dollar-cost-averaging approach, splitting allocations into small tranches to absorb further downside. Sentiment remains dented by recent security concerns, so patience and position sizing matter more than catching the exact bottom.
{spot}(BNBUSDT)
BNB Holders, Read This Before You Hit Buy 🚨
$BNB remains in a fragile technical state, trading near 589.34 well below its 7, 25, and 99-period moving averages (589.39, 590.40, and 591.17). This alignment confirms sellers still control the 15-minute trend, and the failed push toward the 599.42 high left a clear ceiling of overhead resistance. Momentum shows no confirmed reversal signal yet; the price is simply consolidating near recent lows rather than building a base. The critical line in the sand is the 580.78 swing low—a break below it opens the door toward 572 and likely triggers further long liquidations. Until $BNB reclaims at least the 591–592 zone and holds above it, any bounce should be treated as a relief rally rather than a trend change.
From a risk-management perspective, this is not a clean entry point for a lump-sum buy. Aggressive traders could attempt a small speculative position near current levels with a hard stop just under 580.78, but the risk-to-reward is mediocre given the heavy overhead supply. More conservative buyers should wait for confirmation: a higher low above 580, followed by a decisive close above the moving average cluster near 591. Long-term investors may instead use a dollar-cost-averaging approach, splitting allocations into small tranches to absorb further downside. Sentiment remains dented by recent security concerns, so patience and position sizing matter more than catching the exact bottom.
From a risk-management perspective, this is not a clean entry point for a lump-sum buy. Aggressive traders could attempt a small speculative position near current levels with a hard stop just under 580.78, but the risk-to-reward is mediocre given the heavy overhead supply. More conservative buyers should wait for confirmation: a higher low above 580, followed by a decisive close above the moving average cluster near 591. Long-term investors may instead use a dollar-cost-averaging approach, splitting allocations into small tranches to absorb further downside. Sentiment remains dented by recent security concerns, so patience and position sizing matter more than catching the exact bottom.
1
281
·
--
Статья
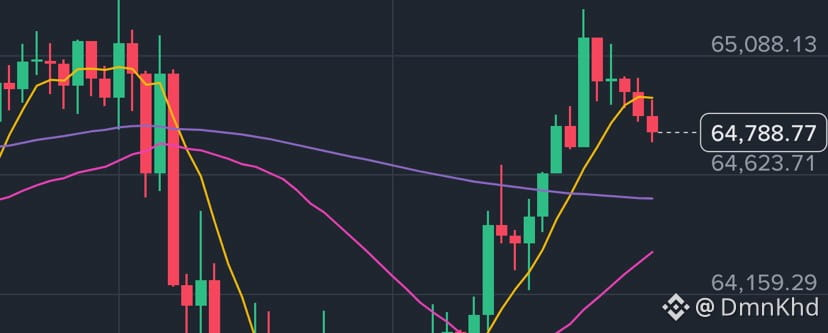
BTC at $64.7K: Relief Rally or Dead Cat Bounce?$BTC at $64.7K: Relief Rally or Dead Cat Bounce?
$BTC /USDT is currently showing a short-term relief rally on the 15-minute chart, recovering to $64,788 after a sharp flash crash down to $63,336. The price has pushed above the MA(25) and MA(99), but it is struggling to hold the short-term MA(7) at $64,923. However, this upward bounce is happening on relatively low volume compared to the massive red sell candles during the crash, indicating weak buyer conviction. Immediate resistance sits at the $65,088–$65,447 zone, where the price was recently rejected. If bulls cannot break this ceiling, the price will likely retest support at the $64,323 MA(25), with critical support down at the $63,336 low.
Zooming out, the macro picture remains heavily bearish with a -20.20% drawdown over 30 days and -30.16% over the past year, making this bounce look like a potential "dead cat bounce" rather than a true trend reversal. The market is currently choppy and consolidating after a major drop. For short-term scalpers, tight stop-losses are essential, focusing on whether the price can definitively close a 15-minute candle above $65.4K. For spot investors, this chart does not yet provide a safe bottom confirmation. Proceed with extreme caution and manage your risk carefully, as the overarching trend still favors the bears.
Disclaimer: This is technical analysis, not
financial advice. Always DYOR. #BTC #bitcoin #BinanceSquare #cryptotrading
{spot}(BTCUSDT)
BTC at $64.7K: Relief Rally or Dead Cat Bounce?
$BTC at $64.7K: Relief Rally or Dead Cat Bounce?
$BTC /USDT is currently showing a short-term relief rally on the 15-minute chart, recovering to $64,788 after a sharp flash crash down to $63,336. The price has pushed above the MA(25) and MA(99), but it is struggling to hold the short-term MA(7) at $64,923. However, this upward bounce is happening on relatively low volume compared to the massive red sell candles during the crash, indicating weak buyer conviction. Immediate resistance sits at the $65,088–$65,447 zone, where the price was recently rejected. If bulls cannot break this ceiling, the price will likely retest support at the $64,323 MA(25), with critical support down at the $63,336 low.
Zooming out, the macro picture remains heavily bearish with a -20.20% drawdown over 30 days and -30.16% over the past year, making this bounce look like a potential "dead cat bounce" rather than a true trend reversal. The market is currently choppy and consolidating after a major drop. For short-term scalpers, tight stop-losses are essential, focusing on whether the price can definitively close a 15-minute candle above $65.4K. For spot investors, this chart does not yet provide a safe bottom confirmation. Proceed with extreme caution and manage your risk carefully, as the overarching trend still favors the bears.
Disclaimer: This is technical analysis, not
financial advice. Always DYOR. #BTC #bitcoin #BinanceSquare #cryptotrading
$BTC /USDT is currently showing a short-term relief rally on the 15-minute chart, recovering to $64,788 after a sharp flash crash down to $63,336. The price has pushed above the MA(25) and MA(99), but it is struggling to hold the short-term MA(7) at $64,923. However, this upward bounce is happening on relatively low volume compared to the massive red sell candles during the crash, indicating weak buyer conviction. Immediate resistance sits at the $65,088–$65,447 zone, where the price was recently rejected. If bulls cannot break this ceiling, the price will likely retest support at the $64,323 MA(25), with critical support down at the $63,336 low.
Zooming out, the macro picture remains heavily bearish with a -20.20% drawdown over 30 days and -30.16% over the past year, making this bounce look like a potential "dead cat bounce" rather than a true trend reversal. The market is currently choppy and consolidating after a major drop. For short-term scalpers, tight stop-losses are essential, focusing on whether the price can definitively close a 15-minute candle above $65.4K. For spot investors, this chart does not yet provide a safe bottom confirmation. Proceed with extreme caution and manage your risk carefully, as the overarching trend still favors the bears.
Disclaimer: This is technical analysis, not
financial advice. Always DYOR. #BTC #bitcoin #BinanceSquare #cryptotrading
217
·
--
Проверено
Статья
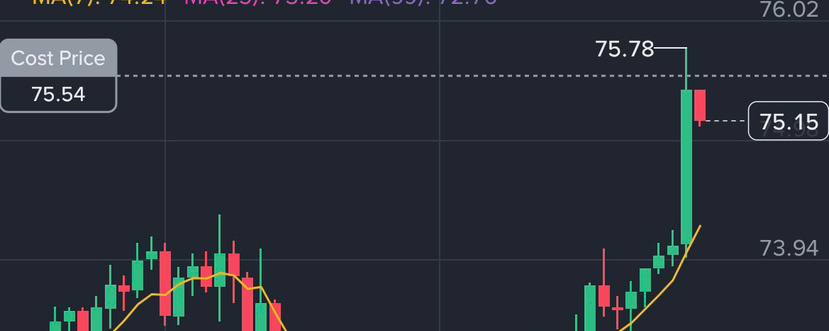
WHY SOLANA PRICE PUMPS???$SOL is staging a sharp relief rally, currently trading around $75.15 (+4.71%) after bouncing decisively from a local low of $71.07. On the 15-minute chart, the price has reclaimed its short-term moving averages (MA7 at $74.24 and MA25 at $73.20), signaling a clear intraday shift to bullish momentum. However, the immediate test is the 24-hour high of $75.78; a clean breakout above this level could open the door toward the $77 region. While the short-term setup is bullish, the broader timeframe context (30-day -26.42%) reminds us this is still a recovery play—if bulls reject at $75.78, expect a retest of the $73–$72 support cluster.
The technical bounce is backed by major fundamental catalysts. $SOL officially shed its "Beta" label in November 2026, launching the "Solana 1.0" era with the Alpenglow consensus upgrade that compresses transaction finality to 150 milliseconds. Institutional confidence is also building, with reports that ICE (NYSE's parent) is exploring Solana validator operations and DTCC planning tokenized services on the network by 2027. For your Binance Square post, frame this as a high-conviction setup: the chart shows a clean oversold recovery, but the 1.0 upgrade and institutional tailwinds provide the narrative fuel. Watch $75.78 as the trigger for continuation and $71.70 as the line in the sand.
{spot}(SOLUSDT)
WHY SOLANA PRICE PUMPS???
$SOL is staging a sharp relief rally, currently trading around $75.15 (+4.71%) after bouncing decisively from a local low of $71.07. On the 15-minute chart, the price has reclaimed its short-term moving averages (MA7 at $74.24 and MA25 at $73.20), signaling a clear intraday shift to bullish momentum. However, the immediate test is the 24-hour high of $75.78; a clean breakout above this level could open the door toward the $77 region. While the short-term setup is bullish, the broader timeframe context (30-day -26.42%) reminds us this is still a recovery play—if bulls reject at $75.78, expect a retest of the $73–$72 support cluster.
The technical bounce is backed by major fundamental catalysts. $SOL officially shed its "Beta" label in November 2026, launching the "Solana 1.0" era with the Alpenglow consensus upgrade that compresses transaction finality to 150 milliseconds. Institutional confidence is also building, with reports that ICE (NYSE's parent) is exploring Solana validator operations and DTCC planning tokenized services on the network by 2027. For your Binance Square post, frame this as a high-conviction setup: the chart shows a clean oversold recovery, but the 1.0 upgrade and institutional tailwinds provide the narrative fuel. Watch $75.78 as the trigger for continuation and $71.70 as the line in the sand.
The technical bounce is backed by major fundamental catalysts. $SOL officially shed its "Beta" label in November 2026, launching the "Solana 1.0" era with the Alpenglow consensus upgrade that compresses transaction finality to 150 milliseconds. Institutional confidence is also building, with reports that ICE (NYSE's parent) is exploring Solana validator operations and DTCC planning tokenized services on the network by 2027. For your Binance Square post, frame this as a high-conviction setup: the chart shows a clean oversold recovery, but the 1.0 upgrade and institutional tailwinds provide the narrative fuel. Watch $75.78 as the trigger for continuation and $71.70 as the line in the sand.
4
6
5.8k
·
--
Статья
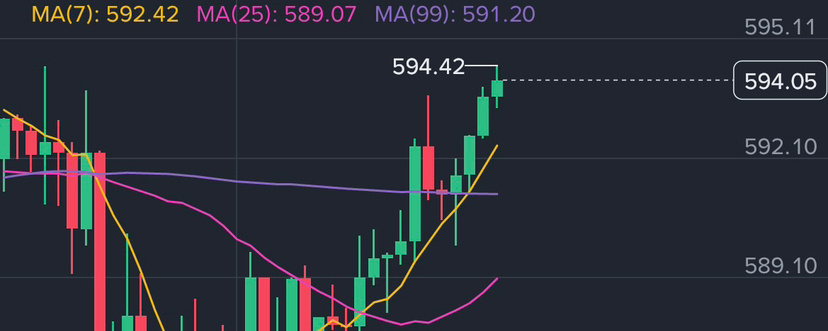
WHY BNB PRICE PUMPS???$BNB is currently trading near $583–$585, well below its key moving averages after a sharp decline triggered by the late-October Binance security breach and broader market sell-off. The token has lost roughly 23% since the hack, with bearish momentum intact: the 14-day RSI sits in oversold territory around 26, yet price remains compressed near the lower Bollinger Band without a confirmed reversal signal. Immediate support is clustered at $577–$585; a clean break below that zone would expose deeper downside, while reclaiming $600–$606 is the first prerequisite for any meaningful repair attempt.
The bullish counterweight lies in ecosystem fundamentals rather than the current tape. $BNB Chain continues to lead tokenized stocks with $1.1 billion in market cap and 1.8 million holder addresses, while institutional vehicles like YZi Labs' $100 million commitment to a $BNB holdings fund signal longer-term confidence. For your Square post, frame this as a split narrative: the chart is damaged and oversold, but the network's real-world asset traction and deflationary burn mechanics provide a structural floor that short-term price action has yet to reflect. Watch $577 as the line between stabilization and a deeper reset.
{spot}(BNBUSDT)
WHY BNB PRICE PUMPS???
$BNB is currently trading near $583–$585, well below its key moving averages after a sharp decline triggered by the late-October Binance security breach and broader market sell-off. The token has lost roughly 23% since the hack, with bearish momentum intact: the 14-day RSI sits in oversold territory around 26, yet price remains compressed near the lower Bollinger Band without a confirmed reversal signal. Immediate support is clustered at $577–$585; a clean break below that zone would expose deeper downside, while reclaiming $600–$606 is the first prerequisite for any meaningful repair attempt.
The bullish counterweight lies in ecosystem fundamentals rather than the current tape. $BNB Chain continues to lead tokenized stocks with $1.1 billion in market cap and 1.8 million holder addresses, while institutional vehicles like YZi Labs' $100 million commitment to a $BNB holdings fund signal longer-term confidence. For your Square post, frame this as a split narrative: the chart is damaged and oversold, but the network's real-world asset traction and deflationary burn mechanics provide a structural floor that short-term price action has yet to reflect. Watch $577 as the line between stabilization and a deeper reset.
The bullish counterweight lies in ecosystem fundamentals rather than the current tape. $BNB Chain continues to lead tokenized stocks with $1.1 billion in market cap and 1.8 million holder addresses, while institutional vehicles like YZi Labs' $100 million commitment to a $BNB holdings fund signal longer-term confidence. For your Square post, frame this as a split narrative: the chart is damaged and oversold, but the network's real-world asset traction and deflationary burn mechanics provide a structural floor that short-term price action has yet to reflect. Watch $577 as the line between stabilization and a deeper reset.
1
747
Войдите, чтобы посмотреть больше материала
Присоединяйтесь к пользователям криптовалют по всему миру на Binance Square
⚡️ Получайте новейшую и полезную информацию о криптоактивах.
💬 Нам доверяет крупнейшая в мире криптобиржа.
👍 Получите достоверные аналитические данные от верифицированных создателей контента.
Эл. почта/номер телефона
В тренде
BTCRemainsUnderPressureAfterHawkishFOMCMinutes
Просмотров: 46,814
628 обсуждают
FOMC Minutes | Fed Minutes Show Almost All Officials Expect More Rate Hikes, With Some Open to a Larger December Move
Binance News
·Лайков: 47
·Просмотров: 56.7k
AnthropicToDebutAfter$83IPOPricing
Просмотров: 12,012
68 обсуждают
NvidiaBoardReportedlySplitOverHuang’sReturn
Просмотров: 15,261
262 обсуждают