Binance Square
OG GrAcE
14 Публикации

OG GrAcE

OG GrAcE 💰📊🤲
Открытая сделка
Трейдер с регулярными сделками
3.3 г
32 подписок(и/а)
34 подписчиков(а)
44 понравилось
Посты
Портфель
PINNED
·
--
Статья
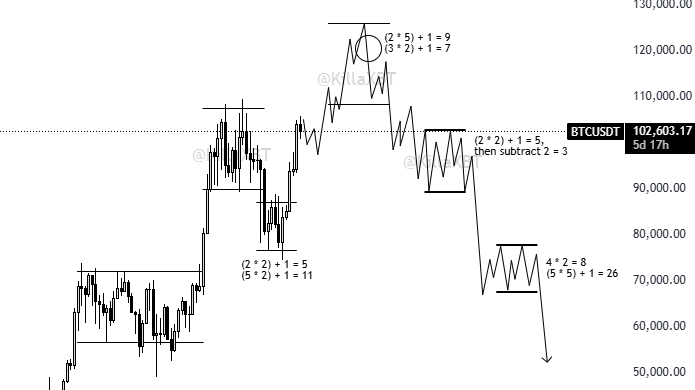
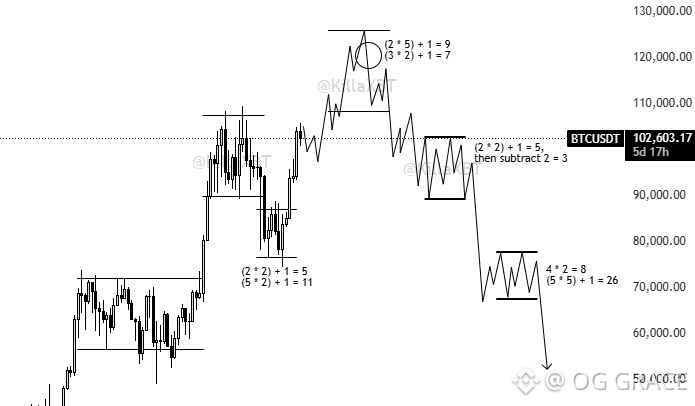
BTC Structure Breakdown — Why the Drop Wouldn’t Be RandomA lot of people think Bitcoin just “dumps out of nowhere”, but when you really study structure, you start seeing patterns repeat. This chart is a good example of that. BTC didn’t just fall — it built distribution first. After a strong move up, price started forming: Range highsFailed breakoutsCompression at resistance That’s usually where smart money offloads, not where they buy. Once that range failed, the move down wasn’t emotional — it was mechanical. You can see how price: ConsolidatesBreaks structureConsolidates againThen continues lowerMarkets don’t crash in one straight line. They step down. That’s why expecting a sudden V-reversal after distribution often traps people. The takeaway here isn’t “BTC will crash forever” — it’s this: 👉 When structure shifts, respect it. Ignoring structure is how traders get caught holding hope instead of positions. BTC Correction Isn’t the End — It’s the Setup This chart is what most people don’t want to look at calmly. Yes, Bitcoin sold off hard. Yes, structure broke. But corrections are part of every major cycle. What stands out here is how price reacts after the drop, not the drop itself. After the sell-off, BTC doesn’t immediately continue bleeding. Instead, it starts forming: A baseHigher lowsTight consolidation That’s not panic. That’s acceptance. Markets usually do this after a heavy move: Drop hardGo quietBuild a rangeThen choose direction If price holds and reclaims structure, the move up doesn’t start with hype — it starts with boredom. That’s why most people miss it. The real game is patience: Not buying topsNot selling bottoms Waiting for structure to tell you what’s next Bitcoin rewards those who wait for confirmation, not those who rush narratives.

BTC Structure Breakdown — Why the Drop Wouldn’t Be Random

A lot of people think Bitcoin just “dumps out of nowhere”, but when you really study structure, you start seeing patterns repeat.
This chart is a good example of that.
BTC didn’t just fall — it built distribution first.
After a strong move up, price started forming:
Range highsFailed breakoutsCompression at resistance
That’s usually where smart money offloads, not where they buy.
Once that range failed, the move down wasn’t emotional — it was mechanical.
You can see how price:
ConsolidatesBreaks structureConsolidates againThen continues lowerMarkets don’t crash in one straight line. They step down.
That’s why expecting a sudden V-reversal after distribution often traps people.
The takeaway here isn’t “BTC will crash forever” — it’s this:
👉 When structure shifts, respect it.
Ignoring structure is how traders get caught holding hope instead of positions.
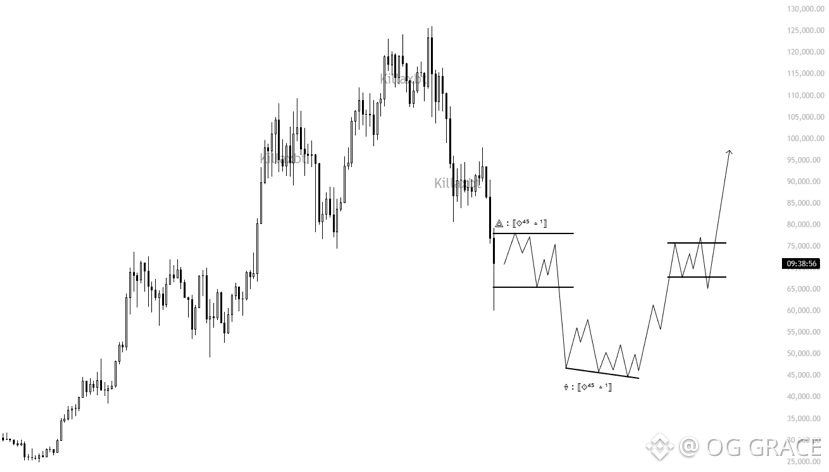
BTC Correction Isn’t the End — It’s the Setup
This chart is what most people don’t want to look at calmly.
Yes, Bitcoin sold off hard.
Yes, structure broke.
But corrections are part of every major cycle.
What stands out here is how price reacts after the drop, not the drop itself.
After the sell-off, BTC doesn’t immediately continue bleeding.
Instead, it starts forming:
A baseHigher lowsTight consolidation
That’s not panic. That’s acceptance.
Markets usually do this after a heavy move:
Drop hardGo quietBuild a rangeThen choose direction
If price holds and reclaims structure, the move up doesn’t start with hype — it starts with boredom.
That’s why most people miss it.
The real game is patience:
Not buying topsNot selling bottoms
Waiting for structure to tell you what’s next
Bitcoin rewards those who wait for confirmation, not those who rush narratives.
Well said
Well said
CRYPTO MECHANIC
·
--
Someone with a lot of money will get liquidated.
Someone with less money will get liquidated.

Someone with years of experience will get caught.
Someone who just started will get caught.

Someone with a lot of knowledge can mess up leverage.
Someone can mess up position sizing.
Someone can ignore risk management.
Someone can overtrade.
Someone can get too emotional.
Someone can become overconfident after a few wins.
Someone can panic after a few losses.
Someone can refuse to accept they’re wrong.
Someone can keep averaging into a losing position.
Someone can chase every pump.

The market has unbelievable ways of punishing everyone.

It doesn’t care who you are.

Respect risk, or the market will teach you to.
BTC Isn’t Weak — It’s Just Doing What Bitcoin Always Does A lot of people are calling Bitcoin “weak” right now, but that’s mostly emotion talking, not price action. When you step back and actually read the chart, BTC isn’t breaking down — it’s cooling off. This kind of movement has shown up many times before major expansions. What the Price Is Really Doing Bitcoin had a strong move up. After that, a pullback was expected. What matters is this: • Price is still holding important support • There’s no aggressive sell-off • Every drop is getting absorbed quietly That’s not fear. That’s balance. Why This Phase Confuses People This is the stage where: • Bulls get impatient • Bears expect a crash that never comes • Over-leveraged traders get chopped Bitcoin slows down here on purpose. It shakes out weak hands before deciding direction. Momentum Check RSI isn’t screaming oversold or overheated. MACD is flattening, not accelerating. Volume is fading, not exploding. All signs of pause, not panic. What I’m Personally Watching As long as BTC holds its key support zone, I’m not worried. Break down with real volume? Then I’ll reassess. Until then, this is just Bitcoin resetting before its next move. Bottom Line Bitcoin doesn’t move to make sense to everyone. It moves to reward patience. If you’re trading emotions, this phase hurts. If you’re trading structure, this phase makes sense. Stay sharp. Protect capital. Let price speak. {future}(BTCUSDT)
BTC Isn’t Weak — It’s Just Doing What Bitcoin Always Does

A lot of people are calling Bitcoin “weak” right now, but that’s mostly emotion talking, not price action.

When you step back and actually read the chart, BTC isn’t breaking down — it’s cooling off.

This kind of movement has shown up many times before major expansions.

What the Price Is Really Doing

Bitcoin had a strong move up. After that, a pullback was expected.

What matters is this:
• Price is still holding important support
• There’s no aggressive sell-off
• Every drop is getting absorbed quietly

That’s not fear. That’s balance.

Why This Phase Confuses People

This is the stage where:
• Bulls get impatient
• Bears expect a crash that never comes
• Over-leveraged traders get chopped

Bitcoin slows down here on purpose.
It shakes out weak hands before deciding direction.

Momentum Check

RSI isn’t screaming oversold or overheated.
MACD is flattening, not accelerating.
Volume is fading, not exploding.

All signs of pause, not panic.

What I’m Personally Watching

As long as BTC holds its key support zone, I’m not worried.

Break down with real volume?
Then I’ll reassess.

Until then, this is just Bitcoin resetting before its next move.

Bottom Line

Bitcoin doesn’t move to make sense to everyone.
It moves to reward patience.

If you’re trading emotions, this phase hurts.
If you’re trading structure, this phase makes sense.

Stay sharp. Protect capital. Let price speak.
SOL/USDT: Price Is Weak, but Smart Money Is Watching This Zone Closely Solana (SOL) is currently trading around $83 on the 4H timeframe, and while the chart looks bearish on the surface, the deeper structure tells a more interesting story. This is the kind of zone where impatience gets punished and discipline gets rewarded. ⸻ Market Structure: Controlled Sell-Off, Not Capitulation SOL remains in a short-term downtrend, trading below key moving averages. However, the selling pressure is orderly, not aggressive. • No high-volume panic candles • No long bearish expansion • Price is compressing near support This often signals distribution → stabilization, not an immediate breakdown. ⸻ Critical Support Zone: $81–$82 Price recently defended the $81.8 area, which now acts as a decision level. • Holding above this zone keeps SOL in range formation • A breakdown below $81 with volume opens the door to $76–$74 Until then, bears are losing momentum, not winning faster. ⸻ Indicator Alignment RSI (4H): • Sitting around 38–40 • Historically, SOL tends to consolidate or bounce from this RSI range MACD: • Bearish, but flattening • Momentum is slowing — a common precursor to sideways price action Volume: • Declining sell volume = selling exhaustion • Markets usually pause before choosing direction ⸻ What Needs to Happen for Strength to Return For SOL to flip bullish on the 4H timeframe: • Reclaim $85 • Hold above $88 • Break structure with volume Until then, rallies are relief bounces, not trend reversals. ⸻ This is not a FOMO zone. This is a positioning and patience zone. Experienced traders wait for confirmation. Long-term investors watch support, not emotions. The chart isn’t asking you to rush — it’s asking you to think. 📉📈 Trade smart. Protect capital.
SOL/USDT: Price Is Weak, but Smart Money Is Watching This Zone Closely

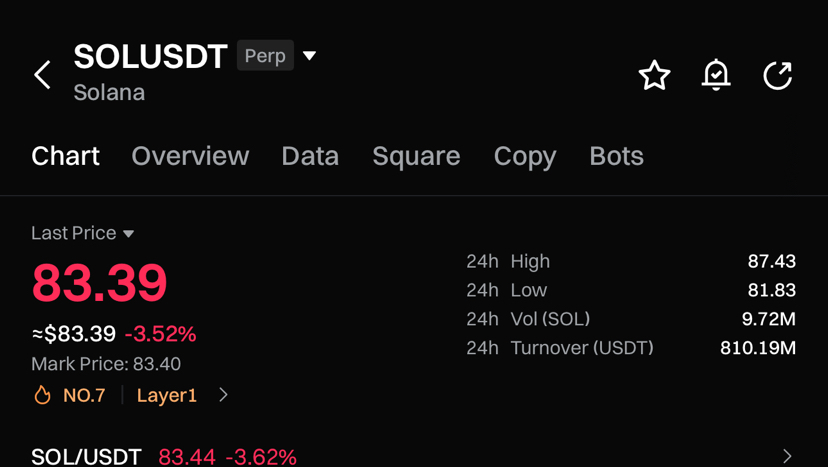
Solana (SOL) is currently trading around $83 on the 4H timeframe, and while the chart looks bearish on the surface, the deeper structure tells a more interesting story.

This is the kind of zone where impatience gets punished and discipline gets rewarded.


Market Structure: Controlled Sell-Off, Not Capitulation

SOL remains in a short-term downtrend, trading below key moving averages. However, the selling pressure is orderly, not aggressive.
• No high-volume panic candles
• No long bearish expansion
• Price is compressing near support

This often signals distribution → stabilization, not an immediate breakdown.


Critical Support Zone: $81–$82

Price recently defended the $81.8 area, which now acts as a decision level.
• Holding above this zone keeps SOL in range formation
• A breakdown below $81 with volume opens the door to $76–$74

Until then, bears are losing momentum, not winning faster.


Indicator Alignment

RSI (4H):
• Sitting around 38–40
• Historically, SOL tends to consolidate or bounce from this RSI range

MACD:
• Bearish, but flattening
• Momentum is slowing — a common precursor to sideways price action

Volume:
• Declining sell volume = selling exhaustion
• Markets usually pause before choosing direction


What Needs to Happen for Strength to Return

For SOL to flip bullish on the 4H timeframe:
• Reclaim $85
• Hold above $88
• Break structure with volume

Until then, rallies are relief bounces, not trend reversals.


This is not a FOMO zone.
This is a positioning and patience zone.

Experienced traders wait for confirmation.
Long-term investors watch support, not emotions.

The chart isn’t asking you to rush — it’s asking you to think.

📉📈 Trade smart. Protect capital.
OG GrAcE
·
--
SOL/USDT 4H Chart Analysis: Is Solana Finding Its Footing or Headed for Another Drop?
Solana (SOL) is currently trading around $83, down over 3%, and the 4-hour chart is telling an important story that traders and investors should not ignore.
Rather than guessing, let’s break down what the price action, indicators, and structure are clearly showing.

1. Market Structure: Still Under Pressure
On the 4H timeframe, SOL remains in a short-term downtrend.
Price is trading below key moving averages (EMA 20, EMA 50, and MA 100/200).
Each bounce is getting sold into, creating lower highs.
This confirms that bears are still in control for now.
Until SOL reclaims and holds above $86–$88, the structure remains weak.


2. Key Support & Demand Zone
A strong reaction occurred around $81.8, which aligns with:

• A recent swing low
Psychological demand area
This zone is acting as temporary support. If this level fails convincingly, the next downside targets are:
$80$76–$74 (higher-timeframe demand)
However, as long as $81–$82 holds, a short-term relief bounce is possible.

3. Indicators Insight
RSI (4H):
RSI is hovering around 37–40, approaching oversold territory.This suggests selling momentum is slowing, not reversing yet.MACD: • Still bearish but flattening. • Histogram shows weakening downside momentum, often seen before consolidation or a small bounce.Volume: • Declining volume indicates panic selling is cooling off. • This usually leads to range movement, not an immediate pump.4. Scenarios to Watch
Bullish Scenario (Relief Bounce):Hold above $81.8Reclaim $85
Target $88–$90 (major resistance)Bearish Scenario (Continuation):Clean breakdown below $81Increased volume on sell-side
Move toward $76–$74This is not a confirmed reversal zone yet — it’s a decision area. • Short-term traders should wait for confirmation. • Long-term holders may see this as accumulation territory, not leverage territory. • Patience here is more profitable than prediction.The market rewards discipline, not emotions.📊 Always manage risk and trade what you see, not what you hope.
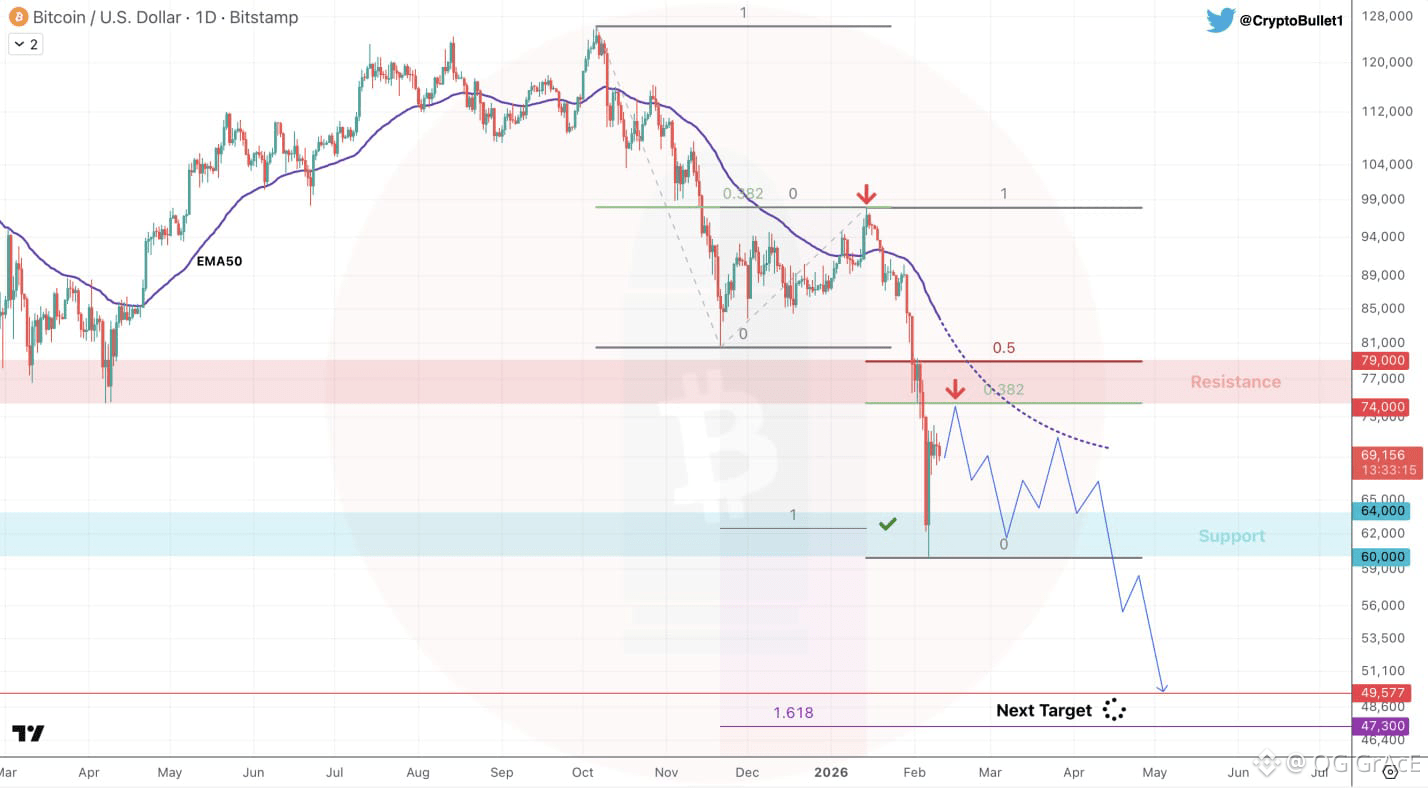
$BTC 1D chart | Game plan for the next 2 months Resistance: $74-79k Support: $60-64k I think we will spend some time between those levels before the inevitable breakdown 📉
$BTC 1D chart | Game plan for the next 2 months

Resistance: $74-79k
Support: $60-64k

I think we will spend some time between those levels before the inevitable breakdown 📉
Статья
SOL/USDT 4H Chart Analysis: Is Solana Finding Its Footing or Headed for Another Drop?Solana (SOL) is currently trading around $83, down over 3%, and the 4-hour chart is telling an important story that traders and investors should not ignore. Rather than guessing, let’s break down what the price action, indicators, and structure are clearly showing. 1. Market Structure: Still Under Pressure On the 4H timeframe, SOL remains in a short-term downtrend. Price is trading below key moving averages (EMA 20, EMA 50, and MA 100/200). Each bounce is getting sold into, creating lower highs. This confirms that bears are still in control for now. Until SOL reclaims and holds above $86–$88, the structure remains weak. {spot}(SOLUSDT) 2. Key Support & Demand Zone A strong reaction occurred around $81.8, which aligns with: • A recent swing low Psychological demand area This zone is acting as temporary support. If this level fails convincingly, the next downside targets are: $80$76–$74 (higher-timeframe demand) However, as long as $81–$82 holds, a short-term relief bounce is possible. 3. Indicators Insight RSI (4H): RSI is hovering around 37–40, approaching oversold territory.This suggests selling momentum is slowing, not reversing yet.MACD: • Still bearish but flattening. • Histogram shows weakening downside momentum, often seen before consolidation or a small bounce.Volume: • Declining volume indicates panic selling is cooling off. • This usually leads to range movement, not an immediate pump.4. Scenarios to Watch Bullish Scenario (Relief Bounce):Hold above $81.8Reclaim $85 Target $88–$90 (major resistance)Bearish Scenario (Continuation):Clean breakdown below $81Increased volume on sell-side Move toward $76–$74This is not a confirmed reversal zone yet — it’s a decision area. • Short-term traders should wait for confirmation. • Long-term holders may see this as accumulation territory, not leverage territory. • Patience here is more profitable than prediction.The market rewards discipline, not emotions.📊 Always manage risk and trade what you see, not what you hope.

SOL/USDT 4H Chart Analysis: Is Solana Finding Its Footing or Headed for Another Drop?

Solana (SOL) is currently trading around $83, down over 3%, and the 4-hour chart is telling an important story that traders and investors should not ignore.
Rather than guessing, let’s break down what the price action, indicators, and structure are clearly showing.
1. Market Structure: Still Under Pressure
On the 4H timeframe, SOL remains in a short-term downtrend.
Price is trading below key moving averages (EMA 20, EMA 50, and MA 100/200).
Each bounce is getting sold into, creating lower highs.
This confirms that bears are still in control for now.
Until SOL reclaims and holds above $86–$88, the structure remains weak.
2. Key Support & Demand Zone
A strong reaction occurred around $81.8, which aligns with:
• A recent swing low
Psychological demand area
This zone is acting as temporary support. If this level fails convincingly, the next downside targets are:
$80$76–$74 (higher-timeframe demand)
However, as long as $81–$82 holds, a short-term relief bounce is possible.
3. Indicators Insight
RSI (4H):
RSI is hovering around 37–40, approaching oversold territory.This suggests selling momentum is slowing, not reversing yet.MACD: • Still bearish but flattening. • Histogram shows weakening downside momentum, often seen before consolidation or a small bounce.Volume: • Declining volume indicates panic selling is cooling off. • This usually leads to range movement, not an immediate pump.4. Scenarios to Watch
Bullish Scenario (Relief Bounce):Hold above $81.8Reclaim $85
Target $88–$90 (major resistance)Bearish Scenario (Continuation):Clean breakdown below $81Increased volume on sell-side
Move toward $76–$74This is not a confirmed reversal zone yet — it’s a decision area. • Short-term traders should wait for confirmation. • Long-term holders may see this as accumulation territory, not leverage territory. • Patience here is more profitable than prediction.The market rewards discipline, not emotions.📊 Always manage risk and trade what you see, not what you hope.
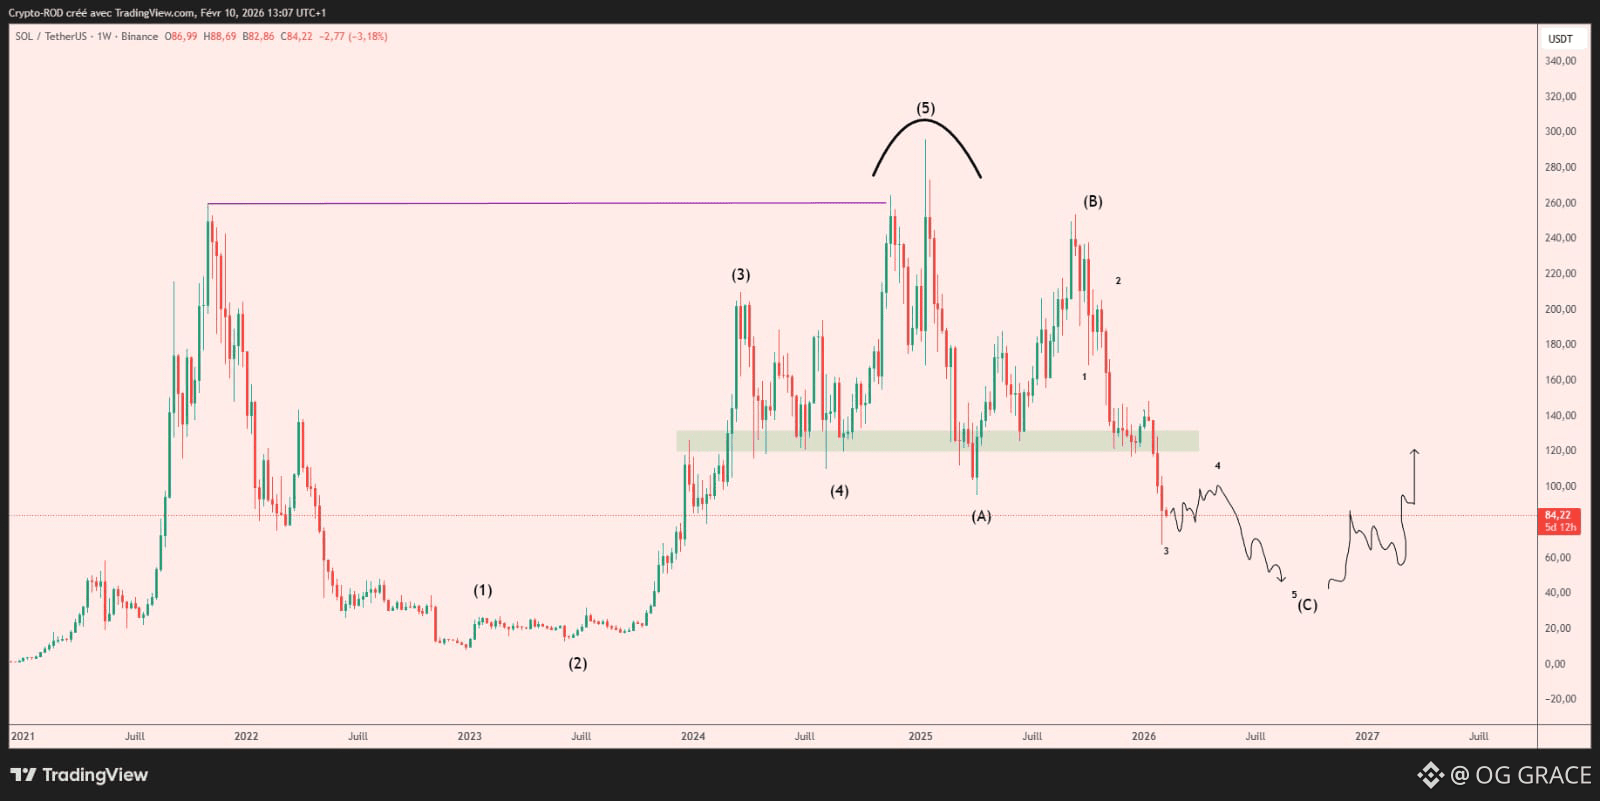
$SOL HTF bearish count update Nice move since the highs, now i think we can build the wave 4 here & finish with one more leg down for the move 5 later ✍️
$SOL HTF bearish count update

Nice move since the highs, now i think we can build the wave 4 here & finish with one more leg down for the move 5 later ✍️
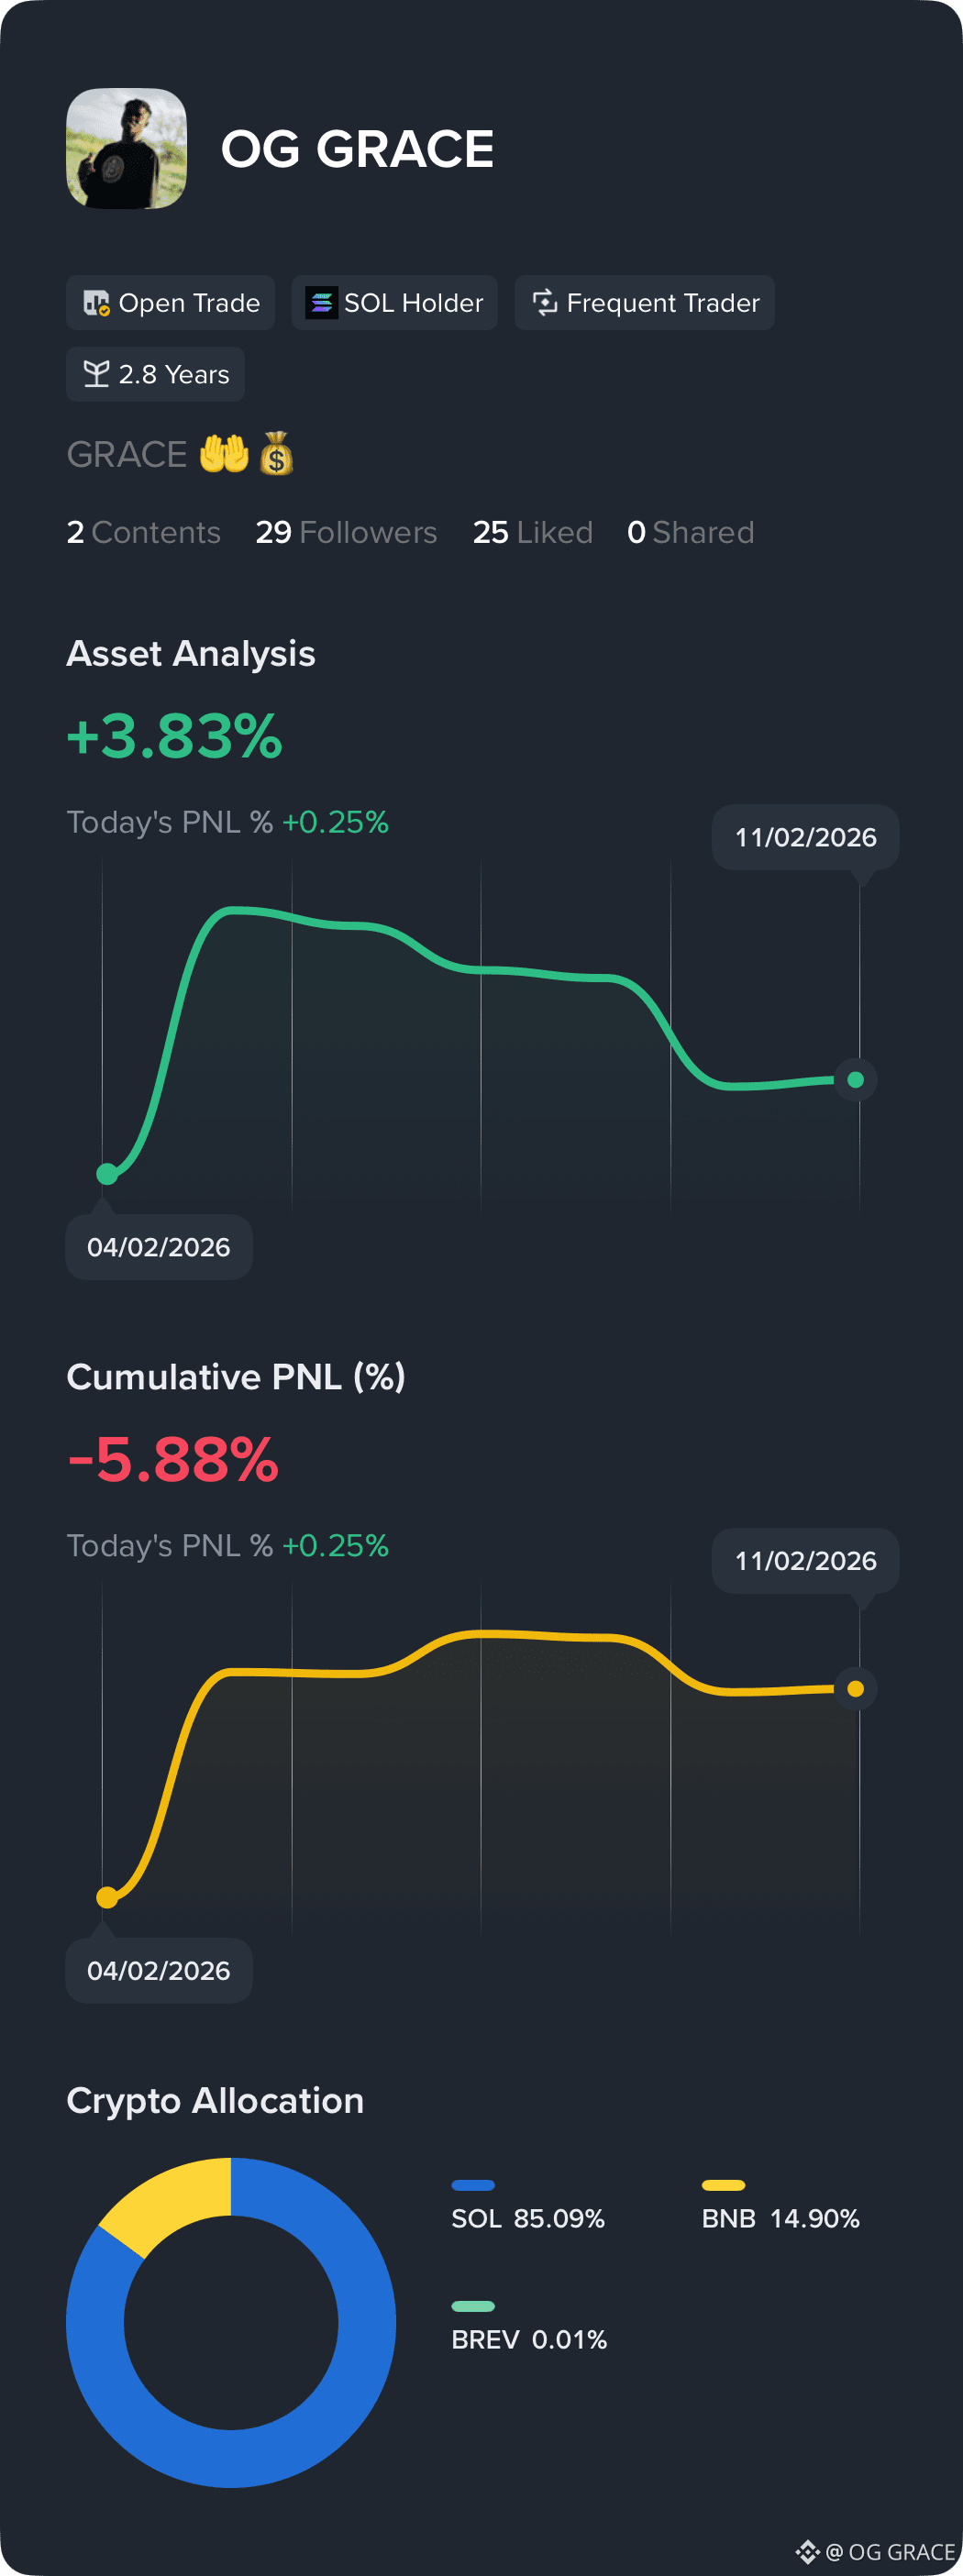
See my returns and portfolio breakdown. Follow for investment tips
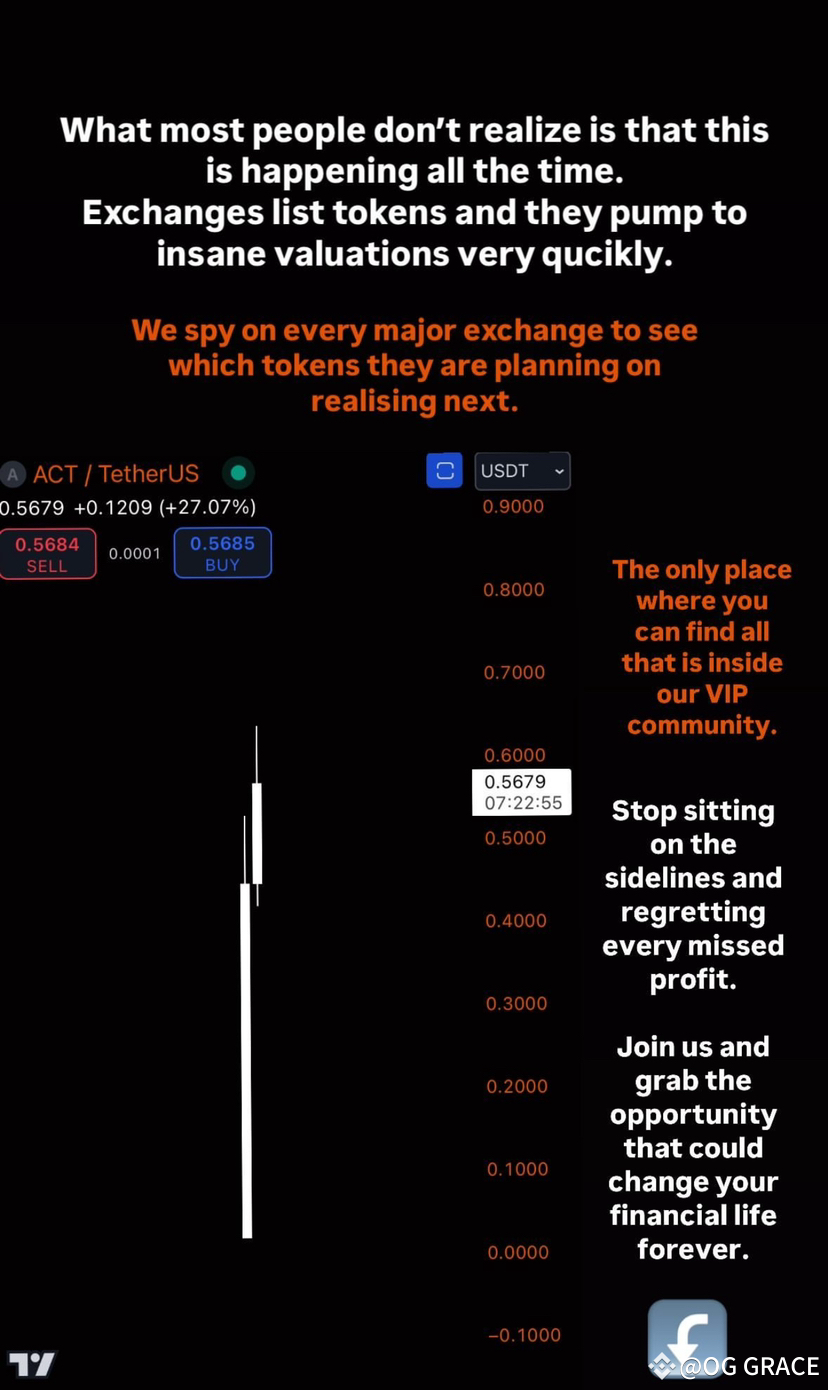
What most people don't realize is that this is happening all the time. Exchanges list tokens and they pump to insane valuations very queikly.
What most people don't realize is that this is happening all the time.
Exchanges list tokens and they pump to insane valuations very queikly.
Войдите, чтобы посмотреть больше материала
Присоединяйтесь к пользователям криптовалют по всему миру на Binance Square
⚡️ Получайте новейшую и полезную информацию о криптоактивах.
💬 Нам доверяет крупнейшая в мире криптобиржа.
👍 Получите достоверные аналитические данные от верифицированных создателей контента.
Эл. почта/номер телефона
Структура веб-страницы
Настройки cookie
Правила и условия платформы