
谷谷 GUGU
18.9k Публикации

谷谷 GUGU
大家好,我是谷谷(Gugu)。专注加密货币、区块链与 Web3 市场研究,分享市场洞察、项目解析、链上趋势与风险管理,坚持理性分析,用真实观点探索数字资产的未来。
343 подписок(и/а)
8.3K+ подписчиков(а)
1.7K+ понравилось
Посты
Все
Активно
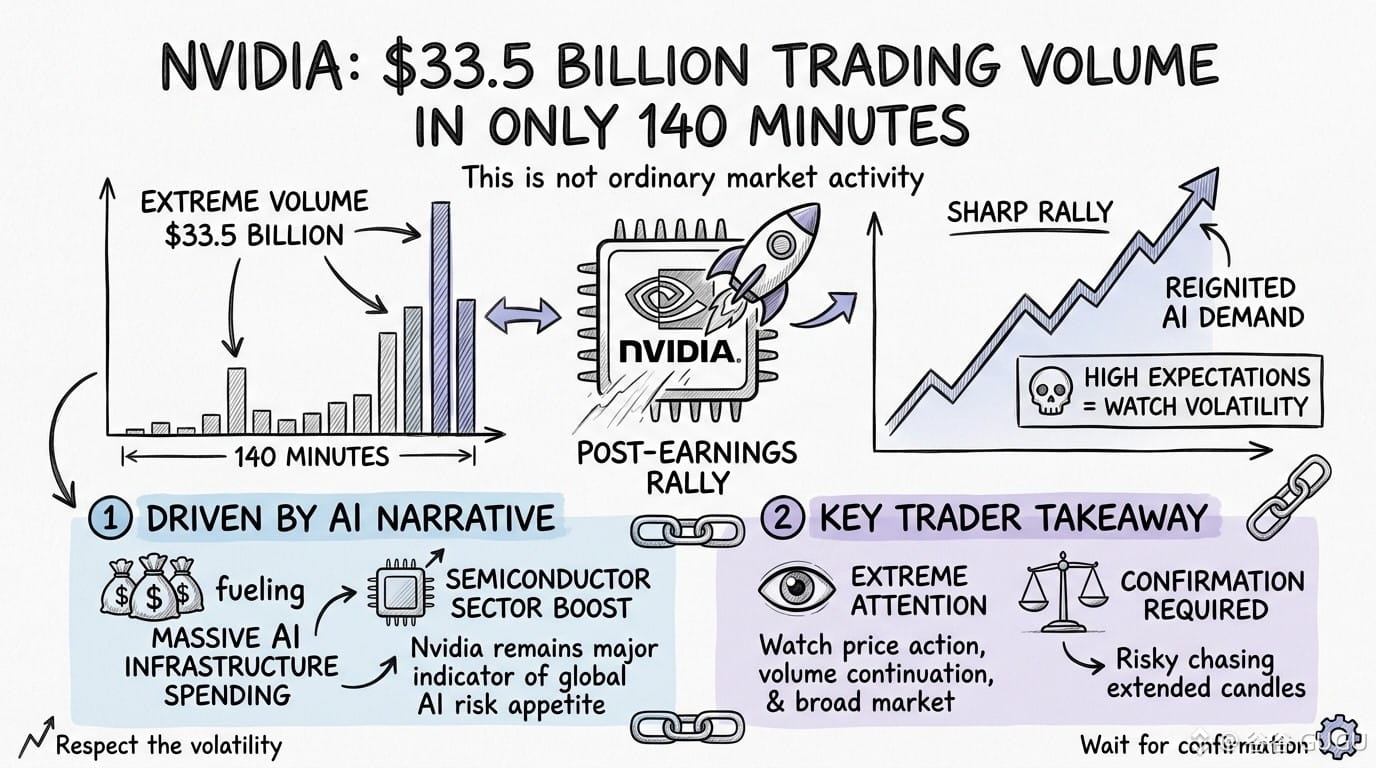
#NvidiaTrades$33.5BInFirst140Minutes
NVIDIA JUST PULLED IN $33.5 BILLION IN TRADING VOLUME IN ONLY 140 MINUTES
This is not ordinary market activity.
Nvidia saw approximately $33.5 billion in trading volume during the first 140 minutes of the session, highlighting the extraordinary level of institutional and trader attention surrounding NVDA after its latest earnings-driven momentum.
The bigger story is the AI narrative behind the move.
Nvidia's strong results and growth outlook reignited demand across the semiconductor and broader AI sector, with NVDA shares posting a sharp post-earnings rally. The company continues to benefit from massive spending on AI infrastructure, although traders should also watch for volatility as expectations remain extremely high.
For traders, the key takeaway is simple:
Extreme volume means extreme attention.
If NVDA can maintain strong volume and hold key support levels, momentum could remain in focus. But after such a powerful move, chasing extended candles without confirmation can be risky. Watch price action, volume continuation, and the broader Nasdaq and semiconductor sector before making a decision.
NVDA is no longer just an earnings trade. It has become one of the major indicators of global AI risk appetite.
Trade the momentum. Respect the volatility. Wait for confirmation
$DOS $MELANIA $ALCH
NVIDIA JUST PULLED IN $33.5 BILLION IN TRADING VOLUME IN ONLY 140 MINUTES
This is not ordinary market activity.
Nvidia saw approximately $33.5 billion in trading volume during the first 140 minutes of the session, highlighting the extraordinary level of institutional and trader attention surrounding NVDA after its latest earnings-driven momentum.
The bigger story is the AI narrative behind the move.
Nvidia's strong results and growth outlook reignited demand across the semiconductor and broader AI sector, with NVDA shares posting a sharp post-earnings rally. The company continues to benefit from massive spending on AI infrastructure, although traders should also watch for volatility as expectations remain extremely high.
For traders, the key takeaway is simple:
Extreme volume means extreme attention.
If NVDA can maintain strong volume and hold key support levels, momentum could remain in focus. But after such a powerful move, chasing extended candles without confirmation can be risky. Watch price action, volume continuation, and the broader Nasdaq and semiconductor sector before making a decision.
NVDA is no longer just an earnings trade. It has become one of the major indicators of global AI risk appetite.
Trade the momentum. Respect the volatility. Wait for confirmation
$DOS $MELANIA $ALCH
#CaliforniaBillWouldBarOfficialMemeCoins
California Moves Toward Restricting Political Meme Coins — A New Regulatory Risk for the Market
California’s proposed AB 2409 is putting political meme coins directly in the regulatory spotlight.
The bill would prohibit public officers and employees from issuing meme coins. It would also restrict digital asset service providers from listing certain meme coins for California residents when those tokens are issued by, or in partnership with, federal, state, or local public officials. The legislation remains in progress and was ordered to a third reading after recent Senate action.
For traders, this is more than a political headline.
Meme coins often trade on attention, narratives, celebrity involvement, and viral momentum. If regulatory restrictions reduce exchange access or create uncertainty around tokens linked to public officials, liquidity and sentiment could shift rapidly.
The key trading takeaway:
Regulatory headlines can create sharp volatility, especially in low-liquidity meme coins. Traders should watch for exchange announcements, geographic restrictions, declining liquidity, and sudden changes in market sentiment before taking high-risk positions.
This is a developing regulatory story, not a confirmed blanket ban on all meme coins. But it highlights a growing reality for the market: narrative-driven tokens can face regulatory risk as quickly as they gain attention.
Watch the headlines. Watch liquidity. Manage risk.
$PYPL $UAI $SNXX
California Moves Toward Restricting Political Meme Coins — A New Regulatory Risk for the Market
California’s proposed AB 2409 is putting political meme coins directly in the regulatory spotlight.
The bill would prohibit public officers and employees from issuing meme coins. It would also restrict digital asset service providers from listing certain meme coins for California residents when those tokens are issued by, or in partnership with, federal, state, or local public officials. The legislation remains in progress and was ordered to a third reading after recent Senate action.
For traders, this is more than a political headline.
Meme coins often trade on attention, narratives, celebrity involvement, and viral momentum. If regulatory restrictions reduce exchange access or create uncertainty around tokens linked to public officials, liquidity and sentiment could shift rapidly.
The key trading takeaway:
Regulatory headlines can create sharp volatility, especially in low-liquidity meme coins. Traders should watch for exchange announcements, geographic restrictions, declining liquidity, and sudden changes in market sentiment before taking high-risk positions.
This is a developing regulatory story, not a confirmed blanket ban on all meme coins. But it highlights a growing reality for the market: narrative-driven tokens can face regulatory risk as quickly as they gain attention.
Watch the headlines. Watch liquidity. Manage risk.
$PYPL $UAI $SNXX

#SOLJumps20%OnTheWeek
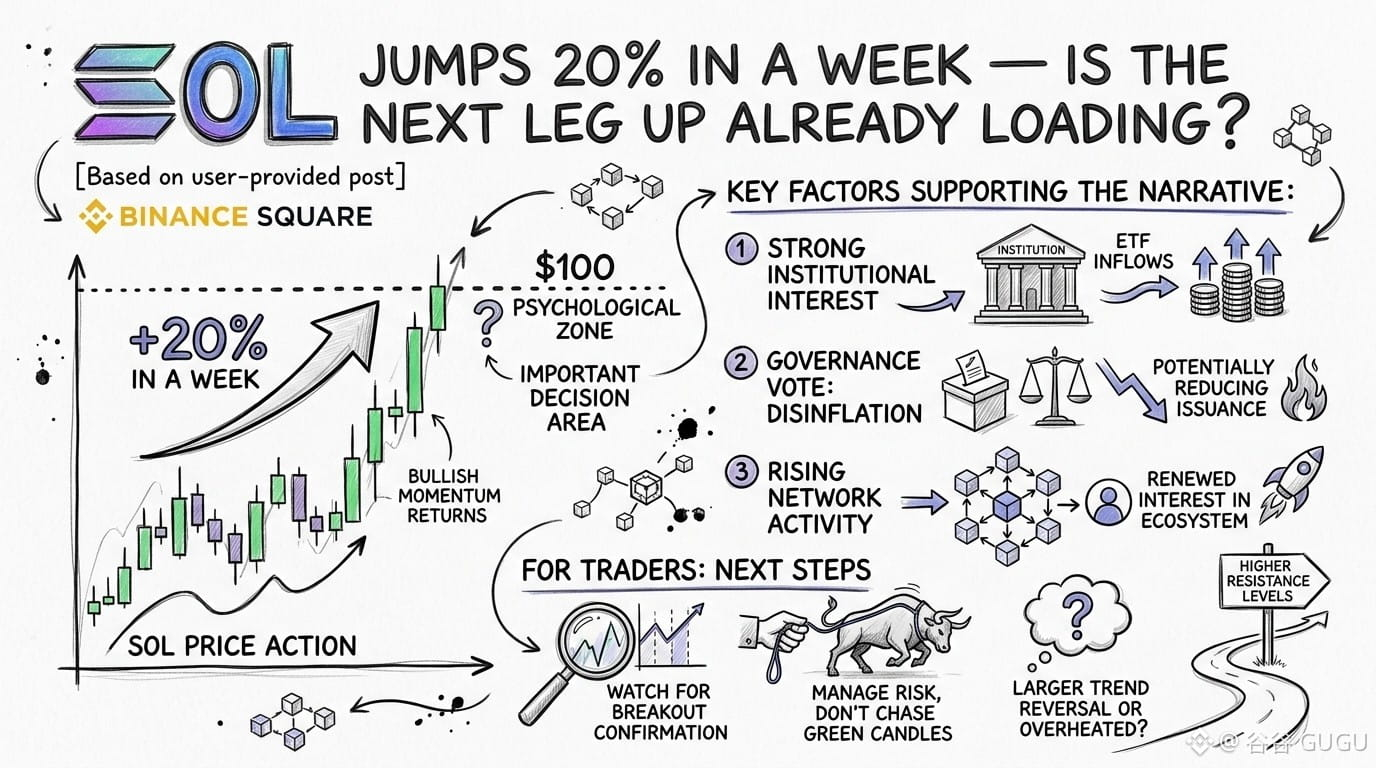
SOL JUMPS 20% IN A WEEK — IS THE NEXT LEG UP ALREADY LOADING?
Solana has delivered one of the strongest moves in the crypto market, gaining roughly 20% over the past week as bullish momentum returned across major digital assets.
But this rally is not happening in isolation.
Several factors are supporting the SOL narrative:
• Stronger institutional interest and continued ETF inflows
• A major governance vote focused on accelerating SOL’s disinflation, potentially reducing future token issuance
• Growing market momentum as SOL pushes back toward the key $100 psychological zone
• Rising network activity and renewed interest in the Solana ecosystem
The latest move has put SOL back on traders’ radar, but the market is approaching an important decision area.
A sustained breakout above the $100 region could strengthen bullish momentum and potentially open the door toward higher resistance levels. However, after such a sharp weekly rally, short-term pullbacks and volatility should also be expected.
For traders, this is the key question:
Is SOL beginning a larger trend reversal, or is the market becoming overheated after a rapid 20% move?
The smart approach is not to chase every green candle. Watch whether SOL can hold its breakout levels, monitor volume, and wait for confirmation before increasing exposure.
SOL is moving again. The next major breakout or rejection could define the next trading opportunity.
$ENA $CRM $CRWD
SOL JUMPS 20% IN A WEEK — IS THE NEXT LEG UP ALREADY LOADING?
Solana has delivered one of the strongest moves in the crypto market, gaining roughly 20% over the past week as bullish momentum returned across major digital assets.
But this rally is not happening in isolation.
Several factors are supporting the SOL narrative:
• Stronger institutional interest and continued ETF inflows
• A major governance vote focused on accelerating SOL’s disinflation, potentially reducing future token issuance
• Growing market momentum as SOL pushes back toward the key $100 psychological zone
• Rising network activity and renewed interest in the Solana ecosystem
The latest move has put SOL back on traders’ radar, but the market is approaching an important decision area.
A sustained breakout above the $100 region could strengthen bullish momentum and potentially open the door toward higher resistance levels. However, after such a sharp weekly rally, short-term pullbacks and volatility should also be expected.
For traders, this is the key question:
Is SOL beginning a larger trend reversal, or is the market becoming overheated after a rapid 20% move?
The smart approach is not to chase every green candle. Watch whether SOL can hold its breakout levels, monitor volume, and wait for confirmation before increasing exposure.
SOL is moving again. The next major breakout or rejection could define the next trading opportunity.
$ENA $CRM $CRWD
#TRONMainnetActivatesTVMPragueOsaka
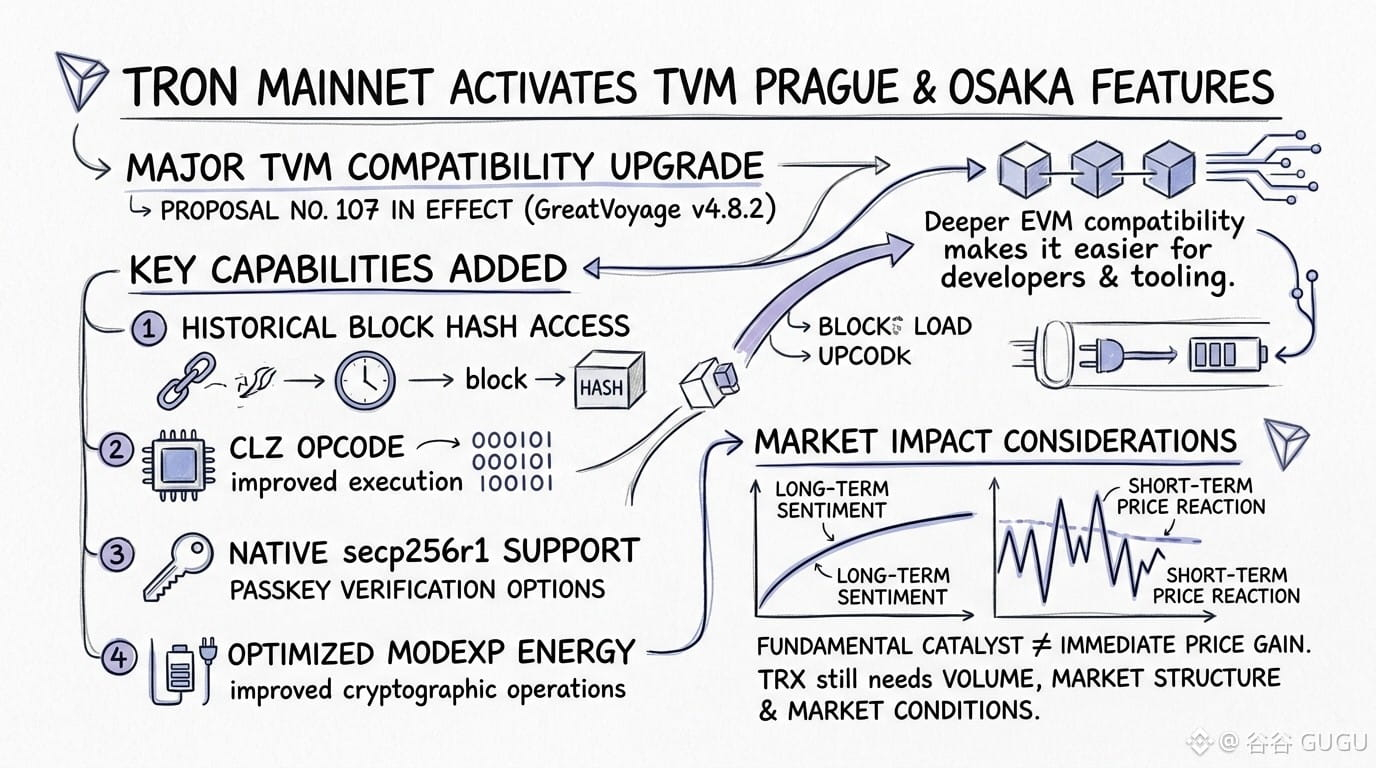
TRON MAINNET ACTIVATES TVM PRAGUE AND OSAKA FEATURES
TRON has officially moved forward with a major TVM compatibility upgrade after Mainnet Proposal No. 107 took effect, enabling Prague and Osaka-related features introduced in GreatVoyage v4.8.2.
The upgrade strengthens TRON’s compatibility with the broader Ethereum ecosystem and introduces several important capabilities, including:
• Historical block hash access from on-chain state
• The CLZ opcode for improved execution functionality
• Native secp256r1 support, opening more possibilities for Passkey verification
• Optimized MODEXP energy consumption and improved cryptographic operation handling
This is primarily a protocol and infrastructure development, not an automatic guarantee of immediate price appreciation for TRX. However, deeper EVM compatibility can make it easier for developers, smart contracts, and tooling to adapt across ecosystems, potentially strengthening TRON’s long-term development environment.
For traders, the key point is to separate the fundamental catalyst from the price reaction. Strong technical upgrades can improve long-term sentiment, but TRX still needs confirmation through volume, market structure, and broader crypto market conditions.
TRON is becoming more compatible, more developer-friendly, and more aligned with evolving Ethereum standards.
TRX traders should keep this development on the radar and watch whether the market converts the fundamental catalyst into sustained momentum.
$SKR $BAS $MANTRA
TRON MAINNET ACTIVATES TVM PRAGUE AND OSAKA FEATURES
TRON has officially moved forward with a major TVM compatibility upgrade after Mainnet Proposal No. 107 took effect, enabling Prague and Osaka-related features introduced in GreatVoyage v4.8.2.
The upgrade strengthens TRON’s compatibility with the broader Ethereum ecosystem and introduces several important capabilities, including:
• Historical block hash access from on-chain state
• The CLZ opcode for improved execution functionality
• Native secp256r1 support, opening more possibilities for Passkey verification
• Optimized MODEXP energy consumption and improved cryptographic operation handling
This is primarily a protocol and infrastructure development, not an automatic guarantee of immediate price appreciation for TRX. However, deeper EVM compatibility can make it easier for developers, smart contracts, and tooling to adapt across ecosystems, potentially strengthening TRON’s long-term development environment.
For traders, the key point is to separate the fundamental catalyst from the price reaction. Strong technical upgrades can improve long-term sentiment, but TRX still needs confirmation through volume, market structure, and broader crypto market conditions.
TRON is becoming more compatible, more developer-friendly, and more aligned with evolving Ethereum standards.
TRX traders should keep this development on the radar and watch whether the market converts the fundamental catalyst into sustained momentum.
$SKR $BAS $MANTRA
#QatarExtendsLNGForceMajeureByOneMonth
QATAR EXTENDS LNG FORCE MAJEURE BY ONE MORE MONTH — ENERGY MARKETS ARE ON ALERT
Qatar Energy has reportedly extended its LNG force majeure by another month as uncertainty continues around the recovery of energy flows through the Strait of Hormuz.
This is becoming an increasingly important development for global markets.
Qatar has historically been one of the world's most important LNG suppliers, and a prolonged disruption means buyers in Europe and Asia may need to compete harder for alternative cargoes.
The potential market impact is clear:
Higher LNG prices if supply remains restricted
Increased volatility across European and Asian gas markets
Greater demand for alternative LNG suppliers
Potential spillover into broader energy and inflation expectations
For traders, the key point is simple: this is no longer just a regional headline. A prolonged disruption in Qatar's LNG exports can tighten the global energy market and create major volatility opportunities.
The bullish scenario strengthens if supply disruptions continue, Hormuz shipping remains constrained, or additional LNG cargoes are cancelled.
However, traders should also watch for any signs of a reopening or normalization in shipping flows, as that could quickly trigger a reversal in energy prices.
MARKET BIAS: BULLISH FOR LNG AND ENERGY PRICES WHILE SUPPLY DISRUPTIONS PERSIST
This is a headline worth monitoring closely. In volatile energy markets, supply shocks can create some of the fastest and most aggressive price moves.
Trade the confirmation, manage the risk, and watch the next Qatar Energy updates closely.
$MAGMA $CHIP $CHILLGUY
QATAR EXTENDS LNG FORCE MAJEURE BY ONE MORE MONTH — ENERGY MARKETS ARE ON ALERT
Qatar Energy has reportedly extended its LNG force majeure by another month as uncertainty continues around the recovery of energy flows through the Strait of Hormuz.
This is becoming an increasingly important development for global markets.
Qatar has historically been one of the world's most important LNG suppliers, and a prolonged disruption means buyers in Europe and Asia may need to compete harder for alternative cargoes.
The potential market impact is clear:
Higher LNG prices if supply remains restricted
Increased volatility across European and Asian gas markets
Greater demand for alternative LNG suppliers
Potential spillover into broader energy and inflation expectations
For traders, the key point is simple: this is no longer just a regional headline. A prolonged disruption in Qatar's LNG exports can tighten the global energy market and create major volatility opportunities.
The bullish scenario strengthens if supply disruptions continue, Hormuz shipping remains constrained, or additional LNG cargoes are cancelled.
However, traders should also watch for any signs of a reopening or normalization in shipping flows, as that could quickly trigger a reversal in energy prices.
MARKET BIAS: BULLISH FOR LNG AND ENERGY PRICES WHILE SUPPLY DISRUPTIONS PERSIST
This is a headline worth monitoring closely. In volatile energy markets, supply shocks can create some of the fastest and most aggressive price moves.
Trade the confirmation, manage the risk, and watch the next Qatar Energy updates closely.
$MAGMA $CHIP $CHILLGUY

#USCorporateProfitsHitRecordHigh
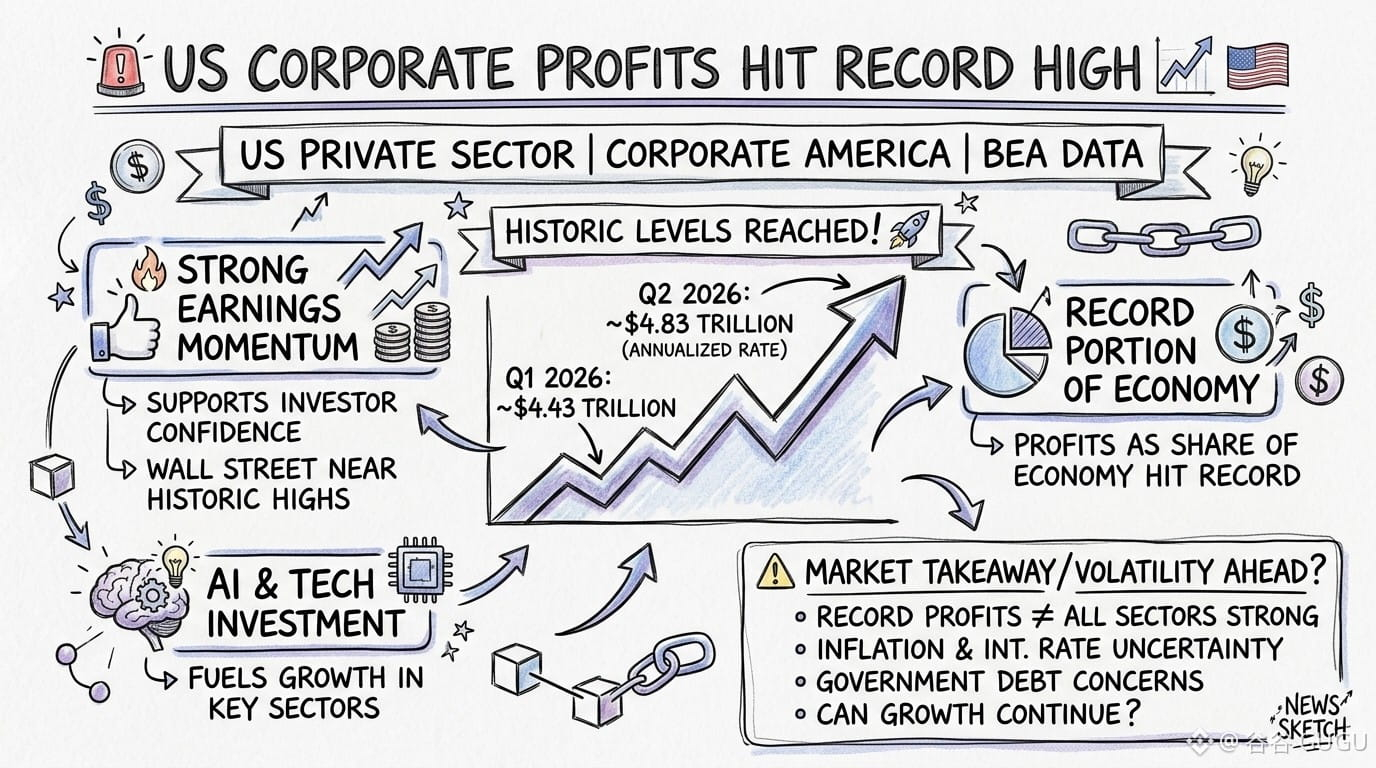
🚨 U.S. CORPORATE PROFITS HIT A RECORD HIGH 📈🇺🇸
Corporate America just delivered a major milestone.
According to the latest data from the U.S. Bureau of Economic Analysis (BEA), U.S. corporate profits from current production reached approximately $4.83 trillion at an annualized rate in Q2 2026, up sharply from about $4.43 trillion in Q1.
That surge has pushed corporate profitability to historic levels, highlighting the continued strength of the U.S. private sector.
🔹 Strong earnings momentum is supporting investor confidence
🔹 AI and technology investment continue to fuel growth in key sectors
🔹 Corporate profits as a share of the economy have reached record territory
🔹 Stronger profits have also helped support Wall Street near historic highs
But there’s another side to the story. ⚠️
Record corporate profits do not automatically mean every part of the economy is equally strong. Inflation, interest-rate uncertainty, government debt concerns, and questions around how sustainable profit growth will be could still create volatility ahead.
📊 MARKET TAKEAWAY:
For equities and corporate sentiment, the headline is clearly positive — but investors will now be watching whether these record profits can continue.
$PROM $HUMA $MOVR
🚨 U.S. CORPORATE PROFITS HIT A RECORD HIGH 📈🇺🇸
Corporate America just delivered a major milestone.
According to the latest data from the U.S. Bureau of Economic Analysis (BEA), U.S. corporate profits from current production reached approximately $4.83 trillion at an annualized rate in Q2 2026, up sharply from about $4.43 trillion in Q1.
That surge has pushed corporate profitability to historic levels, highlighting the continued strength of the U.S. private sector.
🔹 Strong earnings momentum is supporting investor confidence
🔹 AI and technology investment continue to fuel growth in key sectors
🔹 Corporate profits as a share of the economy have reached record territory
🔹 Stronger profits have also helped support Wall Street near historic highs
But there’s another side to the story. ⚠️
Record corporate profits do not automatically mean every part of the economy is equally strong. Inflation, interest-rate uncertainty, government debt concerns, and questions around how sustainable profit growth will be could still create volatility ahead.
📊 MARKET TAKEAWAY:
For equities and corporate sentiment, the headline is clearly positive — but investors will now be watching whether these record profits can continue.
$PROM $HUMA $MOVR
#TaiwanTAIEXRetakes46500OnChipRally
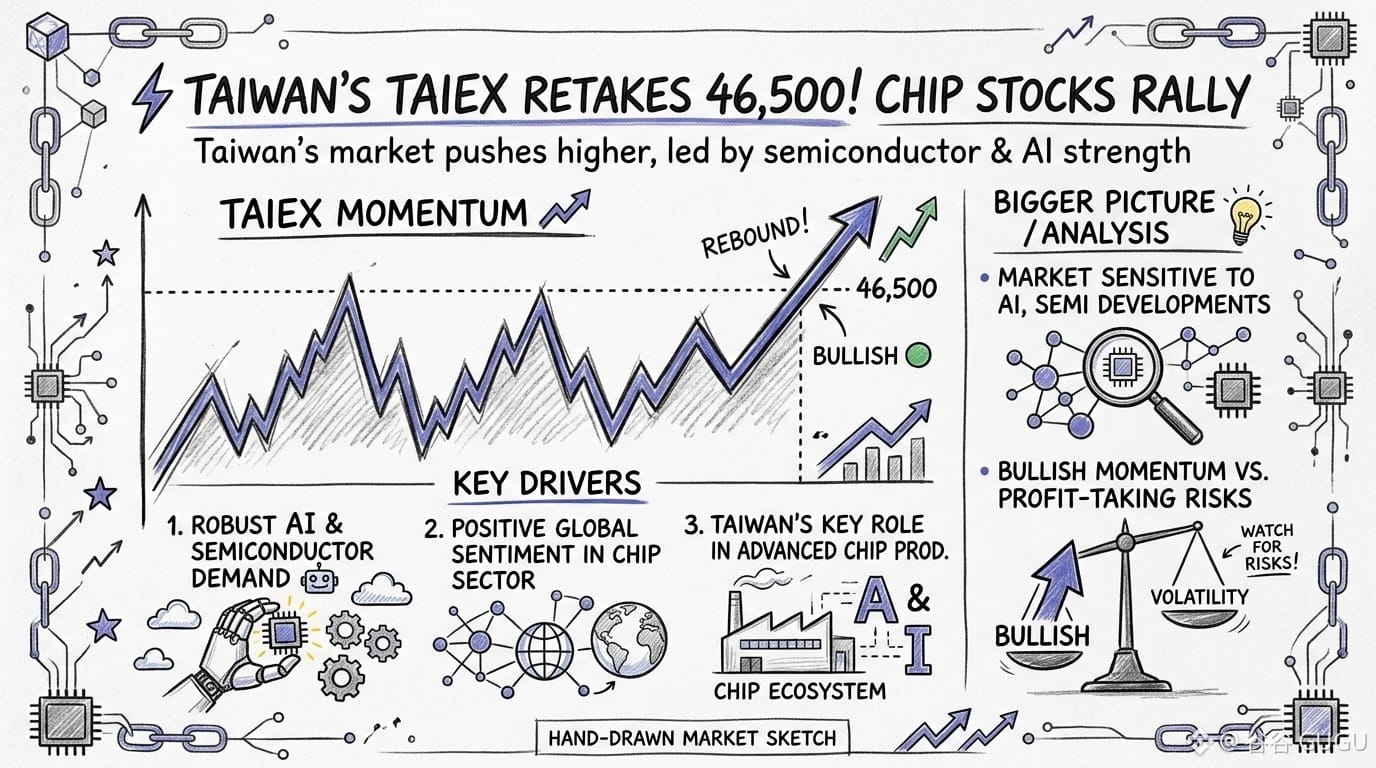
🚨 TAIWAN’S TAIEX RETAKES 46,500 AS CHIP STOCKS LEAD THE RALLY! 🇹🇼📈
Taiwan’s stock market is back in focus as the TAIEX pushes higher, driven by renewed strength in semiconductor and AI-related stocks.
The latest rebound comes as optimism around the global chip industry continues to support Taiwan’s technology-heavy market. Major semiconductor names remain at the center of investor attention, with Taiwan’s chip ecosystem playing a critical role in the global AI supply chain.
📊 What’s driving the momentum?
🔹 Renewed confidence in AI and semiconductor demand 🤖
🔹 Strength across major technology shares
🔹 Positive sentiment following strong developments in the global chip sector
🔹 Continued investor focus on Taiwan’s key role in advanced semiconductor production
Recent market reports show the TAIEX recovering strongly this week, with major technology stocks contributing to the rebound. On August 28, the index extended gains and briefly moved above 46,000, supported by optimism around AI shares following Nvidia’s earnings outlook.
💡 The bigger picture: Taiwan’s market remains highly sensitive to developments in AI, semiconductors, and global technology demand. While the rally highlights strong bullish momentum, investors should also watch for volatility and profit-taking after sharp moves.
🔥 CHIP RALLY = TAIEX MOMENTUM?
📈 Market Sentiment: BULLISH 🟢
Will semiconductor strength push Taiwan’s market even higher, or could resistance trigger another period of consolidation? 👀
$PROM $HUMA $BMT
🚨 TAIWAN’S TAIEX RETAKES 46,500 AS CHIP STOCKS LEAD THE RALLY! 🇹🇼📈
Taiwan’s stock market is back in focus as the TAIEX pushes higher, driven by renewed strength in semiconductor and AI-related stocks.
The latest rebound comes as optimism around the global chip industry continues to support Taiwan’s technology-heavy market. Major semiconductor names remain at the center of investor attention, with Taiwan’s chip ecosystem playing a critical role in the global AI supply chain.
📊 What’s driving the momentum?
🔹 Renewed confidence in AI and semiconductor demand 🤖
🔹 Strength across major technology shares
🔹 Positive sentiment following strong developments in the global chip sector
🔹 Continued investor focus on Taiwan’s key role in advanced semiconductor production
Recent market reports show the TAIEX recovering strongly this week, with major technology stocks contributing to the rebound. On August 28, the index extended gains and briefly moved above 46,000, supported by optimism around AI shares following Nvidia’s earnings outlook.
💡 The bigger picture: Taiwan’s market remains highly sensitive to developments in AI, semiconductors, and global technology demand. While the rally highlights strong bullish momentum, investors should also watch for volatility and profit-taking after sharp moves.
🔥 CHIP RALLY = TAIEX MOMENTUM?
📈 Market Sentiment: BULLISH 🟢
Will semiconductor strength push Taiwan’s market even higher, or could resistance trigger another period of consolidation? 👀
$PROM $HUMA $BMT
#KospiFallsAsAITradingEuphoriaCools
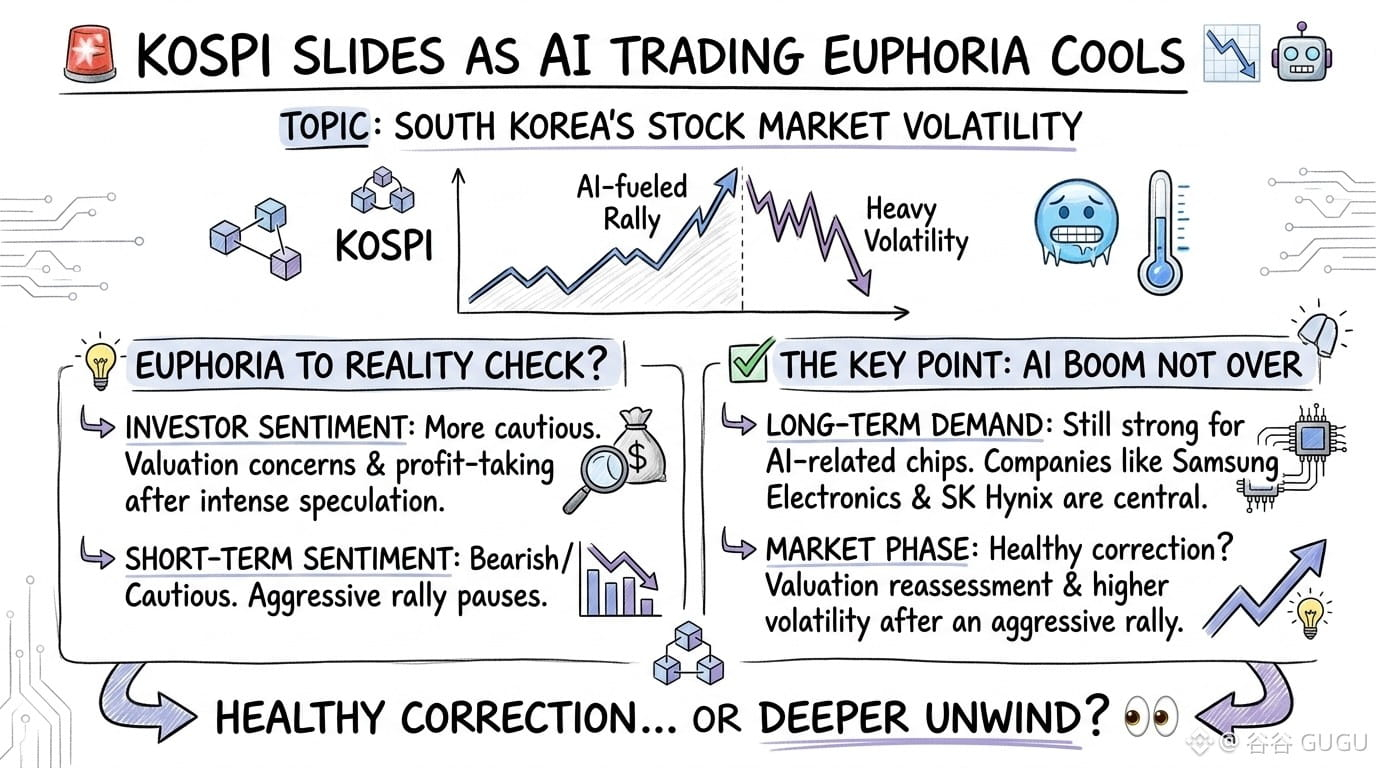
🚨 KOSPI SLIDES AS AI TRADING EUPHORIA COOLS 📉🤖
South Korea’s stock market has been experiencing sharp volatility as the powerful AI-driven trading boom loses some of its momentum.
After a period of intense speculation and leveraged bets in major AI and semiconductor names, investors have become more cautious. Concerns around valuations, profit-taking, and the sustainability of the AI trade have contributed to significant swings in the KOSPI and South Korea’s major chip stocks.
📊 Recent market reports show that the KOSPI has faced heavy volatility after its earlier AI-fueled rally, while investor sentiment toward semiconductor and AI-linked stocks has become increasingly sensitive.
But here’s the key point 👇
⚠️ Cooling euphoria does not necessarily mean the AI boom is over.
South Korea’s semiconductor industry continues to benefit from strong global demand for AI-related chips, with companies such as Samsung Electronics and SK Hynix remaining central to the global AI supply chain.
The market may simply be entering a phase of profit-taking, valuation reassessment, and higher volatility after an extremely aggressive rally.
🔥 FROM AI EUPHORIA TO REALITY CHECK?
📉 Short-term sentiment: BEARISH / CAUTIOUS
📈 Long-term AI and semiconductor demand: Still a major story
The next question for global markets is simple:
Is this a healthy correction… or the beginning of a deeper unwind in AI-linked assets? 👀
$CHIP $TRUMP $ENA
🚨 KOSPI SLIDES AS AI TRADING EUPHORIA COOLS 📉🤖
South Korea’s stock market has been experiencing sharp volatility as the powerful AI-driven trading boom loses some of its momentum.
After a period of intense speculation and leveraged bets in major AI and semiconductor names, investors have become more cautious. Concerns around valuations, profit-taking, and the sustainability of the AI trade have contributed to significant swings in the KOSPI and South Korea’s major chip stocks.
📊 Recent market reports show that the KOSPI has faced heavy volatility after its earlier AI-fueled rally, while investor sentiment toward semiconductor and AI-linked stocks has become increasingly sensitive.
But here’s the key point 👇
⚠️ Cooling euphoria does not necessarily mean the AI boom is over.
South Korea’s semiconductor industry continues to benefit from strong global demand for AI-related chips, with companies such as Samsung Electronics and SK Hynix remaining central to the global AI supply chain.
The market may simply be entering a phase of profit-taking, valuation reassessment, and higher volatility after an extremely aggressive rally.
🔥 FROM AI EUPHORIA TO REALITY CHECK?
📉 Short-term sentiment: BEARISH / CAUTIOUS
📈 Long-term AI and semiconductor demand: Still a major story
The next question for global markets is simple:
Is this a healthy correction… or the beginning of a deeper unwind in AI-linked assets? 👀
$CHIP $TRUMP $ENA
#GoldRisesAbout14%InAugust
🚨 GOLD SURGES ABOUT 14% IN AUGUST — WHAT’S DRIVING THE RALLY? 🥇📈
Gold has staged a powerful comeback this month, rising by roughly 14% in August and reaching a three-month high before experiencing some volatility. The move has put the precious metal on track for one of its strongest monthly performances in decades.
So, what’s behind the rally? 👇
🔸 Weakness in the U.S. dollar has increased the appeal of gold.
🔸 Concerns about government debt and currency debasement have pushed investors toward scarce assets and traditional stores of value.
🔸 Geopolitical and economic uncertainty has supported safe-haven demand.
🔸 Central-bank buying and renewed interest in gold ETFs have also contributed to the broader recovery.
💡 The bigger picture: Gold’s rally shows how quickly market sentiment can shift when investors become concerned about currencies, inflation, debt, and economic uncertainty.
However, after such a strong monthly move, volatility and short-term pullbacks remain possible. Future price action may depend heavily on U.S. economic data, Federal Reserve policy expectations, the dollar, and geopolitical developments.
🥇 Gold is shining again — but will the momentum continue into September?
What do you think? 👇
Bullish 🟢 or Bearish 🔴 on Gold?
$HEMI $MANTRA $EDEN
🚨 GOLD SURGES ABOUT 14% IN AUGUST — WHAT’S DRIVING THE RALLY? 🥇📈
Gold has staged a powerful comeback this month, rising by roughly 14% in August and reaching a three-month high before experiencing some volatility. The move has put the precious metal on track for one of its strongest monthly performances in decades.
So, what’s behind the rally? 👇
🔸 Weakness in the U.S. dollar has increased the appeal of gold.
🔸 Concerns about government debt and currency debasement have pushed investors toward scarce assets and traditional stores of value.
🔸 Geopolitical and economic uncertainty has supported safe-haven demand.
🔸 Central-bank buying and renewed interest in gold ETFs have also contributed to the broader recovery.
💡 The bigger picture: Gold’s rally shows how quickly market sentiment can shift when investors become concerned about currencies, inflation, debt, and economic uncertainty.
However, after such a strong monthly move, volatility and short-term pullbacks remain possible. Future price action may depend heavily on U.S. economic data, Federal Reserve policy expectations, the dollar, and geopolitical developments.
🥇 Gold is shining again — but will the momentum continue into September?
What do you think? 👇
Bullish 🟢 or Bearish 🔴 on Gold?
$HEMI $MANTRA $EDEN

$SKR
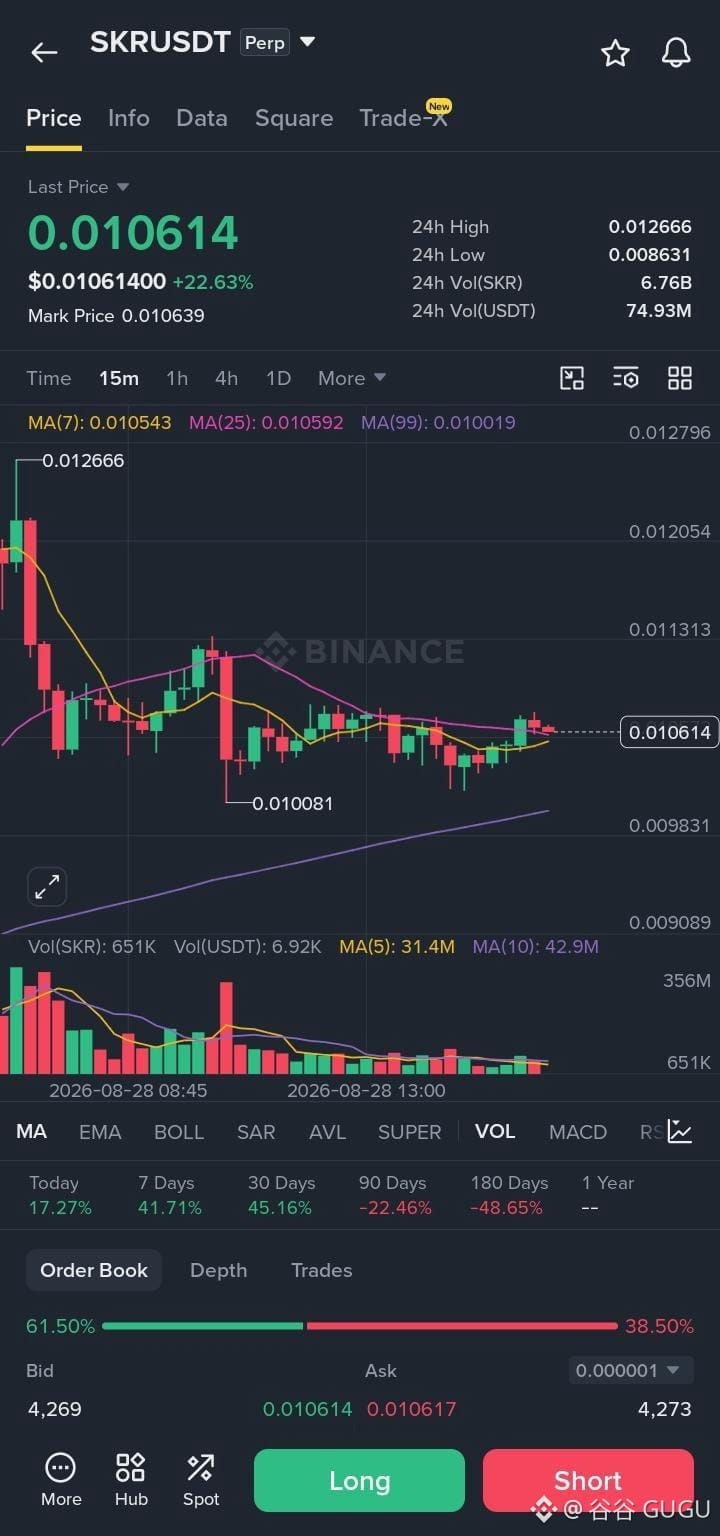
perpetual futures recently swept liquidity down to the $0.010081 support level before reclaiming both MA(7) ($0.010543) and MA(25) ($0.010592). Price is currently consolidating above the key MA(99) baseline ($0.010019) with buyers gaining structural control. A slight pull back into moving average support offers an optimal entry before momentum sweeps upper liquidations toward $0.01200+.
🎯 Trade Setup
Direction: LONG
Entry Zone $0.01030 – $0.01055
Take Profit 1 $0.01130
Take Profit 2 $0.01205
Take Profit 3 $0.01266
Stop Loss $0.00980
Risk : Reward 1:2.80
Trade Type Intraday
#SKR
perpetual futures recently swept liquidity down to the $0.010081 support level before reclaiming both MA(7) ($0.010543) and MA(25) ($0.010592). Price is currently consolidating above the key MA(99) baseline ($0.010019) with buyers gaining structural control. A slight pull back into moving average support offers an optimal entry before momentum sweeps upper liquidations toward $0.01200+.
🎯 Trade Setup
Direction: LONG
Entry Zone $0.01030 – $0.01055
Take Profit 1 $0.01130
Take Profit 2 $0.01205
Take Profit 3 $0.01266
Stop Loss $0.00980
Risk : Reward 1:2.80
Trade Type Intraday
#SKR
$BAS
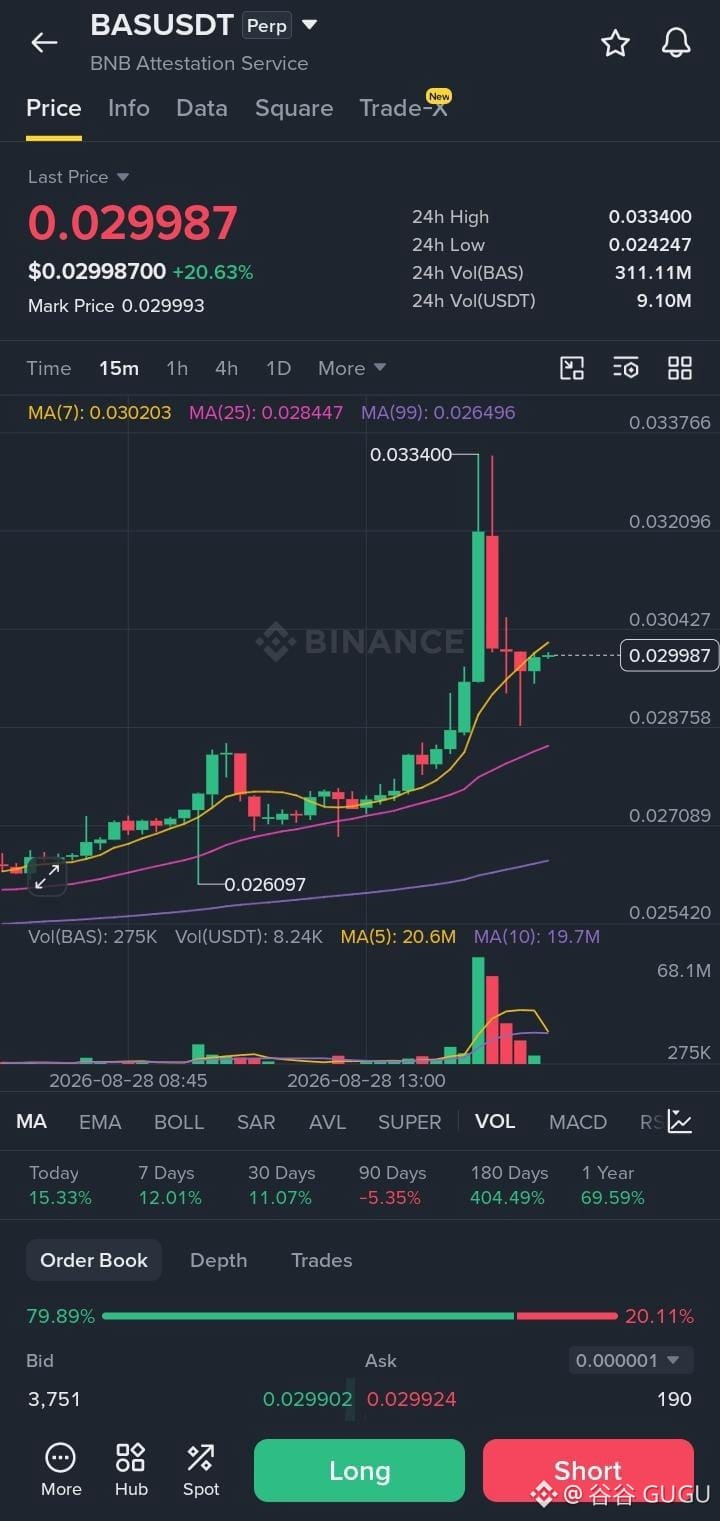
perpetual futures aggressively swept liquidity up to $0.033400 before experiencing a sharp profit-taking rejection. Price is currently compressing right near MA(7) ($0.030203) with buyers holding above MA(25) support ($0.028447). A pull back into the key moving average confluence zone offers a high-probability entry before momentum targets the high liquidity zone at $0.03340.
🎯 Trade Setup
Direction: LONG
Entry Zone $0.02850 – $0.02920
Take Profit 1 $0.03200
Take Profit 2 $0.03340
Take Profit 3 $0.03500
Stop Loss $0.02700
Risk : Reward 1:2.42
Trade Type Intraday
#basedAI
perpetual futures aggressively swept liquidity up to $0.033400 before experiencing a sharp profit-taking rejection. Price is currently compressing right near MA(7) ($0.030203) with buyers holding above MA(25) support ($0.028447). A pull back into the key moving average confluence zone offers a high-probability entry before momentum targets the high liquidity zone at $0.03340.
🎯 Trade Setup
Direction: LONG
Entry Zone $0.02850 – $0.02920
Take Profit 1 $0.03200
Take Profit 2 $0.03340
Take Profit 3 $0.03500
Stop Loss $0.02700
Risk : Reward 1:2.42
Trade Type Intraday
#basedAI
$TRUMP
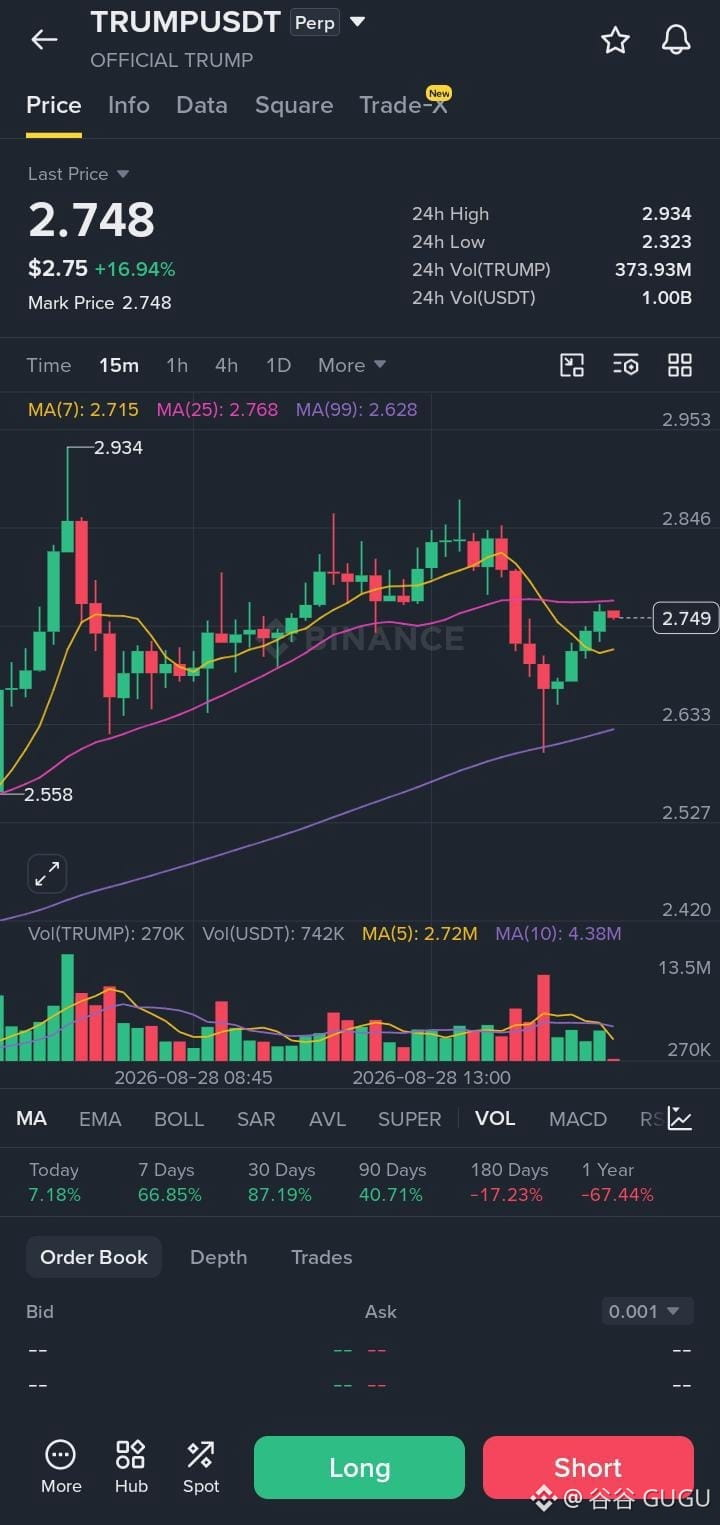
perpetual futures swept liquidity near the $2.558 local low and reclaimed the key MA(99) level ($2.628). Price is currently testing overhead resistance near MA(25) ($2.768) after a bullish pullback structure. Acceptance above $2.770 will trigger a short squeeze toward the upper liquidity pool at $2.934.
🎯 Trade Setup
Direction: LONG
Entry Zone $2.680 – $2.720
Take Profit 1 $2.846
Take Profit 2 $2.934
Take Profit 3 $3.080
Stop Loss $2.590
Risk : Reward 1:2.35
Trade Type Intraday
#TRUMP
perpetual futures swept liquidity near the $2.558 local low and reclaimed the key MA(99) level ($2.628). Price is currently testing overhead resistance near MA(25) ($2.768) after a bullish pullback structure. Acceptance above $2.770 will trigger a short squeeze toward the upper liquidity pool at $2.934.
🎯 Trade Setup
Direction: LONG
Entry Zone $2.680 – $2.720
Take Profit 1 $2.846
Take Profit 2 $2.934
Take Profit 3 $3.080
Stop Loss $2.590
Risk : Reward 1:2.35
Trade Type Intraday
#TRUMP
$CHILLGUY
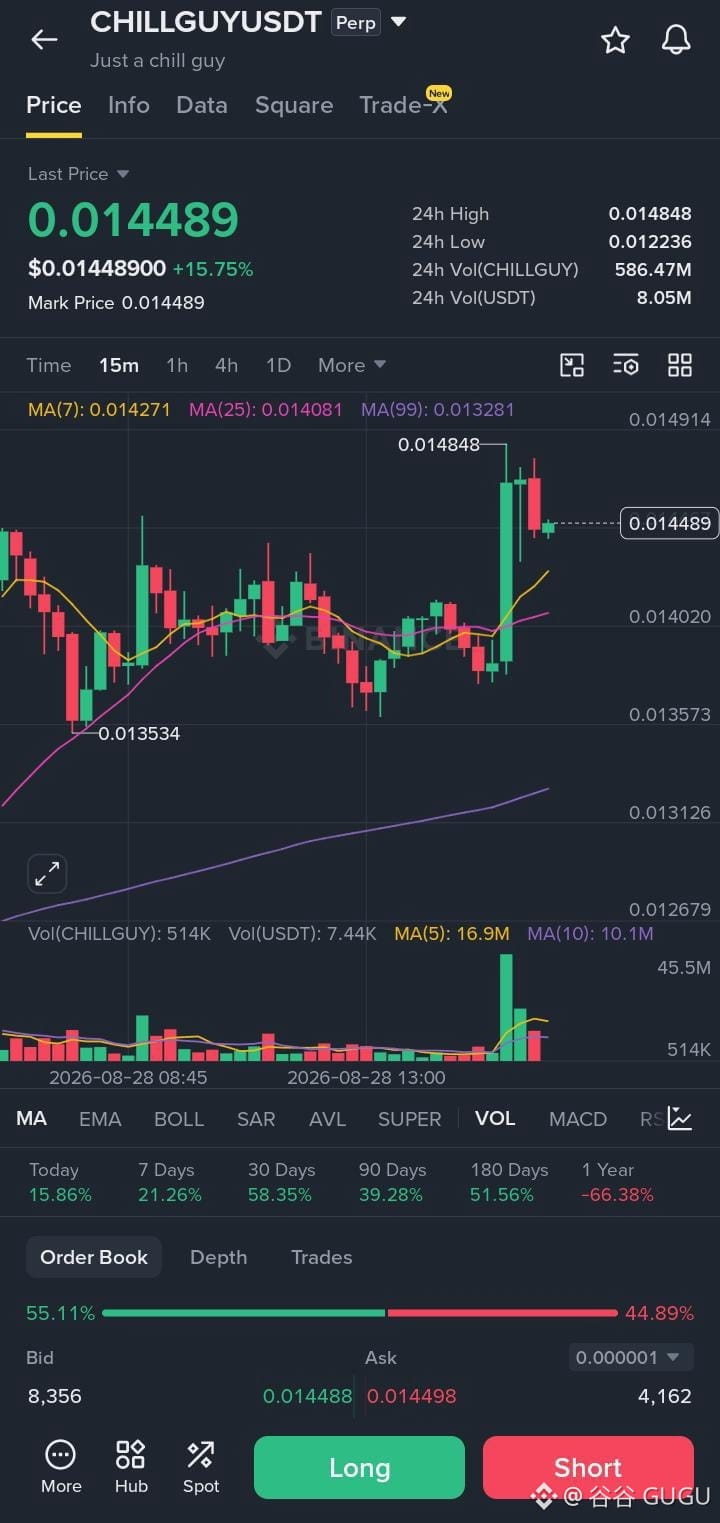
perpetual futures broke structure upward after sweeping $0.01353 low, expanding with high buy volume into $0.01484. Price is consolidating above MA(7) ($0.01427) and MA(25) ($0.01408) as buyers absorb sell liquidity. A pullback to the moving average confluence offers a high-probability long before testing upside liquidation pools.
🎯 Trade Setup
Direction: LONG
Entry Zone $0.01408 – $0.01427
Take Profit 1 $0.01484
Take Profit 2 $0.01520
Take Profit 3 $0.01580
Stop Loss $0.01370
Risk : Reward 1:2.85
Trade Type Intraday
#CHILLGUY
perpetual futures broke structure upward after sweeping $0.01353 low, expanding with high buy volume into $0.01484. Price is consolidating above MA(7) ($0.01427) and MA(25) ($0.01408) as buyers absorb sell liquidity. A pullback to the moving average confluence offers a high-probability long before testing upside liquidation pools.
🎯 Trade Setup
Direction: LONG
Entry Zone $0.01408 – $0.01427
Take Profit 1 $0.01484
Take Profit 2 $0.01520
Take Profit 3 $0.01580
Stop Loss $0.01370
Risk : Reward 1:2.85
Trade Type Intraday
#CHILLGUY
$HEMI
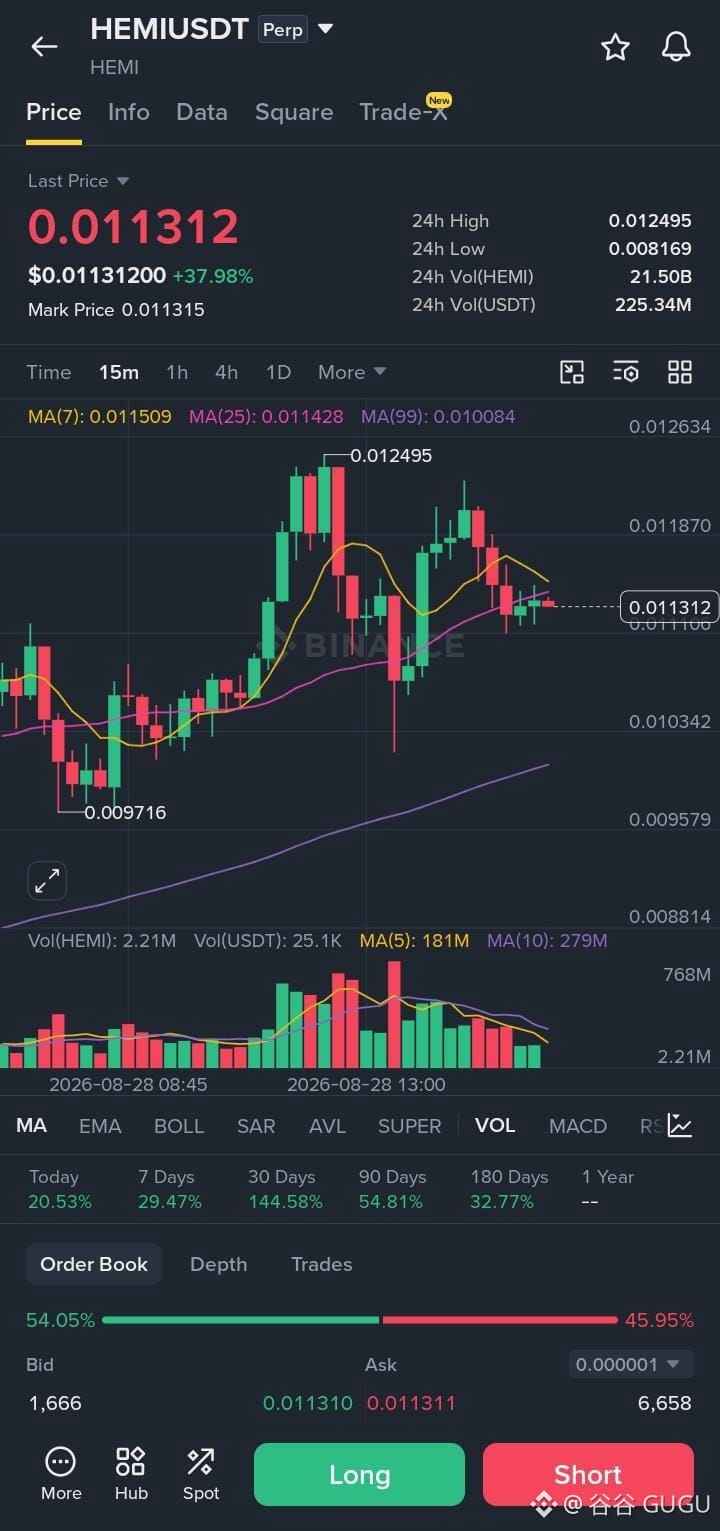
USDT Perp extended +37.98% up to a local peak of $0.012495 before pulling back into a consolidation range around $0.011312. Price is hovering around MA(7) ($0.011509) and MA(25) ($0.011428) as selling volume contracts and buyers defend higher low support near $0.0108. Liquidity rests above $0.012495 where late shorts are exposed, making a pullback retest into dynamic support favorable for a continuation sweep.
🎯 Trade Setup
Direction: LONG
Entry Zone $0.01080 – $0.01120
Take Profit 1 $0.01245
Take Profit 2 $0.01350
Take Profit 3 $0.01480
Stop Loss $0.01000
Risk : Reward 1.5
Trade Type Scalp
#HEMI
USDT Perp extended +37.98% up to a local peak of $0.012495 before pulling back into a consolidation range around $0.011312. Price is hovering around MA(7) ($0.011509) and MA(25) ($0.011428) as selling volume contracts and buyers defend higher low support near $0.0108. Liquidity rests above $0.012495 where late shorts are exposed, making a pullback retest into dynamic support favorable for a continuation sweep.
🎯 Trade Setup
Direction: LONG
Entry Zone $0.01080 – $0.01120
Take Profit 1 $0.01245
Take Profit 2 $0.01350
Take Profit 3 $0.01480
Stop Loss $0.01000
Risk : Reward 1.5
Trade Type Scalp
#HEMI
$MAGMA
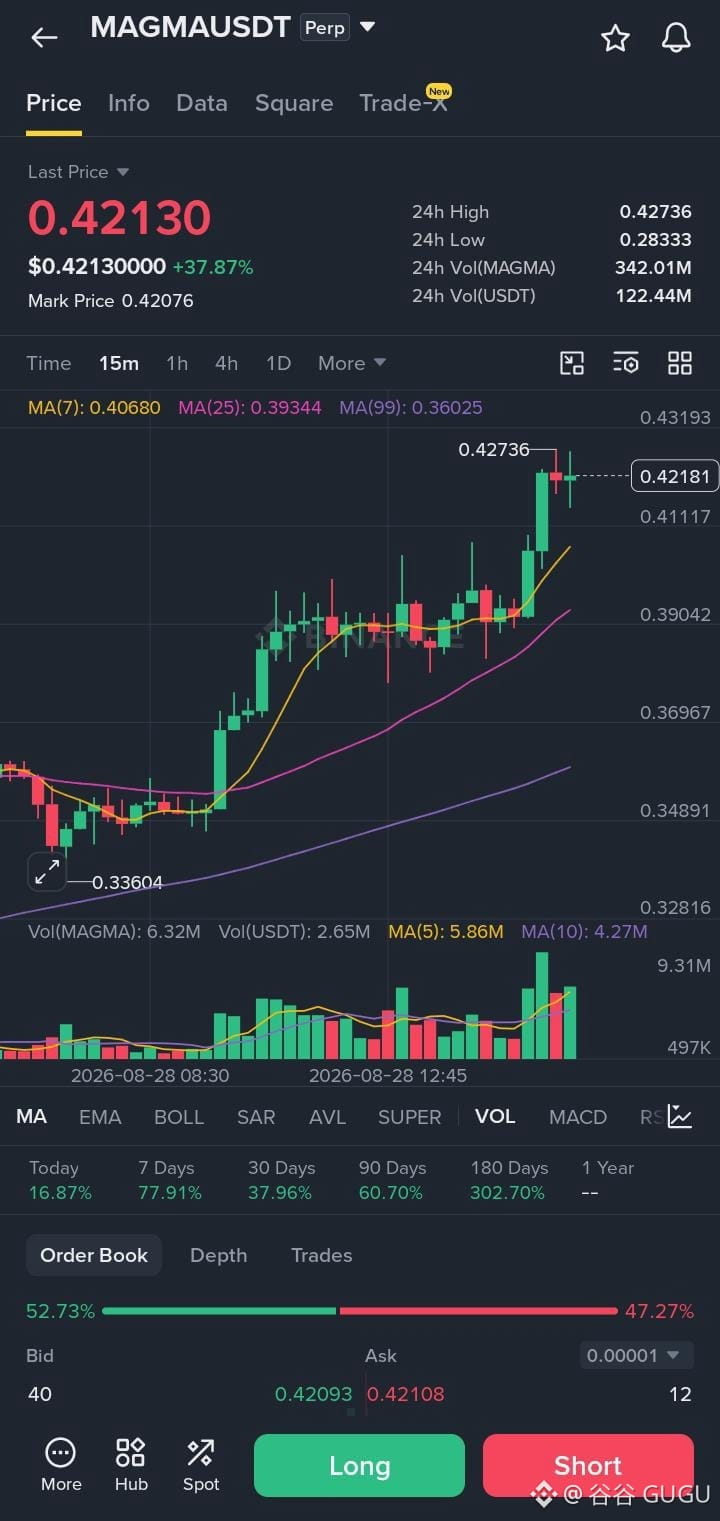
USDT Perp is in a bullish expansion (+37.87%), breaking out from consolidated range compression near $0.390 to hit a high of $0.42736. Price trades above key moving averages MA(7) ($0.40680) and MA(25) ($0.39344) with healthy buying volume (52.73% Bids). A pullback into the MA(7) dynamic demand zone offers an institutional long entry before sweeping trapped shorts resting above $0.42736.
🎯 Trade Setup
Direction: LONG
Entry Zone $0.4050 – $0.4150
Take Profit 1 $0.4273
Take Profit 2 $0.4450
Take Profit 3 $0.4700
Stop Loss $0.3900
Risk : Reward 1.6
Trade Type Scalp
#MAGMASHORT
USDT Perp is in a bullish expansion (+37.87%), breaking out from consolidated range compression near $0.390 to hit a high of $0.42736. Price trades above key moving averages MA(7) ($0.40680) and MA(25) ($0.39344) with healthy buying volume (52.73% Bids). A pullback into the MA(7) dynamic demand zone offers an institutional long entry before sweeping trapped shorts resting above $0.42736.
🎯 Trade Setup
Direction: LONG
Entry Zone $0.4050 – $0.4150
Take Profit 1 $0.4273
Take Profit 2 $0.4450
Take Profit 3 $0.4700
Stop Loss $0.3900
Risk : Reward 1.6
Trade Type Scalp
#MAGMASHORT
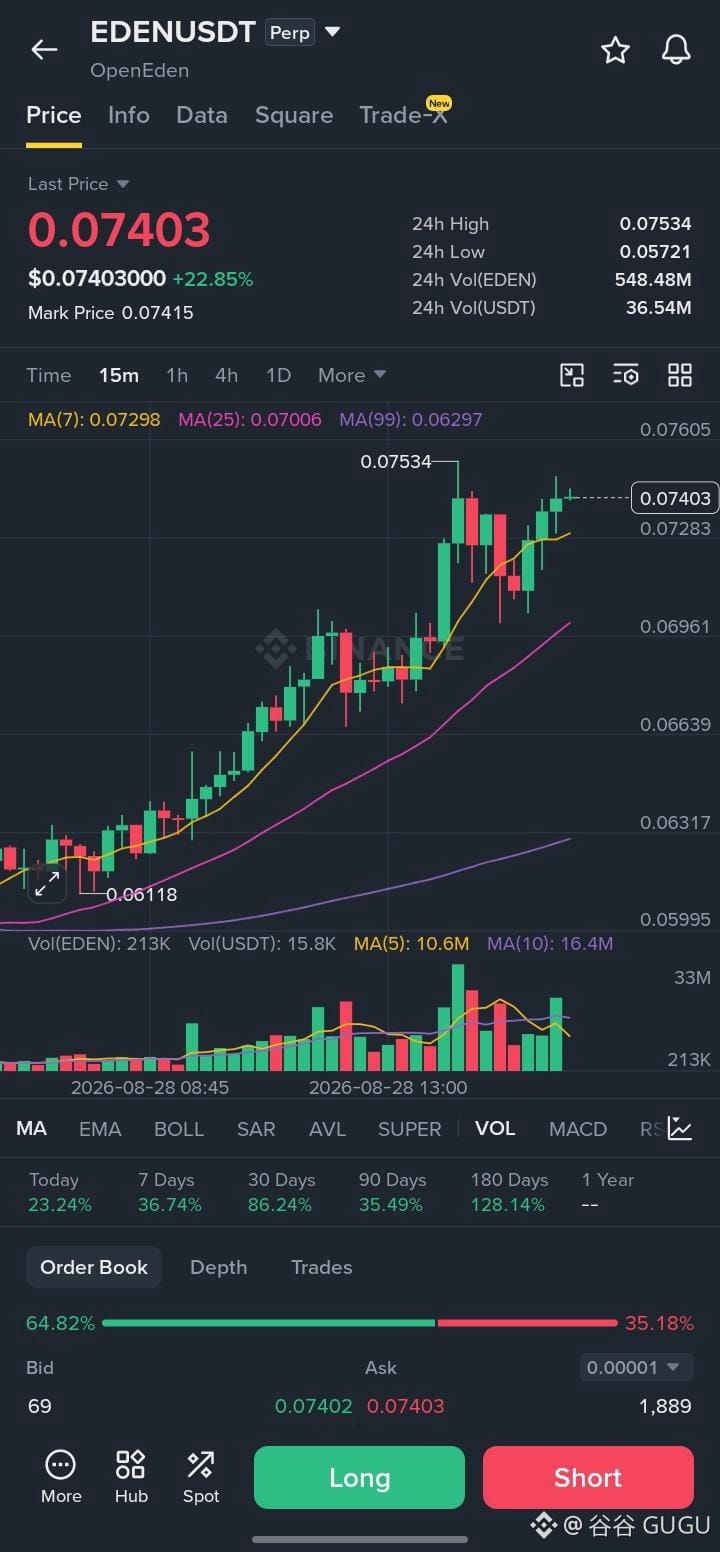
$EDEN
USDT Perp is showing a strong bullish expansion (+22.85%) following a higher-low pull back down toward $0.069. Buyers are defending MA(7) ($0.07298) and MA(25) ($0.07006), pushing price back up to retest the local high liquidity magnet at $0.07534. With buyer order book dominance (64.82%) and alignment above moving averages, momentum favors sweeping trapped shorts resting above resistance.
🎯 Trade Setup
Direction: LONG
Entry Zone $0.07150 – $0.07350
Take Profit 1 $0.07530
Take Profit 2 $0.07900
Take Profit 3 $0.08300
Stop Loss $0.06900
Risk : Reward 1.5
Trade Type Scalp
#Eden
USDT Perp is showing a strong bullish expansion (+22.85%) following a higher-low pull back down toward $0.069. Buyers are defending MA(7) ($0.07298) and MA(25) ($0.07006), pushing price back up to retest the local high liquidity magnet at $0.07534. With buyer order book dominance (64.82%) and alignment above moving averages, momentum favors sweeping trapped shorts resting above resistance.
🎯 Trade Setup
Direction: LONG
Entry Zone $0.07150 – $0.07350
Take Profit 1 $0.07530
Take Profit 2 $0.07900
Take Profit 3 $0.08300
Stop Loss $0.06900
Risk : Reward 1.5
Trade Type Scalp
#Eden
$LIGHT
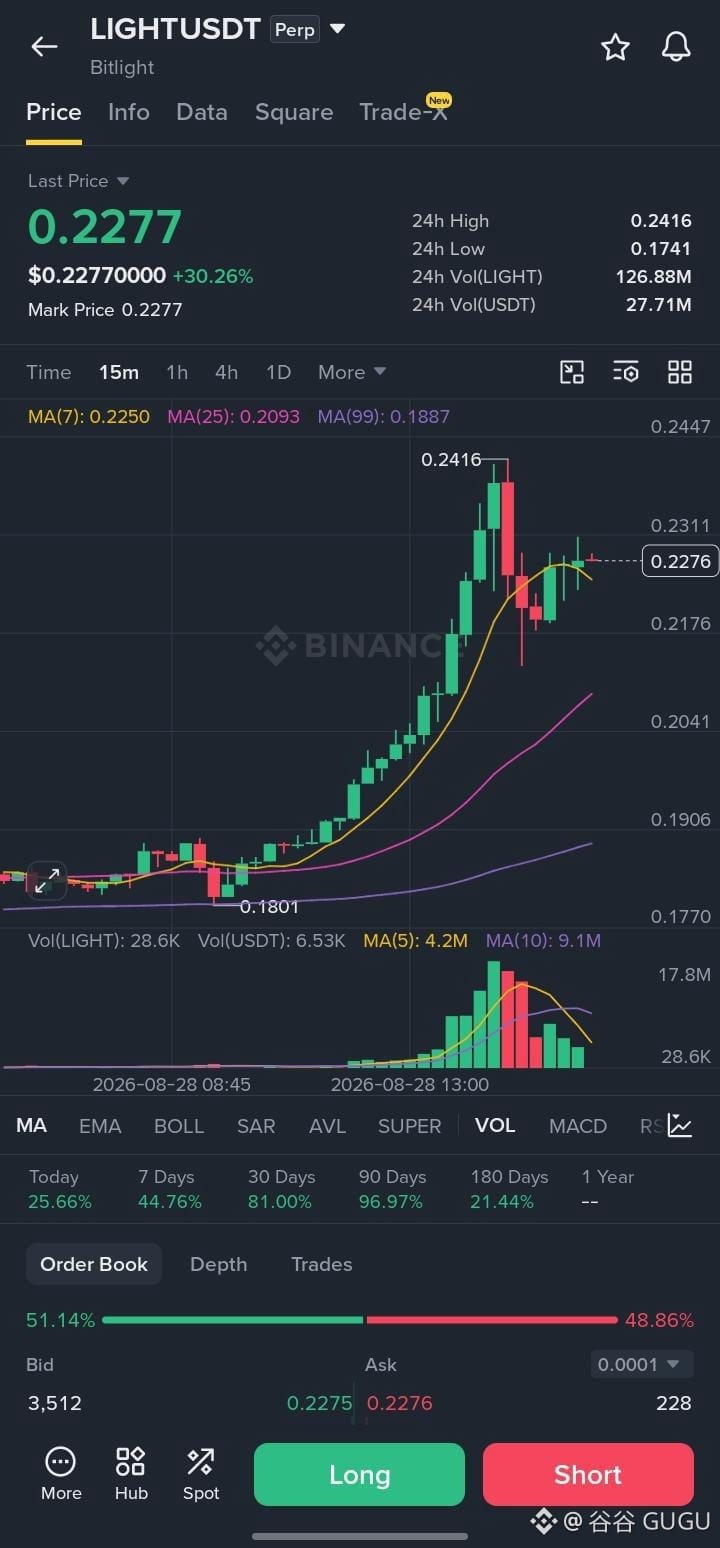
USDT Perp has printed a strong expansion off $0.1801 up to $0.2416 (+30.26%), followed by a sharp profit-taking pull and higher-low stabilization around $0.2176. Buyers are asserting control above MA(7) ($0.2250) and MA(25) ($0.2093). Liquidity rests above the $0.2416 high where trapped shorts sit, while long liquidity pools below $0.217. Acceptance above $0.230 confirms a momentum retest toward local high sweeps.
🎯 Trade Setup
Direction: LONG
Entry Zone $0.2180 – $0.2250
Take Profit 1 $0.2415
Take Profit 2 $0.2580
Take Profit 3 $0.2750
Stop Loss $0.2060
Risk : Reward 1.5
Trade Type Scalp
#light
USDT Perp has printed a strong expansion off $0.1801 up to $0.2416 (+30.26%), followed by a sharp profit-taking pull and higher-low stabilization around $0.2176. Buyers are asserting control above MA(7) ($0.2250) and MA(25) ($0.2093). Liquidity rests above the $0.2416 high where trapped shorts sit, while long liquidity pools below $0.217. Acceptance above $0.230 confirms a momentum retest toward local high sweeps.
🎯 Trade Setup
Direction: LONG
Entry Zone $0.2180 – $0.2250
Take Profit 1 $0.2415
Take Profit 2 $0.2580
Take Profit 3 $0.2750
Stop Loss $0.2060
Risk : Reward 1.5
Trade Type Scalp
#light
$龙虾
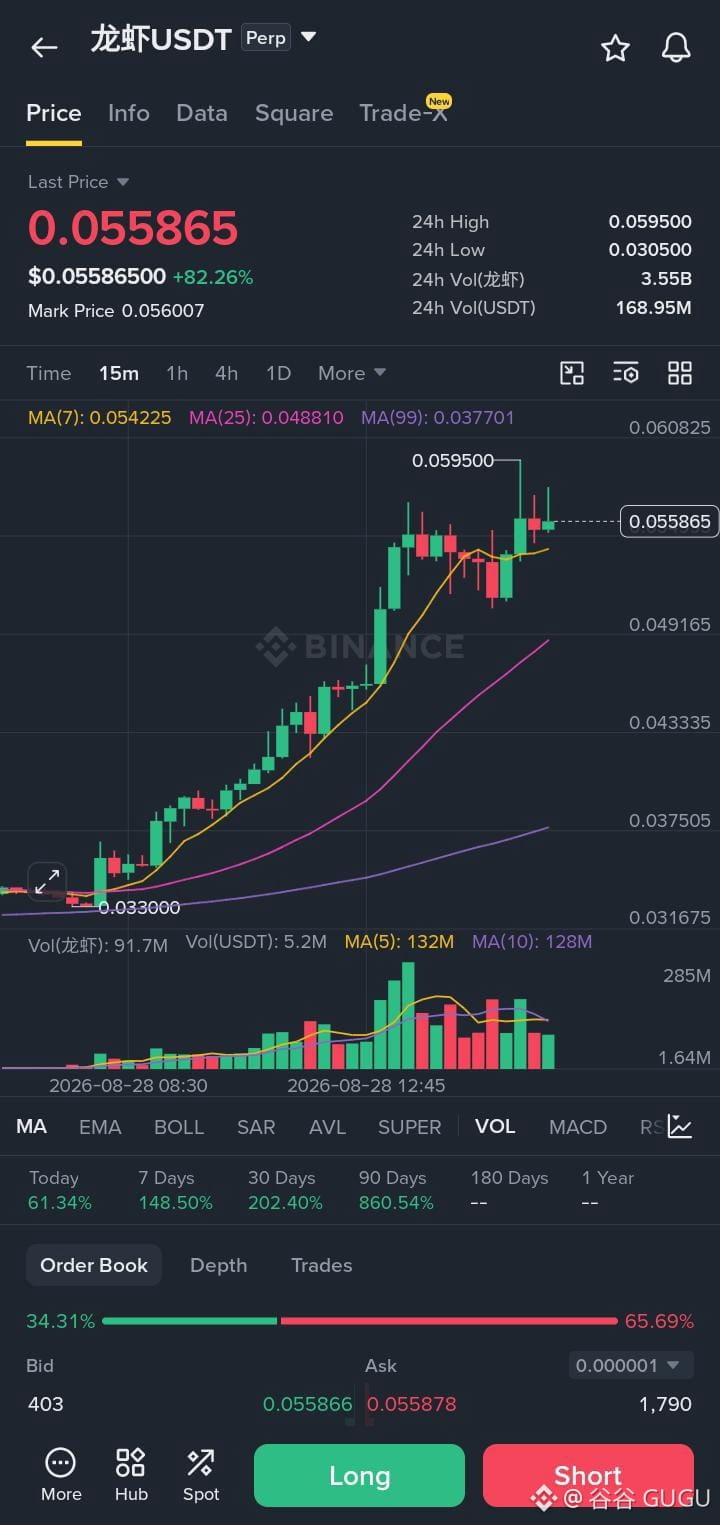
(LOBSTER USDT Perp) is currently in a strong short-term bullish expansion (+82.26%), making higher highs and holding firmly above key moving averages (MA7/MA25). Liquidity resides above the recent local high at $0.059500, with clear seller absorption near $0.0558. Buyers remain in relative control despite high volatility, making a dip retest into local EMA/MA support a high-probability continuation zone before sweeping higher perpetual short liquidations.
🎯 Trade Setup
Direction: LONG
Entry Zone $0.05150 – $0.05350
Take Profit 1 $0.05950
Take Profit 2 $0.06400
Take Profit 3 $0.07000
Stop Loss $0.04850
Risk : Reward 1.2
Trade Type Scalp
#龙虾炒币
(LOBSTER USDT Perp) is currently in a strong short-term bullish expansion (+82.26%), making higher highs and holding firmly above key moving averages (MA7/MA25). Liquidity resides above the recent local high at $0.059500, with clear seller absorption near $0.0558. Buyers remain in relative control despite high volatility, making a dip retest into local EMA/MA support a high-probability continuation zone before sweeping higher perpetual short liquidations.
🎯 Trade Setup
Direction: LONG
Entry Zone $0.05150 – $0.05350
Take Profit 1 $0.05950
Take Profit 2 $0.06400
Take Profit 3 $0.07000
Stop Loss $0.04850
Risk : Reward 1.2
Trade Type Scalp
#龙虾炒币
#BitcoinRises23.6%Weekly
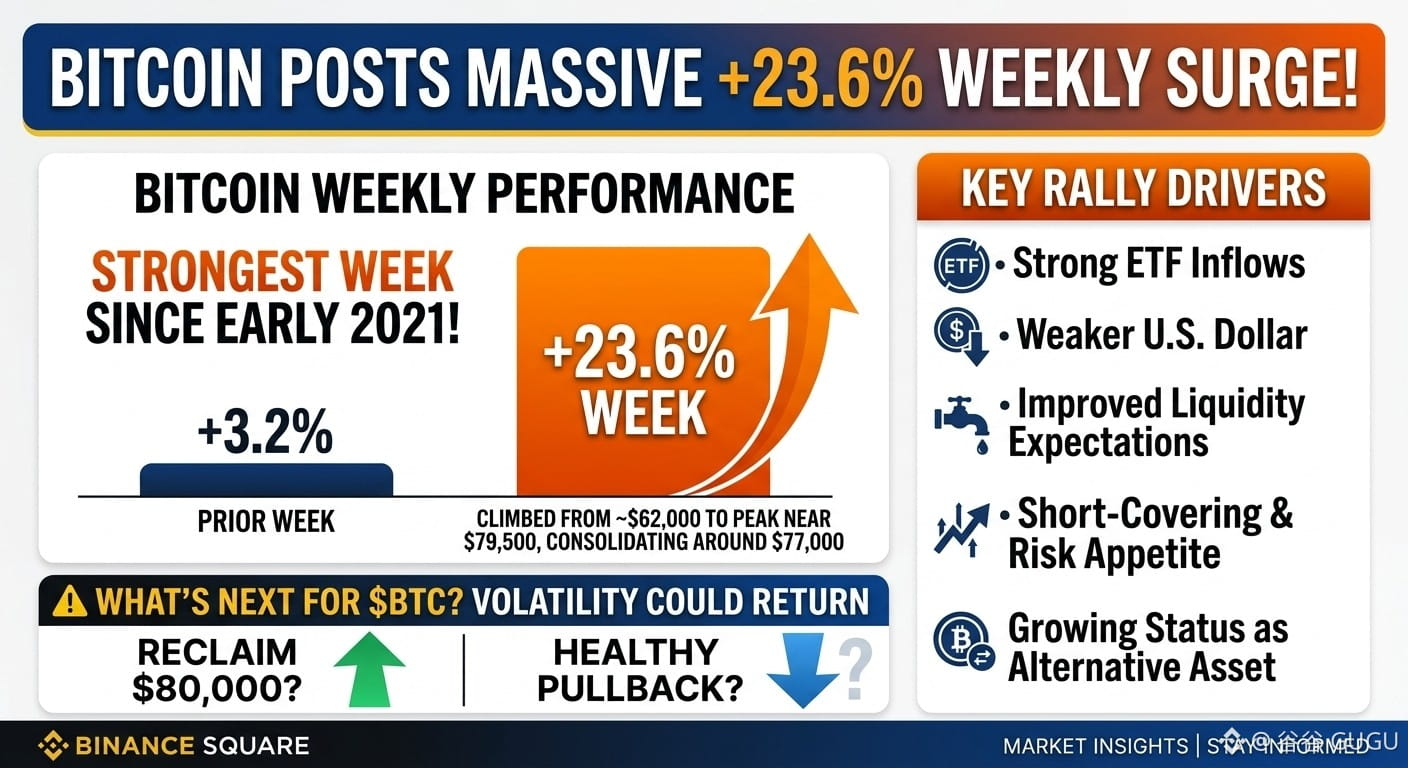
🚨 BITCOIN JUST POSTED A MASSIVE 23.6% WEEKLY SURGE!
BTC delivered one of its strongest weekly performances in years, climbing from around $62,000 to a peak near $79,500 before consolidating around the $77K area.
📈 What helped fuel the rally?
• Strong crypto ETF inflows
• A weaker U.S. dollar
• Improved liquidity expectations
• Short-covering and renewed risk appetite
• Growing attention toward Bitcoin as an alternative asset
This wasn't just a small bounce. According to recent market reports, Bitcoin's 23.6% weekly gain ranked among its strongest weeks since early 2021.
But here's the important part 👇
⚠️ A strong rally doesn't guarantee a straight line upward. After such a sharp move, volatility and profit-taking can return quickly.
The key question now:
Can BTC hold its momentum above the $77K region, or will the market take a breather after one of its biggest weekly moves in years?
👀 Bullish momentum is back, but the next move will depend on whether demand remains strong.
What do you think?
BTC to reclaim $80K next, or a healthy pullback first? 🔥
$PROM $ETH $BTC
🚨 BITCOIN JUST POSTED A MASSIVE 23.6% WEEKLY SURGE!
BTC delivered one of its strongest weekly performances in years, climbing from around $62,000 to a peak near $79,500 before consolidating around the $77K area.
📈 What helped fuel the rally?
• Strong crypto ETF inflows
• A weaker U.S. dollar
• Improved liquidity expectations
• Short-covering and renewed risk appetite
• Growing attention toward Bitcoin as an alternative asset
This wasn't just a small bounce. According to recent market reports, Bitcoin's 23.6% weekly gain ranked among its strongest weeks since early 2021.
But here's the important part 👇
⚠️ A strong rally doesn't guarantee a straight line upward. After such a sharp move, volatility and profit-taking can return quickly.
The key question now:
Can BTC hold its momentum above the $77K region, or will the market take a breather after one of its biggest weekly moves in years?
👀 Bullish momentum is back, but the next move will depend on whether demand remains strong.
What do you think?
BTC to reclaim $80K next, or a healthy pullback first? 🔥
$PROM $ETH $BTC
#USTreasuryDoublesBuybackCapTo$4B
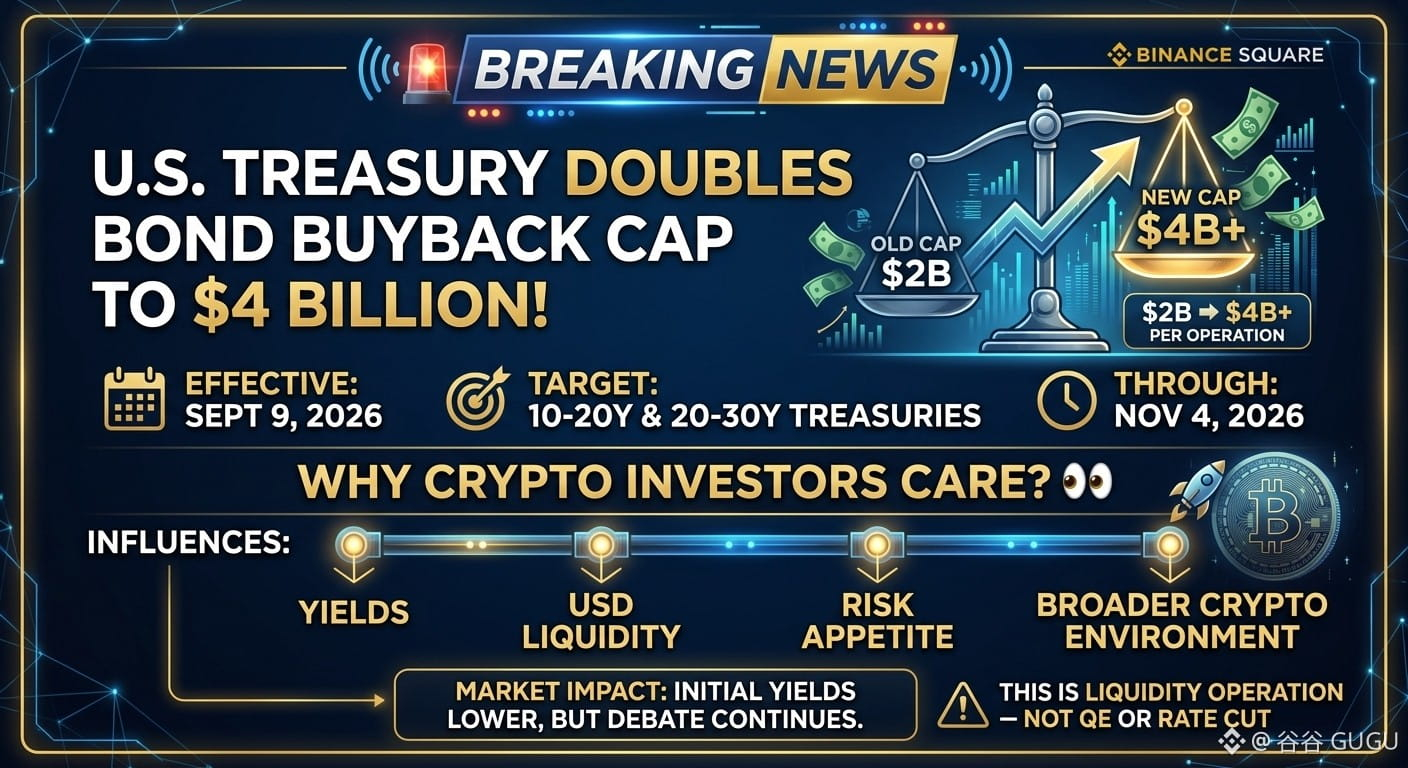
🚨 BREAKING: U.S. Treasury Doubles Long-Term Bond Buyback Cap to $4 BILLION
The U.S. Treasury has announced that it will at least double the size of its liquidity-support buyback operations for longer-dated bonds.
📈 Buyback cap: $2B ➜ at least $4B per operation
📅 Effective: September 9, 2026
🎯 Target: 10–20 year and 20–30 year Treasury securities
⏳ Current period: Through November 4, 2026
The official goal is to provide greater liquidity support to the long end of the Treasury market. This is important because long-term yields had recently surged, putting pressure on government borrowing costs and broader financial markets.
Why should crypto investors care? 👀
A major move in the U.S. bond market can influence:
🔹 Treasury yields
🔹 U.S. dollar liquidity
🔹 Risk appetite
🔹 Gold and equity markets
🔹 Ultimately, the broader environment in which #Bitcoin and #crypto trade
After the announcement, long-term yields initially moved lower, although analysts remain divided on whether buybacks alone can solve deeper concerns around U.S. debt and fiscal pressures.
⚠️ Important: This is a Treasury market-liquidity operation—not a direct Federal Reserve rate cut or a new QE program.
The bigger question now:
If long-term yields remain under pressure, could the Treasury increase support even further?
👀 Watch the bond market closely. Macro moves often reach crypto sooner or later.
Bullish or bearish for $BTC and crypto? Drop your view below. 👇
$ZEC $BTC
🚨 BREAKING: U.S. Treasury Doubles Long-Term Bond Buyback Cap to $4 BILLION
The U.S. Treasury has announced that it will at least double the size of its liquidity-support buyback operations for longer-dated bonds.
📈 Buyback cap: $2B ➜ at least $4B per operation
📅 Effective: September 9, 2026
🎯 Target: 10–20 year and 20–30 year Treasury securities
⏳ Current period: Through November 4, 2026
The official goal is to provide greater liquidity support to the long end of the Treasury market. This is important because long-term yields had recently surged, putting pressure on government borrowing costs and broader financial markets.
Why should crypto investors care? 👀
A major move in the U.S. bond market can influence:
🔹 Treasury yields
🔹 U.S. dollar liquidity
🔹 Risk appetite
🔹 Gold and equity markets
🔹 Ultimately, the broader environment in which #Bitcoin and #crypto trade
After the announcement, long-term yields initially moved lower, although analysts remain divided on whether buybacks alone can solve deeper concerns around U.S. debt and fiscal pressures.
⚠️ Important: This is a Treasury market-liquidity operation—not a direct Federal Reserve rate cut or a new QE program.
The bigger question now:
If long-term yields remain under pressure, could the Treasury increase support even further?
👀 Watch the bond market closely. Macro moves often reach crypto sooner or later.
Bullish or bearish for $BTC and crypto? Drop your view below. 👇
$ZEC $BTC
Войдите, чтобы посмотреть больше материала