
### Análisis del Activo PEPE
#### Español
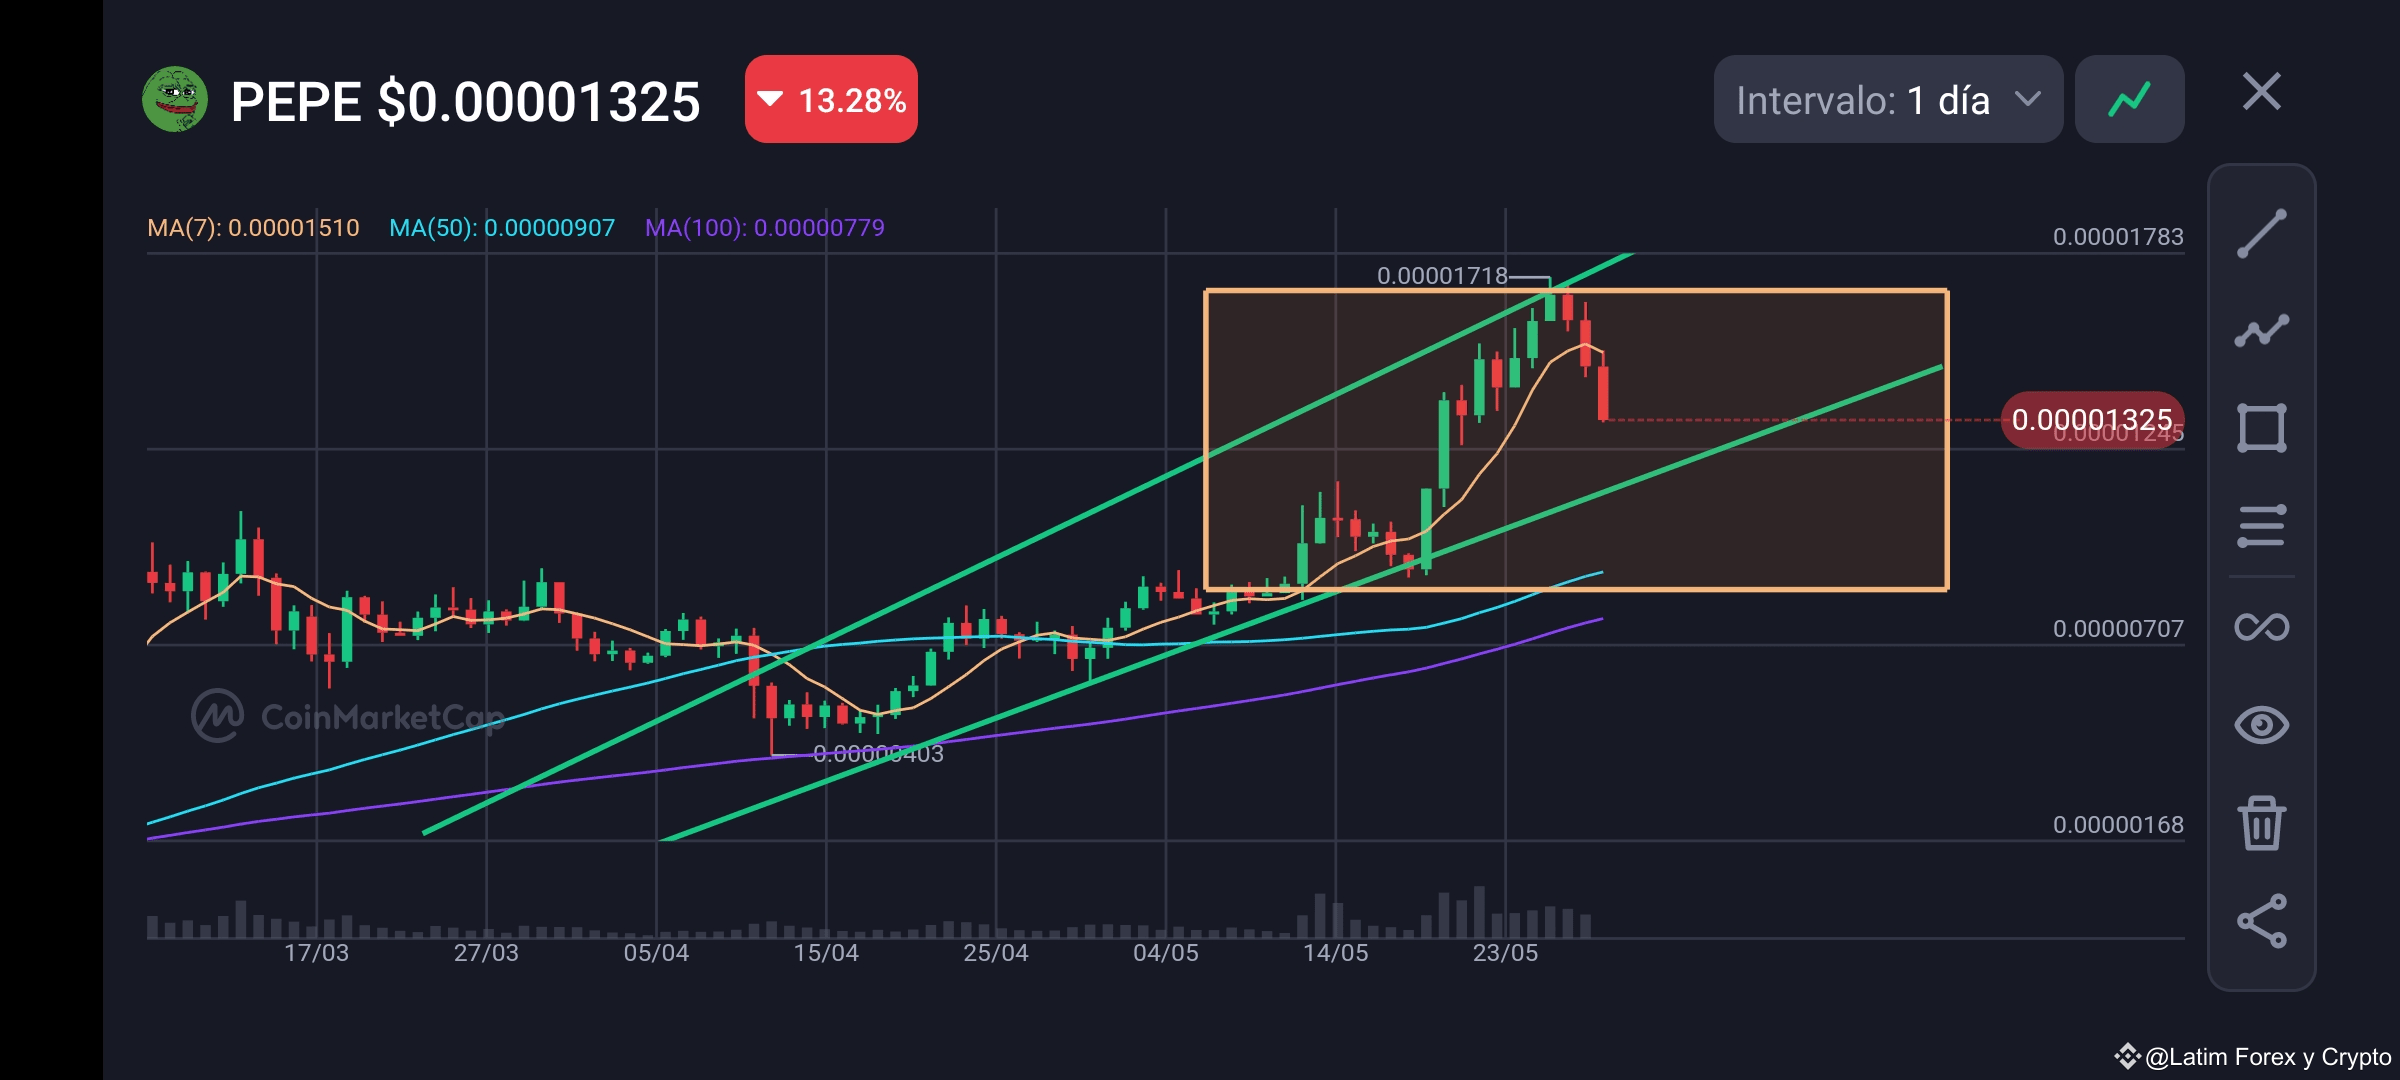
En el gráfico más reciente del activo PEPE, vemos que el precio actual es de $0.00001325, con una caída significativa del 13.28%. Ayer, predijimos una posible corrección en el rango del rectángulo naranja que oscila entre $0.00001209 y $0.00001718. Actualmente, el precio se encuentra en la parte inferior de este rango, lo que indica que la corrección está en curso.
El gráfico muestra que la media móvil de 7 días (MA7) es de $0.00001510, la de 50 días (MA50) es de $0.00000907, y la de 100 días (MA100) es de $0.00000779. Estas medias móviles indican una tendencia alcista en el mediano y largo plazo, aunque el precio actual está por debajo de la MA7, lo que confirma la corrección a corto plazo.
Además, la gráfica de 30 días muestra un incremento del 90.61% y un aumento del 322% en los últimos 90 días, reflejando una fuerte tendencia alcista en el largo plazo. Sin embargo, la caída reciente podría ser una consolidación o una corrección antes de un nuevo impulso alcista.
En resumen, aunque hay una corrección en curso, las tendencias a mediano y largo plazo siguen siendo positivas. Es crucial monitorear el soporte en $0.00001209 para evaluar si el precio puede mantenerse o si se dirige a una corrección más profunda.
---
### Analysis of PEPE Asset
#### English
In the most recent chart of the PEPE asset, the current price is $0.00001325, with a significant drop of 13.28%. Yesterday, we predicted a possible correction within the range of the orange rectangle, fluctuating between $0.00001209 and $0.00001718. Currently, the price is at the lower end of this range, indicating that the correction is ongoing.
The chart shows that the 7-day moving average (MA7) is $0.00001510, the 50-day moving average (MA50) is $0.00000907, and the 100-day moving average (MA100) is $0.00000779. These moving averages indicate an upward trend in the medium and long term, although the current price is below the MA7, confirming the short-term correction.
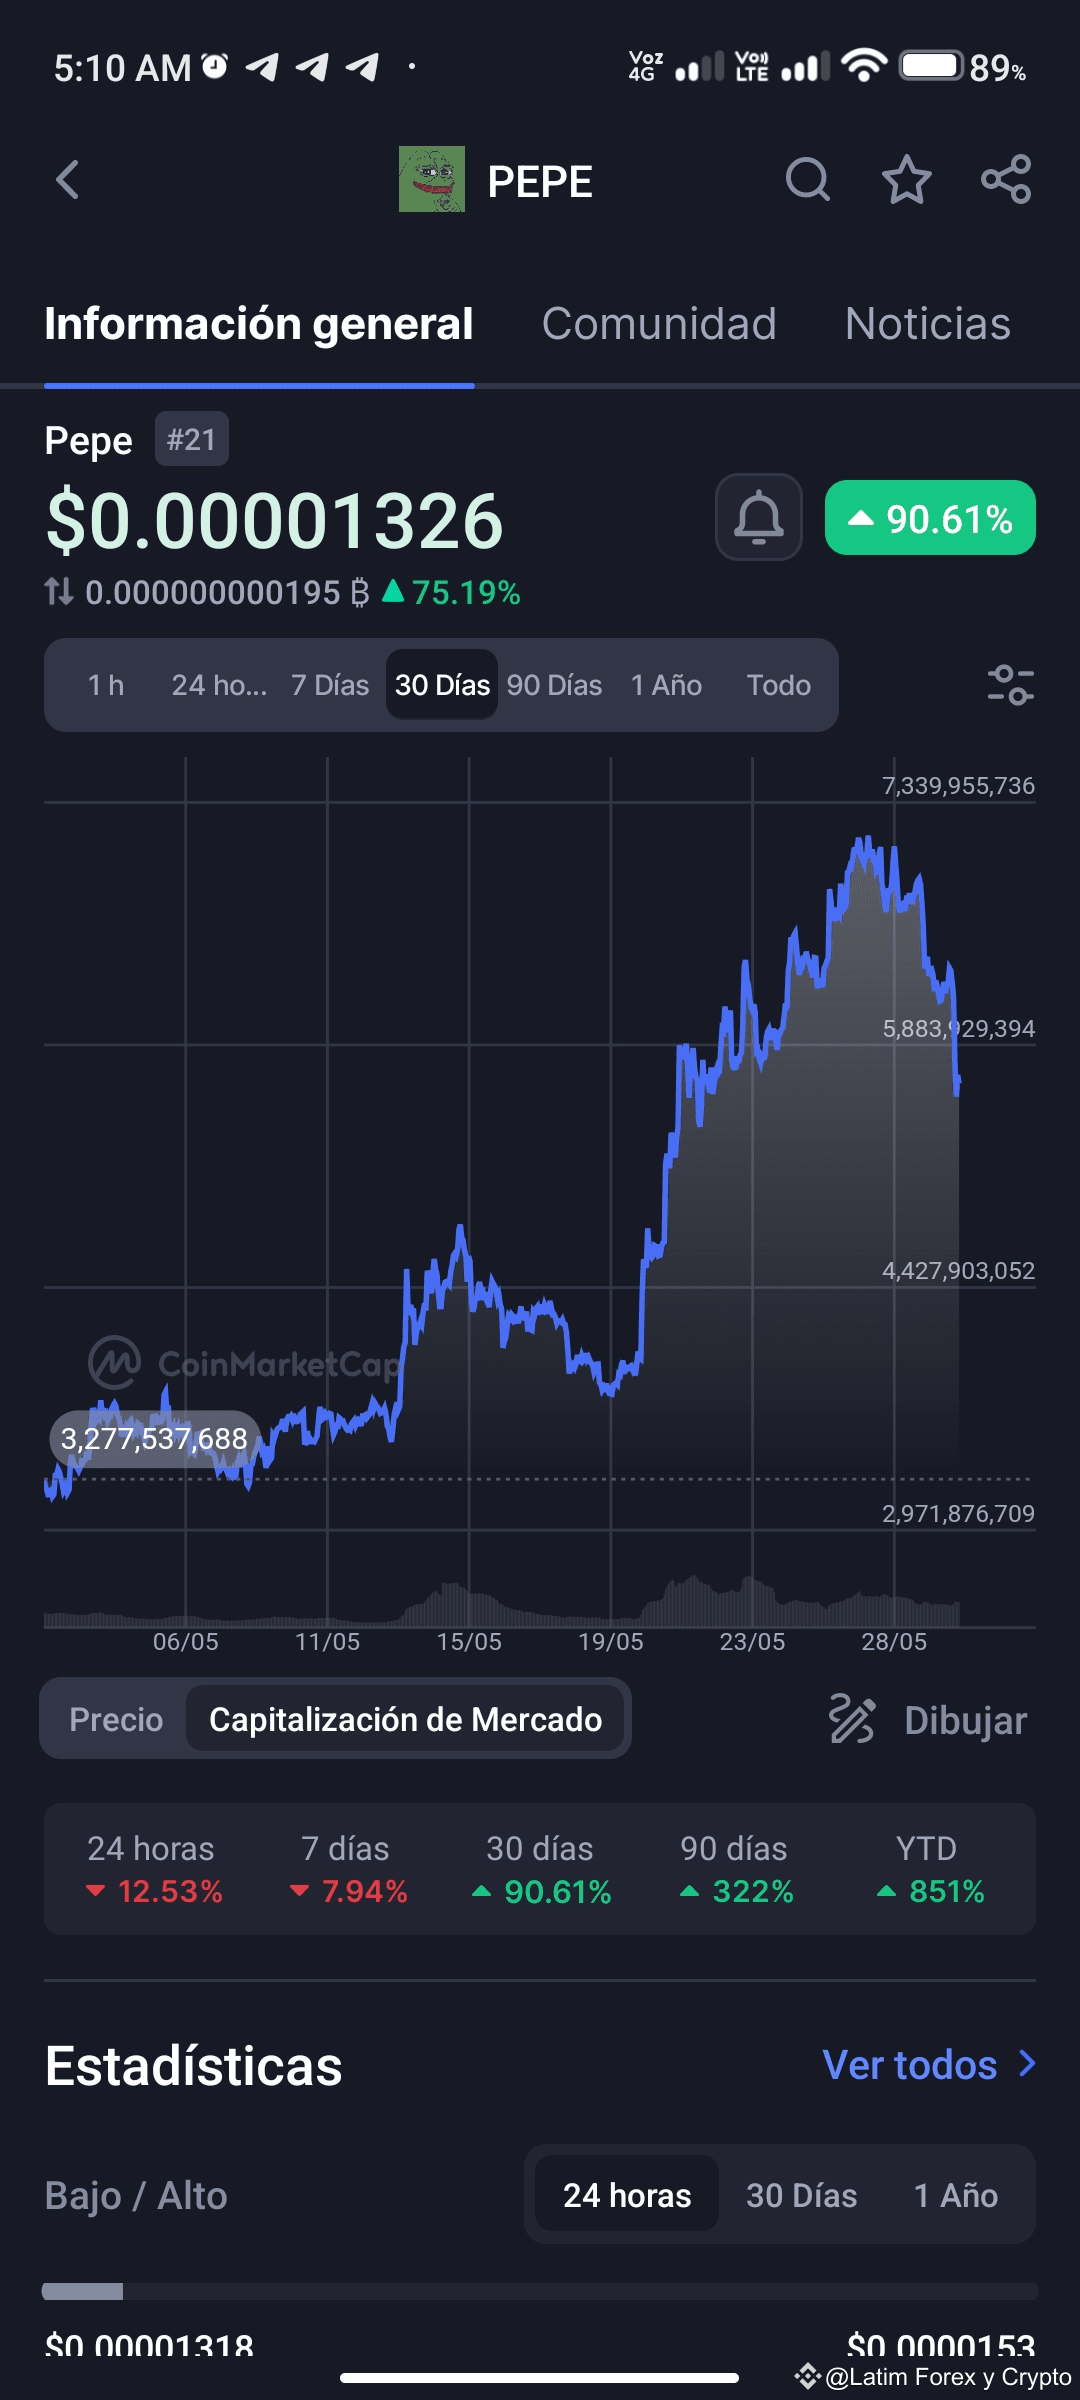
Additionally, the 30-day chart shows a 90.61% increase and a 322% rise in the last 90 days, reflecting a strong long-term uptrend. However, the recent drop might be a consolidation or a correction before a new upward momentum.
In summary, although there is an ongoing correction, the medium and long-term trends remain positive. It is crucial to monitor the support at $0.00001209 to evaluate if the price can hold or if it is heading for a deeper correction.