
### Bitcoin (BTC) Technical Analysis
#### Daily Timeframe (Latest Chart)
1. Support and Resistance:
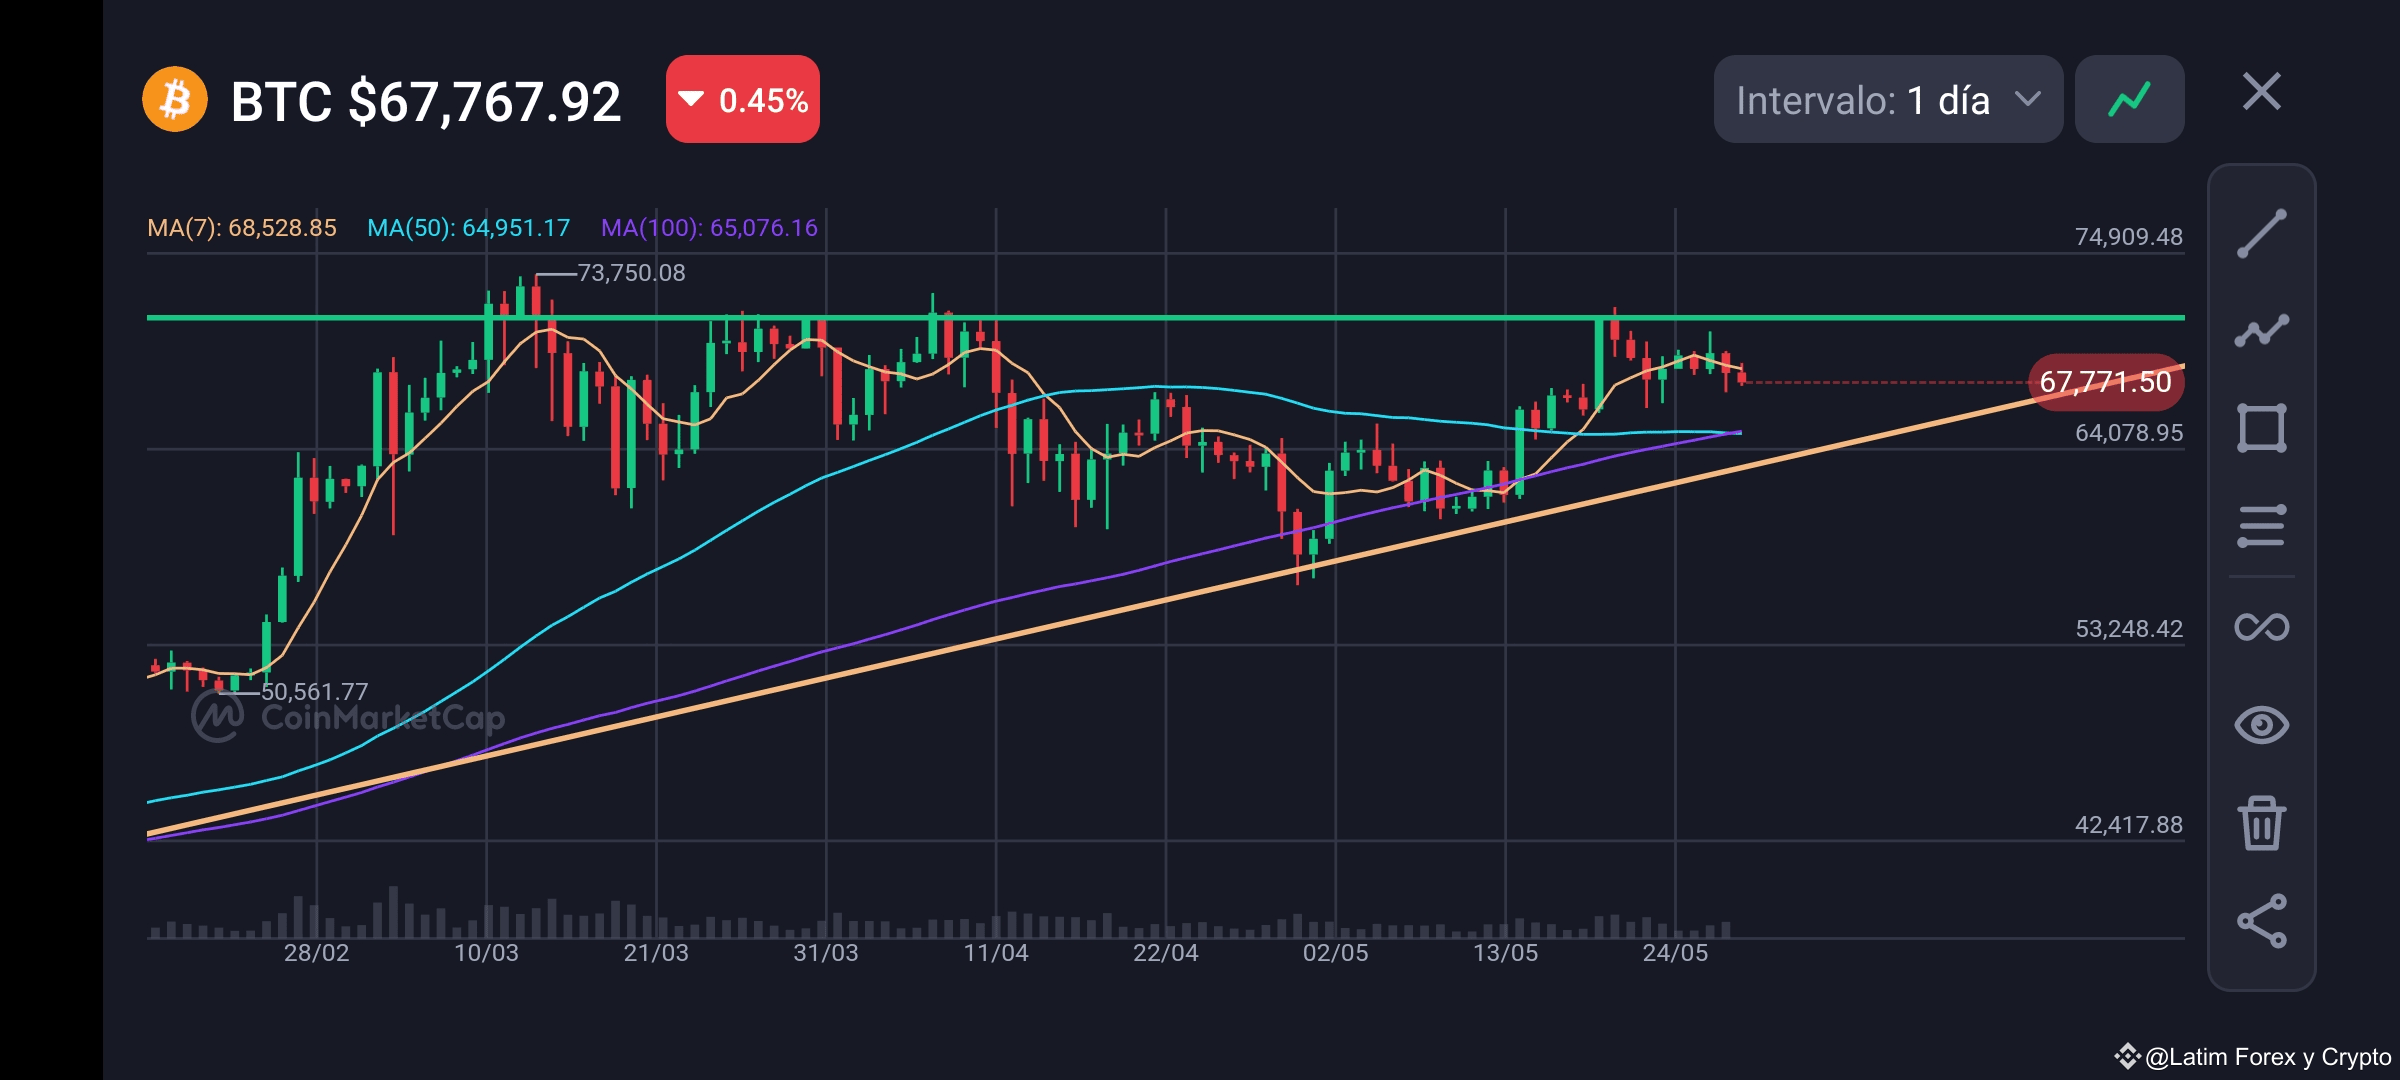
- Ascending Support: There is an ascending support line from early February with several recent touchpoints.
- Horizontal Resistance: The horizontal resistance at $73,750.08 remains a key level that Bitcoin has struggled to break through.
2. Moving Averages:
- MA(7): $68,528.85
- MA(50): $64,951.17
- MA(100): $65,076.16
- The current price of $67,767.92 is below the MA(7) and near the MA(50), indicating an ongoing correction.
3. Trend:
- The long-term uptrend is intact due to the ascending support, but short-term signs of correction are present.
- The drop below the MA(7) and nearing the MA(50) could signal a deeper correction if the ascending support is not held.
#### Correction Depth Analysis
1. Support Levels:
- The first critical support level is the ascending support line, currently around $64,078.95.
- A stronger support is found at $53,248.42, where previous consolidations occurred.
2. Correction Scenarios:
- Shallow Correction: If the price finds support at the MA(50) ($64,951.17) and the ascending support line, a minor correction to around $64,000-$65,000 could occur before resuming the uptrend.
- Moderate Correction: If the price breaks the ascending support, a drop to the next significant support at $53,248.42 is possible.
- Deep Correction: In a more bearish scenario, the drop could extend to the support at $42,417.88, although this would require a strong shift in market sentiment.
3. Technical Indicators:
- Volume: It is important to watch the selling volume. Increasing volume with a price drop would indicate a deeper correction.
- RSI (Relative Strength Index): A low RSI on the daily timeframe could indicate oversold conditions, suggesting a possible rebound.
### Conclusion
Bitcoin shows signs of short-term correction within a long-term uptrend. The depth of the correction will depend on the price's ability to maintain the ascending support and the MA(50). If these levels do not hold, the next key support is around $53,248.42. Monitoring the volume and other technical indicators is crucial to assess the strength of the correction and potential rebound points.