
Bitcoin price is declining below $28,000. BTC has the potential to break below the $25,000 support level in the short term.
Bitcoin struggles to recover above the resistance levels of $27,500 and $27,800.
Price is below $27,500 and the 100-hour simple moving average.
There are two bearish trend lines on the hourly chart of the BTC/USD pair with resistance near $27,000 and $27,800 (data from Kraken).
The pair could continue to decline if it breaks the $26,750 support area.
Bitcoin Price Continues Downtrend
Bitcoin price failed to initiate a recovery wave above $27,800. BTC remains in the bearish zone and closed below the $27,500 support area.
Bears were able to push the price below $27,000. Forming a low near $26,720, the price now shows many bearish signs. Its trading price remains below $27,500 and the 100-hour simple moving average. There are also two bearish trend lines on the hourly chart of the BTC/USD pair with resistance near $27,000 and $27,800.
Bitcoin's price may face sellers near $27,000 or the 23.6% Fibonacci retracement level of the recent decline from the $28,335 swing high to the $26,720 low.
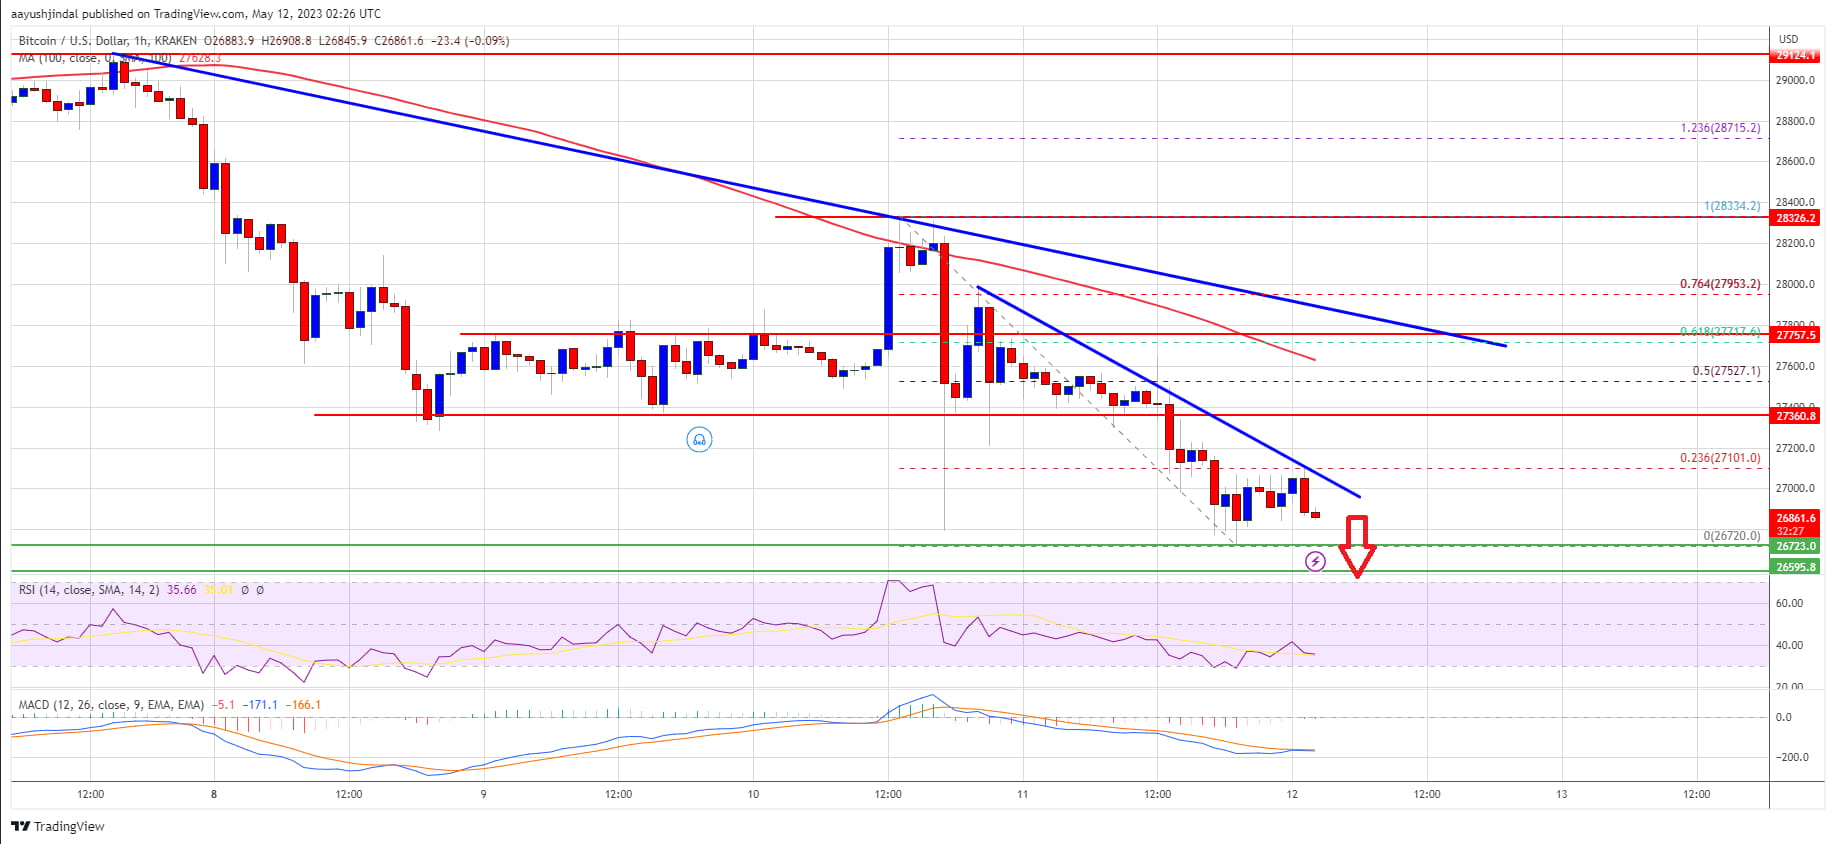
The next major resistance is near $27,350. The main resistance is now forming near the next trend line and $27,800. It is close to the 50% Fibonacci retracement level of the recent decline from the $28,335 swing high to the $26,720 low.
A close above the $27,800 resistance level and the 100-hour simple moving average could initiate a significant upward move. The next key resistance level is near $28,000, and above this price, it could climb to the $28,500 resistance level.
More BTC Losses?
If Bitcoin's price fails to break the $27,500 resistance level, it may continue to decline. The immediate support level on the downside is near $26,750.
The next major support level is near the $26,500 area, and below this zone, the price may gain bearish momentum. In this case, it could retest the $26,000 level. Any further losses could bring Bitcoin to the $25,000 level in the short term.
Technical indicators:
Hourly MACD - The MACD is now gaining pace in the bearish zone.
Hourly RSI (Relative Strength Index) - The RSI for BTC/USD is now below the 50 level.
Major Support Levels - $26,750, followed by $26,000.
Major Resistance Levels - $27,000, $27,350, and $27,800.