$BTC
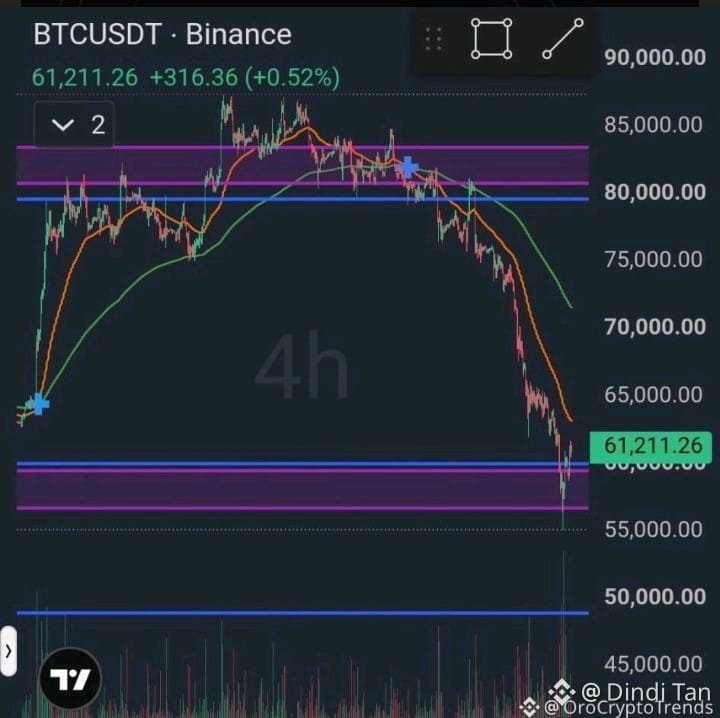
swept $55K, snapped back above $61K, and now has to prove it. 📈
Yesterday Bitcoin broke below $60K, wicked down to $55.1K and recovered within hours. According to Binance's BTC/USDT chart, BTC trades near $61,200 today, up about 2% on the 24h, with a 24h range of $58,768 to $61,670.
The part I like: yesterday's daily candle has a long lower wick, and it carries the biggest volume bar on my daily chart. That looks like forced selling getting absorbed. Today's dip only reached about $58.8K before buyers stepped in, so the low is higher than the wick. That's the first constructive sign in weeks.
The part I'm not ignoring: this is still a bounce inside a downtrend. On the daily, price sits well below both moving averages. On the 1H and 4H, the slower average is still falling, and on the 1H it sits around $63K. Only the 15M has price back above its averages. Volume has also cooled a lot, from about 59K BTC over the 24h window yesterday to about 20K now.
Levels I'm watching:
🟥 Above: $61.7K (today's high), $62K-$62.3K (old base), $64K
🟩 Below: $60K, $58.8K, $57K-$58K zone, then the $55.1K wick
What would change my mind:
A daily close above $62K, and better yet $64K with rising volume, says the sweep worked. A daily close back under $60K says the bounce failed and the $58K-$55K area is back in play.
I'm not calling a bottom. The chart just needs to confirm it.
⚠️ This is a chart read, not financial advice. Manage your risk and do your own research.
Do you see $55K as the low, or is there one more test coming? 👇
#BTC #Bitcoin #BTCUSDT #OroCryptoTrends
swept $55K, snapped back above $61K, and now has to prove it. 📈
Yesterday Bitcoin broke below $60K, wicked down to $55.1K and recovered within hours. According to Binance's BTC/USDT chart, BTC trades near $61,200 today, up about 2% on the 24h, with a 24h range of $58,768 to $61,670.
The part I like: yesterday's daily candle has a long lower wick, and it carries the biggest volume bar on my daily chart. That looks like forced selling getting absorbed. Today's dip only reached about $58.8K before buyers stepped in, so the low is higher than the wick. That's the first constructive sign in weeks.
The part I'm not ignoring: this is still a bounce inside a downtrend. On the daily, price sits well below both moving averages. On the 1H and 4H, the slower average is still falling, and on the 1H it sits around $63K. Only the 15M has price back above its averages. Volume has also cooled a lot, from about 59K BTC over the 24h window yesterday to about 20K now.
Levels I'm watching:
🟥 Above: $61.7K (today's high), $62K-$62.3K (old base), $64K
🟩 Below: $60K, $58.8K, $57K-$58K zone, then the $55.1K wick
What would change my mind:
A daily close above $62K, and better yet $64K with rising volume, says the sweep worked. A daily close back under $60K says the bounce failed and the $58K-$55K area is back in play.
I'm not calling a bottom. The chart just needs to confirm it.
⚠️ This is a chart read, not financial advice. Manage your risk and do your own research.
Do you see $55K as the low, or is there one more test coming? 👇
#BTC #Bitcoin #BTCUSDT #OroCryptoTrends