Bitcoin Price Analysis!!!
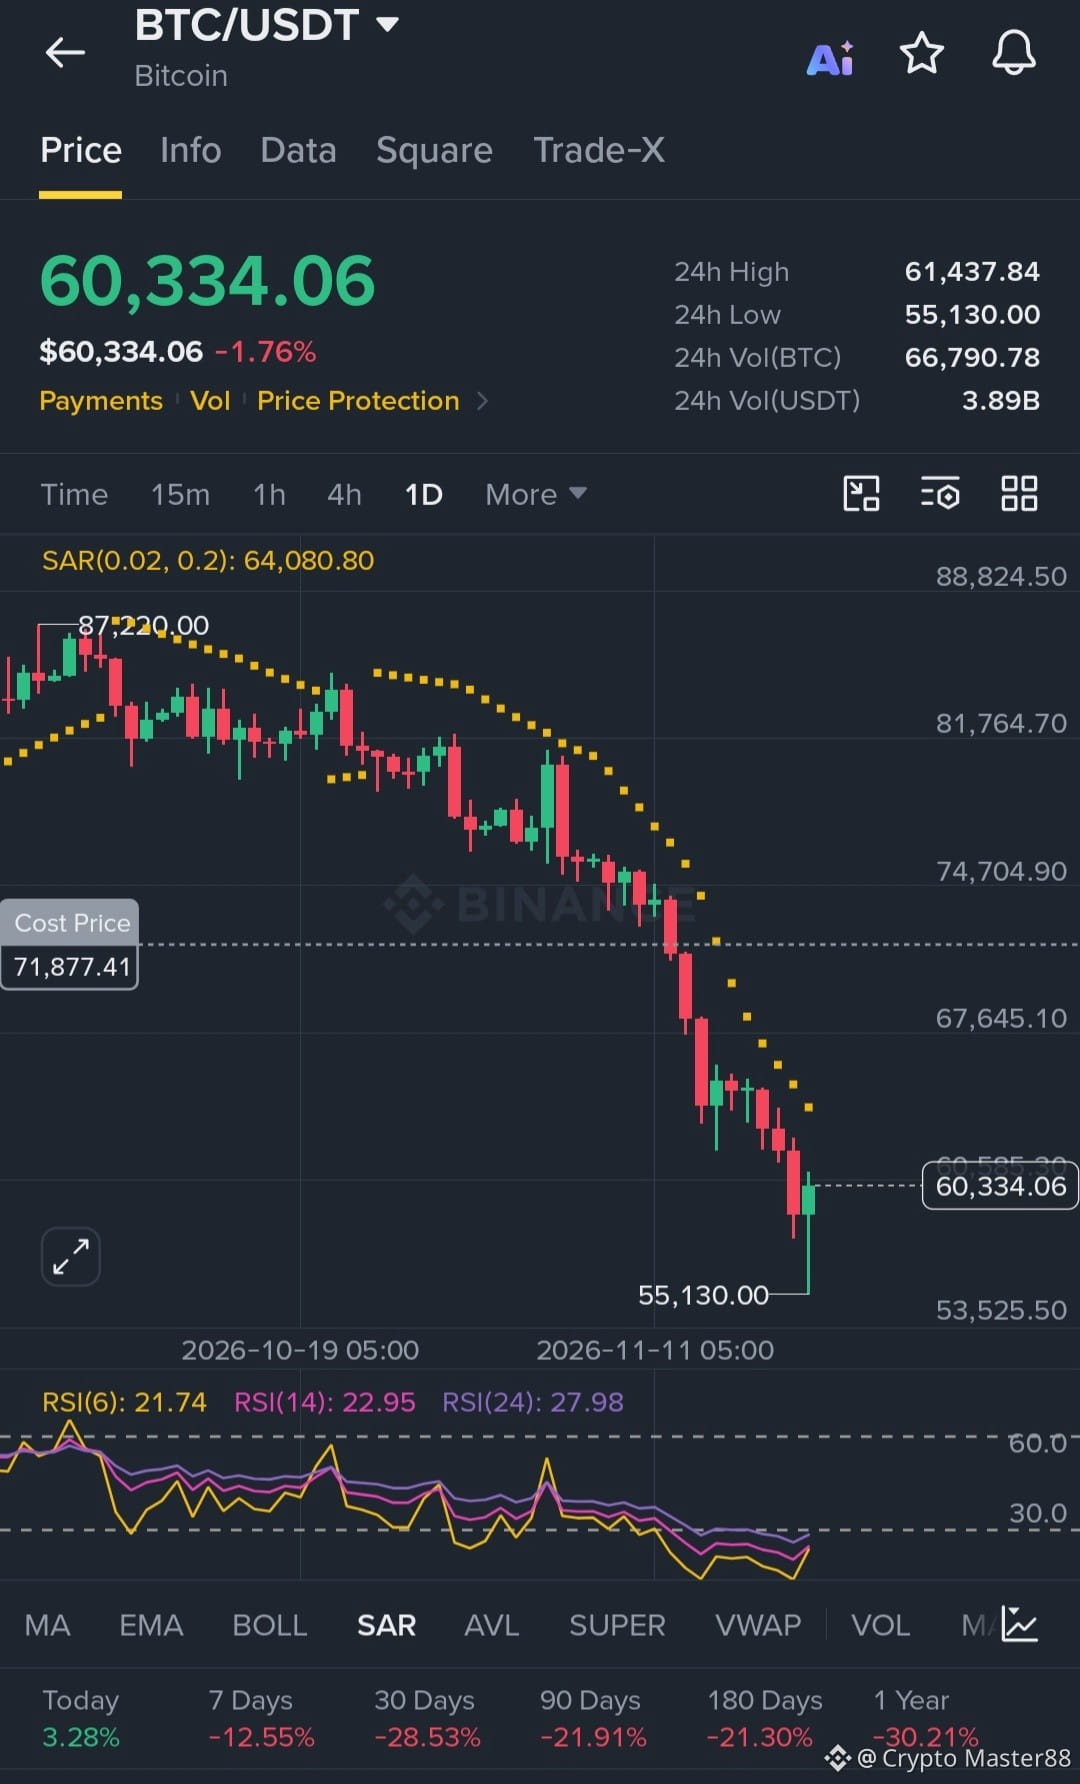
Bitcoin has just experienced a brutal flash crash, nosediving to a low of 55,130 before bouncing back to 60,334. The daily chart shows extreme panic, but also a massive opportunity. The RSI(6) has plummeted to 21.74, and RSI(14) is at 22.95, which is deep in the oversold zone. The Parabolic SAR is still high above at 64,080, confirming the heavy downtrend. However, the long lower wick at 55,130 shows that buyers are aggressively stepping in. Historically, when RSI drops this low and a long wick forms, a violent short squeeze bounce is usually right around the corner.
Here is the critical news driving this chaos. The entire market is in extreme fear, with the Fear and Greed Index at just 12. US spot Bitcoin ETFs have seen massive outflows, with over 3.47 billion withdrawn in November alone, and BlackRock's IBIT recording its largest single-day outflow of 541 million. On top of that, the Fed's hawkish stance on rate hikes is adding pressure. However, the sharp drop triggered a massive liquidation cascade of nearly 700 million, which often marks a local bottom as leveraged positions are flushed out.
Here is your exact trading plan for this volatile setup:
🟢 BUY ZONE: Wait for a retest of the 58,000 to 59,000 support area. If a strong green rejection candle forms on the 15-minute chart, go long with targets at 63,000 and 65,000. Keep a tight stop-loss below 56,500.
🔴 SELL ZONE: If BTC pumps up to the 63,500 to 64,000 resistance zone and gets rejected with a red candle, you can short with targets at 61,000 and 59,000. Stop-loss should be above 65,500.
The market is in extreme panic mode, so never use high leverage and always protect your capital first! 🛡️
#BTC #Signal🚥. #signaladvisor $BTC
Bitcoin has just experienced a brutal flash crash, nosediving to a low of 55,130 before bouncing back to 60,334. The daily chart shows extreme panic, but also a massive opportunity. The RSI(6) has plummeted to 21.74, and RSI(14) is at 22.95, which is deep in the oversold zone. The Parabolic SAR is still high above at 64,080, confirming the heavy downtrend. However, the long lower wick at 55,130 shows that buyers are aggressively stepping in. Historically, when RSI drops this low and a long wick forms, a violent short squeeze bounce is usually right around the corner.
Here is the critical news driving this chaos. The entire market is in extreme fear, with the Fear and Greed Index at just 12. US spot Bitcoin ETFs have seen massive outflows, with over 3.47 billion withdrawn in November alone, and BlackRock's IBIT recording its largest single-day outflow of 541 million. On top of that, the Fed's hawkish stance on rate hikes is adding pressure. However, the sharp drop triggered a massive liquidation cascade of nearly 700 million, which often marks a local bottom as leveraged positions are flushed out.
Here is your exact trading plan for this volatile setup:
🟢 BUY ZONE: Wait for a retest of the 58,000 to 59,000 support area. If a strong green rejection candle forms on the 15-minute chart, go long with targets at 63,000 and 65,000. Keep a tight stop-loss below 56,500.
🔴 SELL ZONE: If BTC pumps up to the 63,500 to 64,000 resistance zone and gets rejected with a red candle, you can short with targets at 61,000 and 59,000. Stop-loss should be above 65,500.
The market is in extreme panic mode, so never use high leverage and always protect your capital first! 🛡️
#BTC #Signal🚥. #signaladvisor $BTC