BTC technical analysis
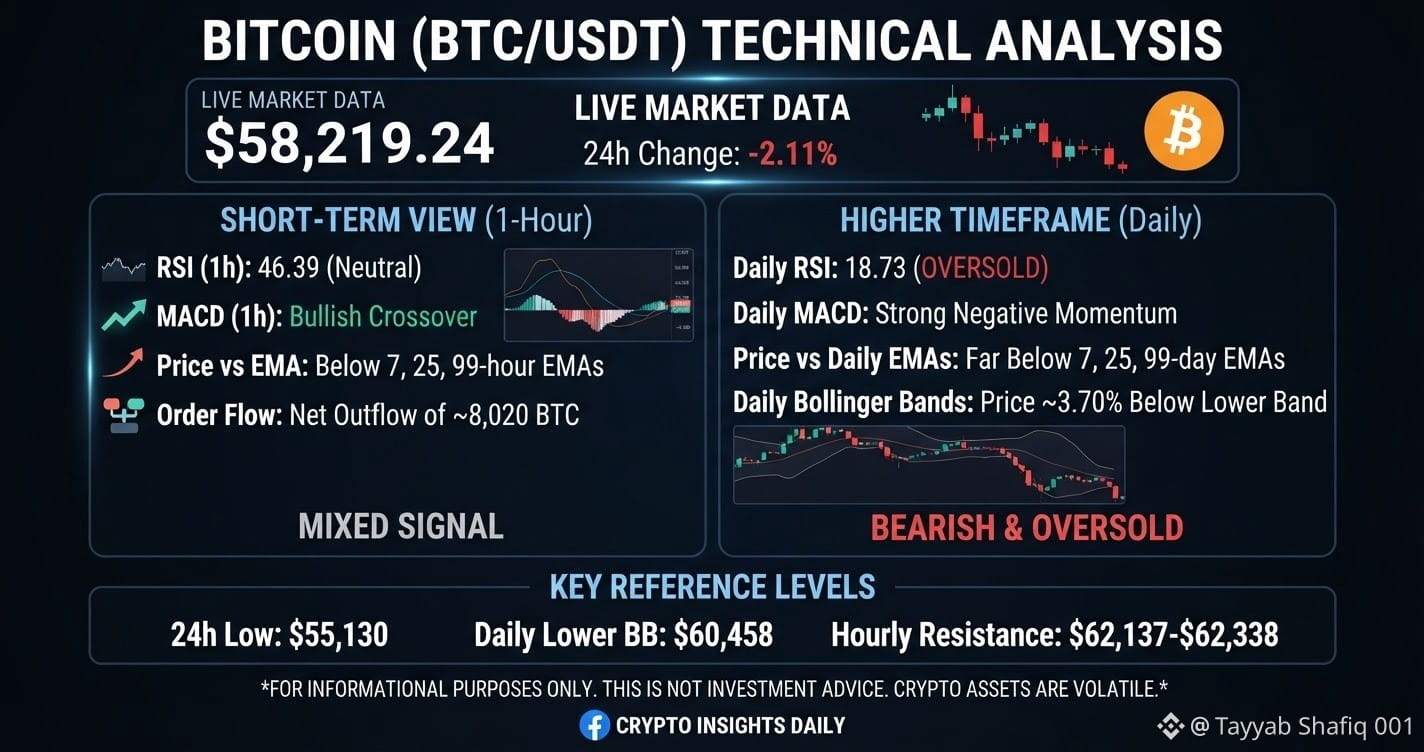
Live BTC/USDT data:
Price: $58,219.24
Change: −2.11% over 24h, −15.50% over 7d, −31.13% over 30d
24h range: $55,130–$62,341.94
Short-term view — 1-hour indicators
RSI: 46.39, close to neutral.
MACD: bullish crossover, with MACD DIF at 25.81.
However, price remains below the 7-hour EMA at $61,903.25, 25-hour EMA at $62,338.32, and 99-hour EMA at $63,844.44.
Large-order flow over the last day was a net outflow of approximately 8,020.66 BTC, showing continued selling pressure.
This is a mixed short-term signal: momentum has improved from extremely weak levels, but price remains below key hourly averages.
Higher-timeframe view — daily indicators
Daily RSI: 18.73, deeply oversold.
Daily MACD DIF: −1,006.58, consistent with strong negative momentum.
Price is below the daily EMAs:
7-day EMA: $65,229.29
25-day EMA: $71,886.08
99-day EMA: $75,820.89
The daily lower Bollinger Band is $60,458.17, placing the current price about 3.70% below it.
The daily structure remains bearish, although the very low RSI indicates that selling has already become unusually intense. Oversold conditions can persist and do not, by themselves, confirm a reversal.
Relevant observed reference levels
These are current market references, not price targets or trading instructions:
$55,130: recent 24h low
$60,458: daily lower Bollinger Band
$62,137–$62,338: 1-hour Bollinger midpoint and 25-hour EMA
$72,035: daily Bollinger midpoint
Future outlook
Short-term price movements cannot be reliably predicted, and I can’t provide personalized investment or trading advice. The available evidence shows:
Bearish evidence: negative 7-day and 30-day performance, price below daily moving averages, negative daily MACD, and net large-order outflows.
For informational purposes only. This is not investment advice. Crypto assets are volatile; do your own research and consider your risk tolerance.
Live BTC/USDT data:
Price: $58,219.24
Change: −2.11% over 24h, −15.50% over 7d, −31.13% over 30d
24h range: $55,130–$62,341.94
Short-term view — 1-hour indicators
RSI: 46.39, close to neutral.
MACD: bullish crossover, with MACD DIF at 25.81.
However, price remains below the 7-hour EMA at $61,903.25, 25-hour EMA at $62,338.32, and 99-hour EMA at $63,844.44.
Large-order flow over the last day was a net outflow of approximately 8,020.66 BTC, showing continued selling pressure.
This is a mixed short-term signal: momentum has improved from extremely weak levels, but price remains below key hourly averages.
Higher-timeframe view — daily indicators
Daily RSI: 18.73, deeply oversold.
Daily MACD DIF: −1,006.58, consistent with strong negative momentum.
Price is below the daily EMAs:
7-day EMA: $65,229.29
25-day EMA: $71,886.08
99-day EMA: $75,820.89
The daily lower Bollinger Band is $60,458.17, placing the current price about 3.70% below it.
The daily structure remains bearish, although the very low RSI indicates that selling has already become unusually intense. Oversold conditions can persist and do not, by themselves, confirm a reversal.
Relevant observed reference levels
These are current market references, not price targets or trading instructions:
$55,130: recent 24h low
$60,458: daily lower Bollinger Band
$62,137–$62,338: 1-hour Bollinger midpoint and 25-hour EMA
$72,035: daily Bollinger midpoint
Future outlook
Short-term price movements cannot be reliably predicted, and I can’t provide personalized investment or trading advice. The available evidence shows:
Bearish evidence: negative 7-day and 30-day performance, price below daily moving averages, negative daily MACD, and net large-order outflows.
For informational purposes only. This is not investment advice. Crypto assets are volatile; do your own research and consider your risk tolerance.