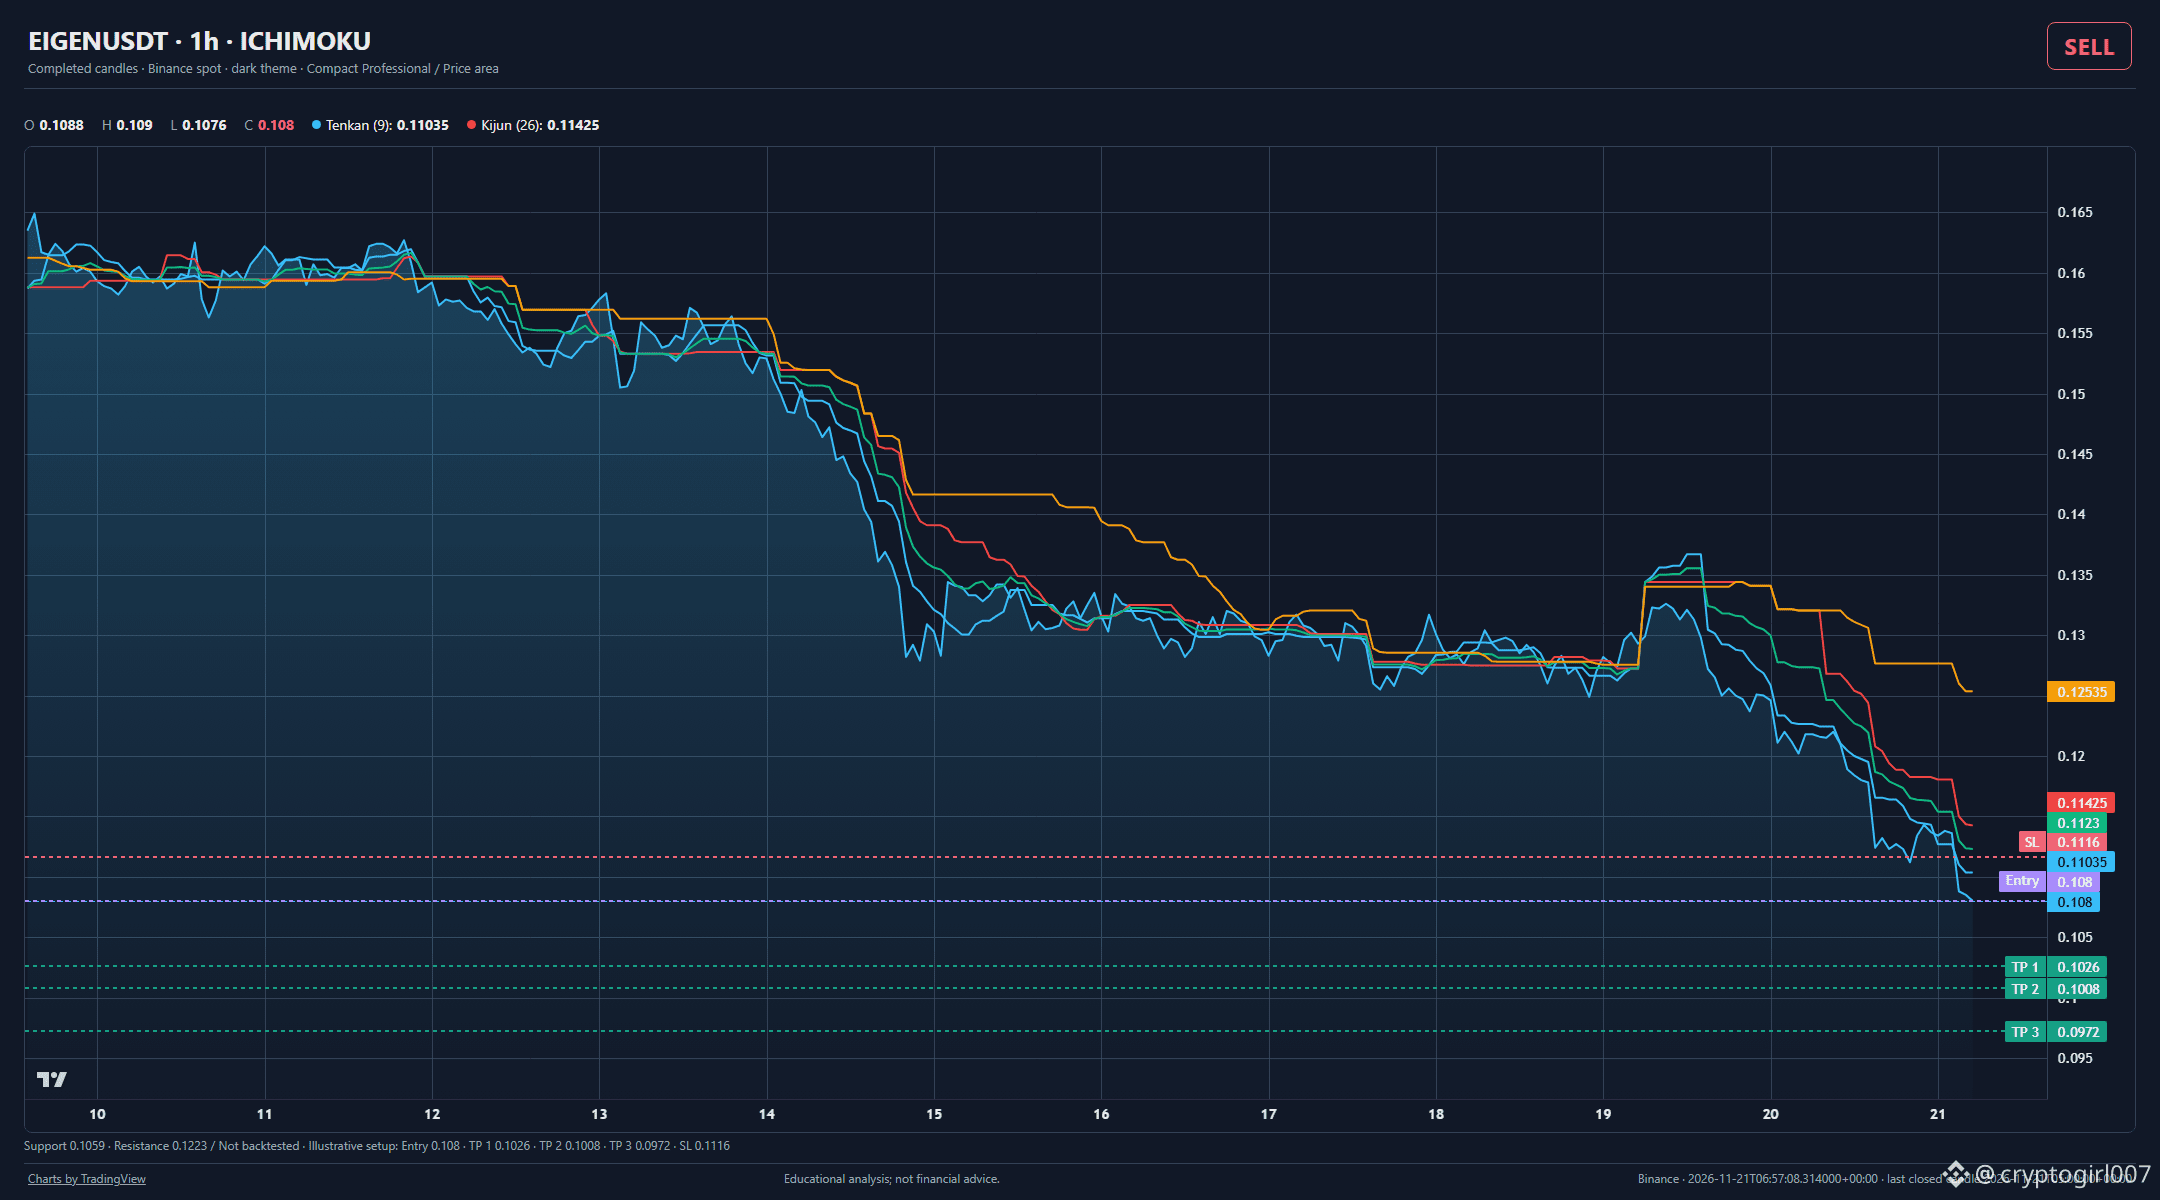
The Ichimoku indicator corroborates the bearish directional bias on the hourly chart, aligning with the established sell signal for this asset.
$EIGEN is showing a bearish setup on the hourly chart.
ICHIMOKU supports the bearish reading. This supports the Sell signal. The last closed candle was around 0.108 USDT. Support sits near 0.1059, with resistance around 0.1223.
SELL · illustrative short setup (USDT)
Entry ≈ 0.108
TP1 ≈ 0.1026
TP2 ≈ 0.1008
TP3 ≈ 0.0972
SL ≈ 0.1116
Closed-candle analysis, not a live quote or trade instruction; not backtested.
#TechnicalAnalysis #DYOR
Educational analysis; not financial advice.
$EIGEN is showing a bearish setup on the hourly chart.
ICHIMOKU supports the bearish reading. This supports the Sell signal. The last closed candle was around 0.108 USDT. Support sits near 0.1059, with resistance around 0.1223.
SELL · illustrative short setup (USDT)
Entry ≈ 0.108
TP1 ≈ 0.1026
TP2 ≈ 0.1008
TP3 ≈ 0.0972
SL ≈ 0.1116
Closed-candle analysis, not a live quote or trade instruction; not backtested.
#TechnicalAnalysis #DYOR
Educational analysis; not financial advice.