



Bitcoin is facing intense selling pressure, and the market structure is becoming increasingly bearish. BTC has suffered a major breakdown from its previous consolidation range, with sellers maintaining control of the daily trend.
The big question now is: Will Bitcoin continue towards $54,500, or can an oversold bounce trigger a short-term recovery?
Let's break down the technical structure, market sentiment, liquidity, and possible trading opportunities.
1. Current Bitcoin Market Situation
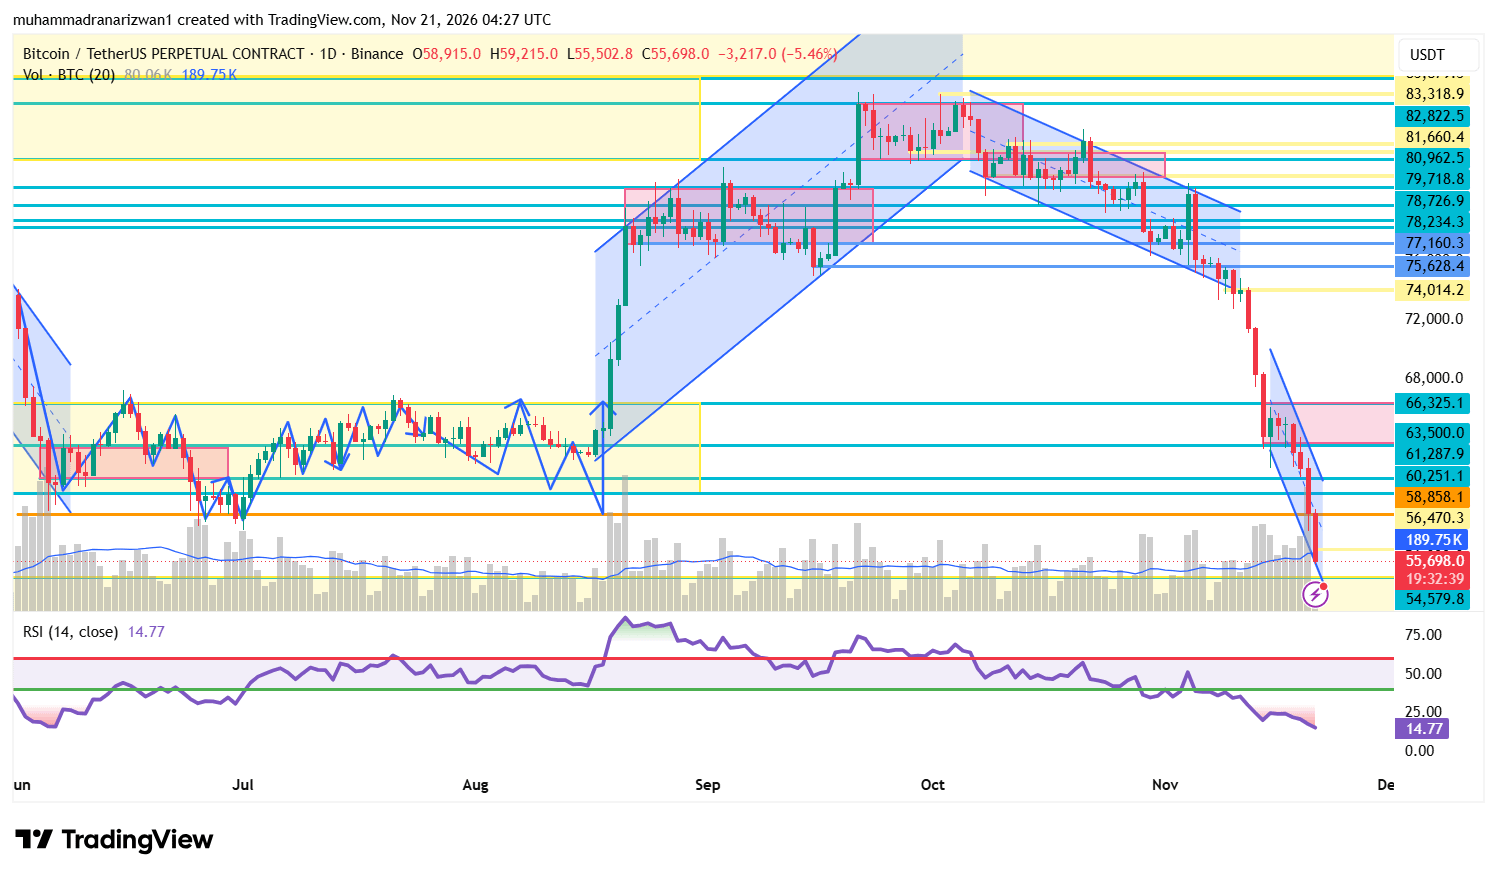
According to the provided BTC/USDT Perpetual daily chart:
Opening Price: $58,915
Daily High: $59,215
Daily Low: $55,502.8
Chart Price: $55,698
Daily Change: -5.46%
Daily RSI: 14.77
Bitcoin has experienced a strong bearish breakdown after losing several important support levels.
The previous descending channel failed to hold the price, and sellers pushed BTC below the $60,000 psychological level.
The most important observation is that BTC is trading below its previous support zone, which could now act as resistance.
Market Bias: Bearish until BTC reclaims important resistance levels.
2. Technical Analysis – Daily Timeframe
The daily chart shows a clear change in market structure.
Previously, Bitcoin was trading inside an upward channel, followed by a descending consolidation structure. However, the recent aggressive sell-off has invalidated the bullish recovery structure.
Three important observations:
Lower highs and lower lows indicate bearish market structure.
The breakdown below $60,000 confirms significant selling pressure.
Strong bearish candles indicate that buyers have not yet regained control.
BTC is now approaching an important demand and support region around $54,500–$55,000.
If this region fails, additional downside could follow.
3. Important Support Levels
Watch these levels carefully:
$54,580: Major immediate support.
$52,500: Potential next downside target if $54,580 breaks decisively.
$50,000: Psychological support and a possible deeper correction zone.
A daily candle close below $54,580 could increase the probability of another bearish continuation.
However, a strong rejection from this region could produce a short-term relief rally.
4. Important Resistance Levels
Bitcoin needs to recover several levels before bulls can regain confidence.
ResistanceImportance$56,470First recovery level$58,858Important resistance$60,251Major reclaim level$61,288Next resistance$63,500Strong recovery target$66,325Major bullish recovery zone
A recovery above $58,858 would be the first meaningful improvement.
A daily close above $60,251 would provide stronger evidence that buyers are returning.
Until then, rallies should be treated cautiously.
5. RSI Analysis – Is Bitcoin Oversold?
One of the most important indicators right now is RSI.
The daily RSI on the provided TradingView chart is approximately 14.77.
This is an extremely oversold reading.
What does this mean?
Selling pressure has become exceptionally strong.
A temporary relief bounce is possible.
Short sellers should be careful about entering after an extended bearish candle.
Oversold conditions do not automatically confirm a market bottom.
Important: Bitcoin can remain oversold for an extended period during a strong bearish trend.
We need bullish price action and confirmation before considering a trend reversal.
6. Market Sentiment and Institutional Data
The Daily Watching 2.0 report for November 21 provides several important signals.
Crypto Fear & Greed Index: 12
This indicates extreme fear and weak investor confidence.
US BTC Spot ETF Daily Net Flow: -$124.43 Million
ETF outflows indicate that institutional demand is currently under pressure.
Crypto Market Capitalization: Approximately $1.96 Trillion
The broader cryptocurrency market is also experiencing significant weakness.
USDT Dominance: 9.094%
Rising stablecoin dominance can reflect defensive positioning and capital moving away from riskier crypto assets.
BTC Dominance: 58.50%
Bitcoin dominance remains elevated, but this does not necessarily indicate bullish BTC price action.
BTC Open Interest: $37.91 Billion
High open interest during a sharp price decline deserves attention because leveraged positions can increase volatility.
Funding Rate: 0.0038%
Funding is relatively neutral in the supplied report. This means the derivatives market does not show an extreme funding imbalance in the reported snapshot.
Overall, institutional flows, sentiment, and market structure are currently providing a bearish background.
7. Liquidity and Liquidation Analysis
According to the provided CoinGlass
Long-side liquidation reference: $56,080.68
Short-side liquidation reference: $59,610.92
Additional long liquidation level: $60,828
Additional short liquidation level: $56,478
These levels are worth monitoring for potential liquidity reactions.
If BTC moves towards $56,478–$56,080, traders should watch whether price rejects or accepts below that area.
A recovery towards $59,610 could also trigger short liquidations and produce a temporary upside squeeze.
Remember: liquidation levels are reference zones, not guaranteed price targets.
8. BTC Trading Signals – November 21, 2026
Here are two possible trading setups based on the current structure.
🔴 Setup 1: BTC SHORT (Preferred Scenario)
Trade Direction: SHORT
Entry Zone: $56,470–$58,850
Stop Loss: $60,350
Take Profit 1: $54,580
Take Profit 2: $52,500
Extended Target: $50,000
Confirmation:
Wait for BTC to retrace into the resistance zone and show bearish rejection on the 1H or 4H timeframe.
Do not chase the market after a major red candle. Wait for a proper pullback.
🟢 Setup 2: BTC LONG (Counter-Trend Opportunity)
Trade Direction: LONG
Entry Zone: $54,580–$55,200
Stop Loss: $53,700
Take Profit 1: $56,470
Take Profit 2: $58,850
Extended Target: $60,250
Confirmation:
Only consider this setup if BTC shows a strong bullish rejection, followed by a confirmed 1H or 4H market structure shift.
This is a counter-trend trade, not a confirmed long-term reversal.
Risk Management: Both setups are conditional. Avoid entering blindly. Risk no more than 0.5%–1% of trading capital on a single setup, and adjust position size according to stop-loss distance.
9. What Is the Next Move for Bitcoin?
I see three possible scenarios:
Scenario A – Bearish Continuation (Higher Probability)
If BTC remains below $56,470 and breaks $54,580 with a strong candle close, the next potential downside zone becomes $52,500.
Continued selling pressure could eventually bring $50,000 into focus.
Scenario B – Oversold Relief Rally
If BTC holds $54,580 and buyers defend the region, a recovery towards $56,470 and $58,850 becomes possible.
This would initially be a relief rally rather than a confirmed bullish reversal.
Scenario C – Bullish Recovery
If BTC reclaims $58,850 and establishes support above $60,250, the market could attempt a stronger recovery towards $61,288 and $63,500.
This scenario requires clear confirmation from volume and market structure.
10. Final Market Prediction
My current bias for Bitcoin is BEARISH.
The daily trend remains under pressure, institutional ETF flows are negative, market sentiment is extremely fearful, and RSI is showing deeply oversold conditions.
My main focus is the $54,580 support level.
If buyers defend this area, Bitcoin could experience a temporary recovery. However, a decisive breakdown could open the door towards $52,500.
I would prefer waiting for a pullback and bearish confirmation rather than opening a fresh short position at the bottom of an extended sell-off.
My Strategy: Sell the confirmed rejection, watch $54,580 for support, and wait for a daily structure shift before considering a bigger bullish position.
⚠️ Disclaimer: This article is for educational and informational purposes only, not financial advice. Cryptocurrency trading involves substantial risk, particularly when using leverage. Always manage your risk and do your own research (DYOR).
#bitcoin #BTCUSDT.P #CryptoAnalysis #BTCUSDTAnalysis #BinanceSquareBTC