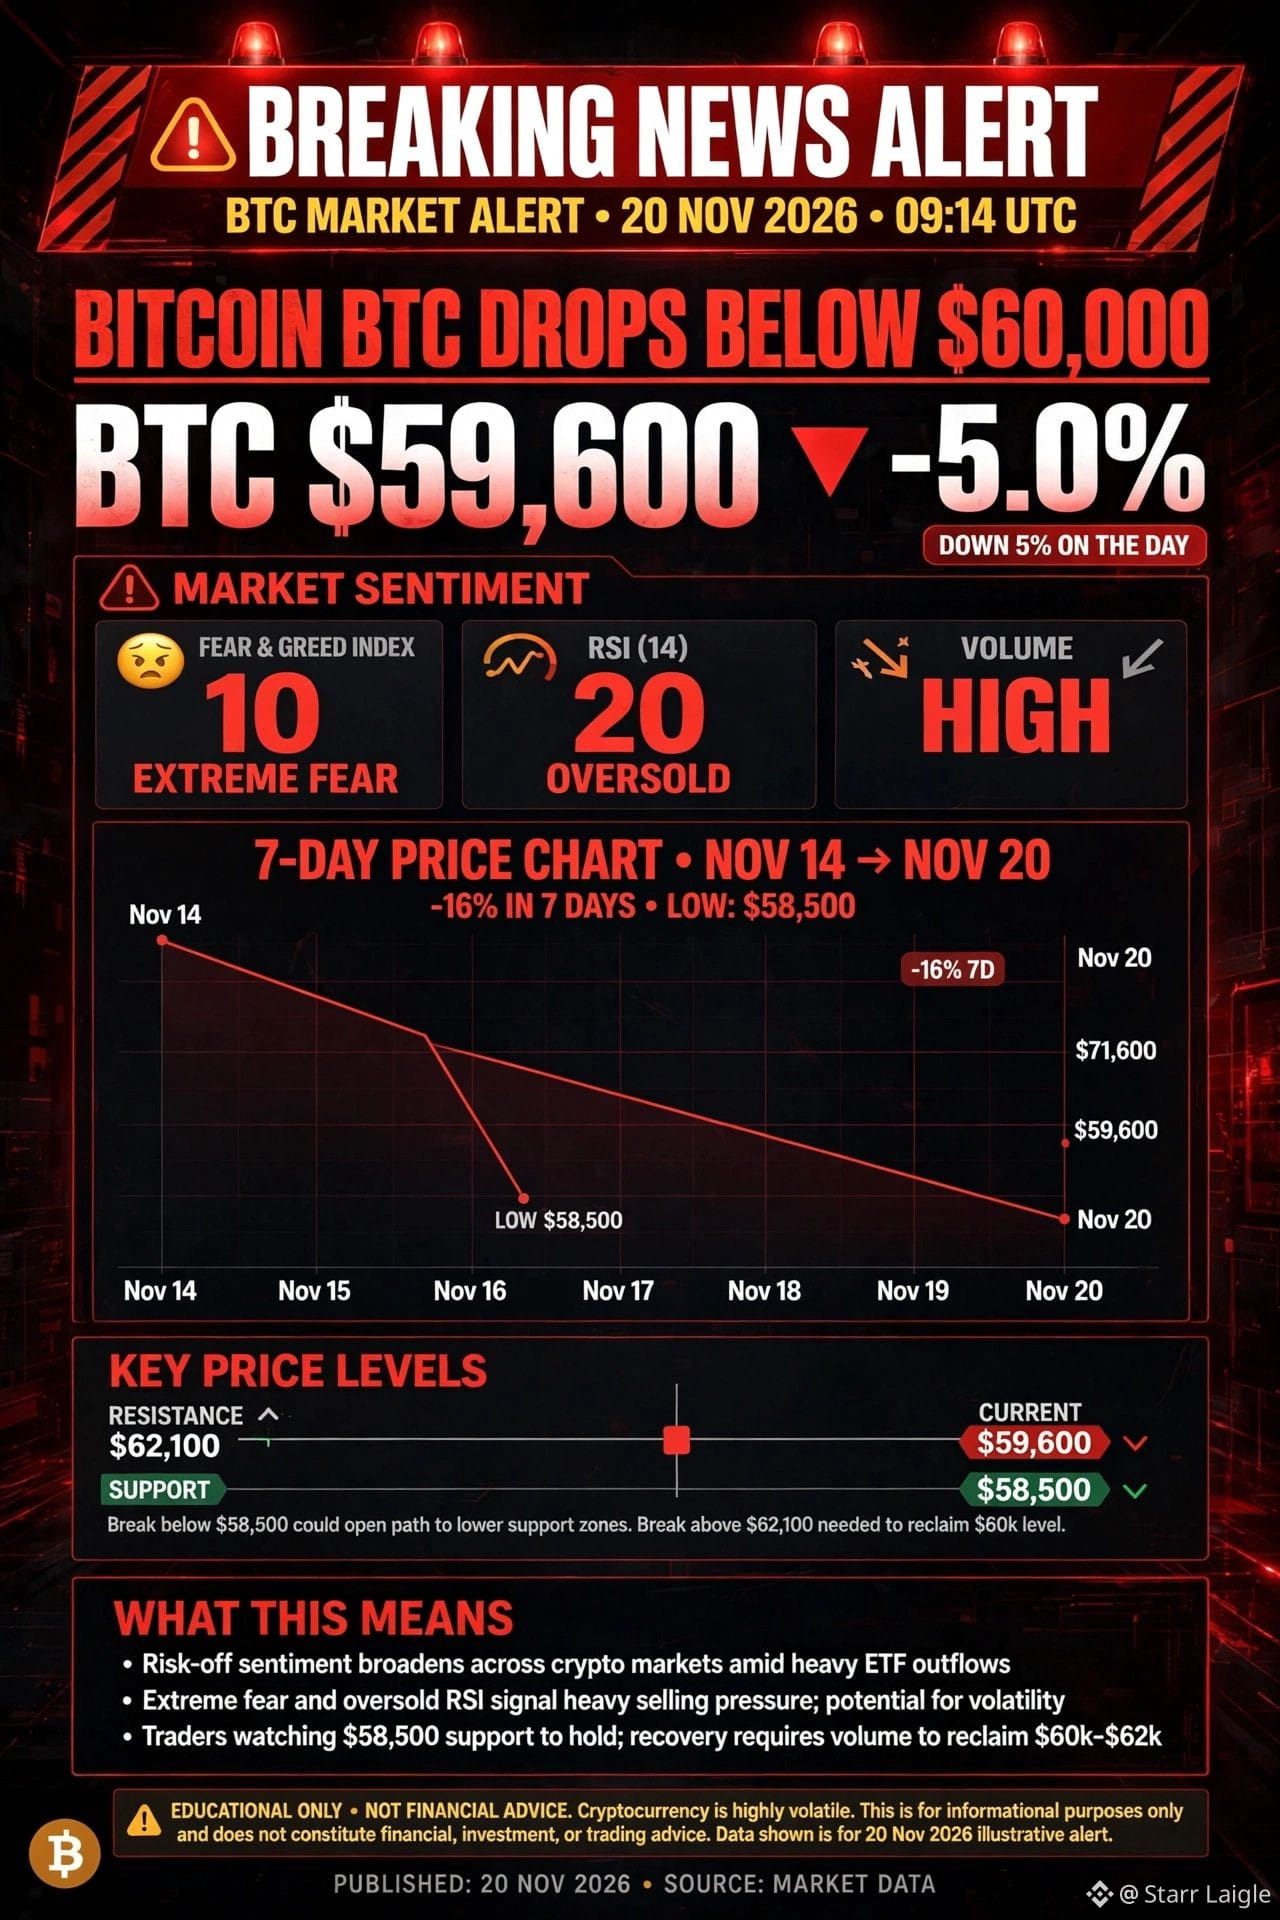
*📉 $BTC 7-DAY CHART BREAKDOWN - 20 NOV 2026*
You saw the alert. Now see the CHART. This chart explains why everyone is scared.
*7-DAY PRICE JOURNEY:*
- *14 Nov: $71,000* - Starting point. $BTC was already weak, but still holding $70k.
- *15 Nov: $68,500* - Broke $70k. First panic. People said "just a dip".
- *16 Nov: $65,000* - Broke $67k - $65k support. Second panic. Longs started getting liquidated.
- *17 Nov: $63,500* - $ETFT.ETF outflows $240M. Institutions selling. Price stuck under $65k.
- *18 Nov: $62,100* - BlackRock outflow news leaking. BTC tried to bounce, failed at $65k.
- *19 Nov: $61,500* - BlackRock $541M outflow CONFIRMED. Biggest outflow ever. BTC broke $62k.
- *20 Nov: $59,600* - Broke $60k. Touched $58,500 low. Now trading $59,600.
*TOTAL FALL: $71,000 to $59,600 = -$11,400 = -16% in 7 days*
*TOTAL FALL FROM OCT HIGH: $86,475 to $58,500 = -$27,975 = -32.3% in 6 weeks*
This is not a dip. This is a CRASH.
*WHAT DOES CHART TELL US?*
*1. Downtrend is STEEP and CLEAN*
Chart is not sideways. It's a staircase DOWN. Every day lower than previous day.
*2. Every Bounce FAILED*
16 Nov bounce to $67k - FAILED
18 Nov bounce to $65k - FAILED
19 Nov bounce to $63k - FAILED
20 Nov bounce to $61k - FAILED
*3. $60,000 Break is HUGE*
$60k was psychological + technical support for 4 months. It held in July, August, September, October. Now it BROKE in 1 hour with $1,800 drop. $60k AND $62,100 to be safe.
*4. Volume is HIGH on DOWN days*
$32 Billion volume. High volume + falling price = Strong selling. This is not low-volume fake dump. This is real selling.
*5. $58,500 is Last Defense*
BTC touched $58,500 and bounced to $59,600. That $58,500 is now THE line. If BTC closes below $58,500 today, next stop is $57,753, then $53,700. If BTC holds $58,500, we can see bounce to $62,100.
*WHAT TO DO NOW?*
*If You Are Holding BTC:*
Don't sell at $59,600. You are at 4-month low, Fear 10, RSI 20.
#BTC #BTC走势分析 #ETFvsBTC #ETFvsBTC #ETFs
You saw the alert. Now see the CHART. This chart explains why everyone is scared.
*7-DAY PRICE JOURNEY:*
- *14 Nov: $71,000* - Starting point. $BTC was already weak, but still holding $70k.
- *15 Nov: $68,500* - Broke $70k. First panic. People said "just a dip".
- *16 Nov: $65,000* - Broke $67k - $65k support. Second panic. Longs started getting liquidated.
- *17 Nov: $63,500* - $ETFT.ETF outflows $240M. Institutions selling. Price stuck under $65k.
- *18 Nov: $62,100* - BlackRock outflow news leaking. BTC tried to bounce, failed at $65k.
- *19 Nov: $61,500* - BlackRock $541M outflow CONFIRMED. Biggest outflow ever. BTC broke $62k.
- *20 Nov: $59,600* - Broke $60k. Touched $58,500 low. Now trading $59,600.
*TOTAL FALL: $71,000 to $59,600 = -$11,400 = -16% in 7 days*
*TOTAL FALL FROM OCT HIGH: $86,475 to $58,500 = -$27,975 = -32.3% in 6 weeks*
This is not a dip. This is a CRASH.
*WHAT DOES CHART TELL US?*
*1. Downtrend is STEEP and CLEAN*
Chart is not sideways. It's a staircase DOWN. Every day lower than previous day.
*2. Every Bounce FAILED*
16 Nov bounce to $67k - FAILED
18 Nov bounce to $65k - FAILED
19 Nov bounce to $63k - FAILED
20 Nov bounce to $61k - FAILED
*3. $60,000 Break is HUGE*
$60k was psychological + technical support for 4 months. It held in July, August, September, October. Now it BROKE in 1 hour with $1,800 drop. $60k AND $62,100 to be safe.
*4. Volume is HIGH on DOWN days*
$32 Billion volume. High volume + falling price = Strong selling. This is not low-volume fake dump. This is real selling.
*5. $58,500 is Last Defense*
BTC touched $58,500 and bounced to $59,600. That $58,500 is now THE line. If BTC closes below $58,500 today, next stop is $57,753, then $53,700. If BTC holds $58,500, we can see bounce to $62,100.
*WHAT TO DO NOW?*
*If You Are Holding BTC:*
Don't sell at $59,600. You are at 4-month low, Fear 10, RSI 20.
#BTC #BTC走势分析 #ETFvsBTC #ETFvsBTC #ETFs