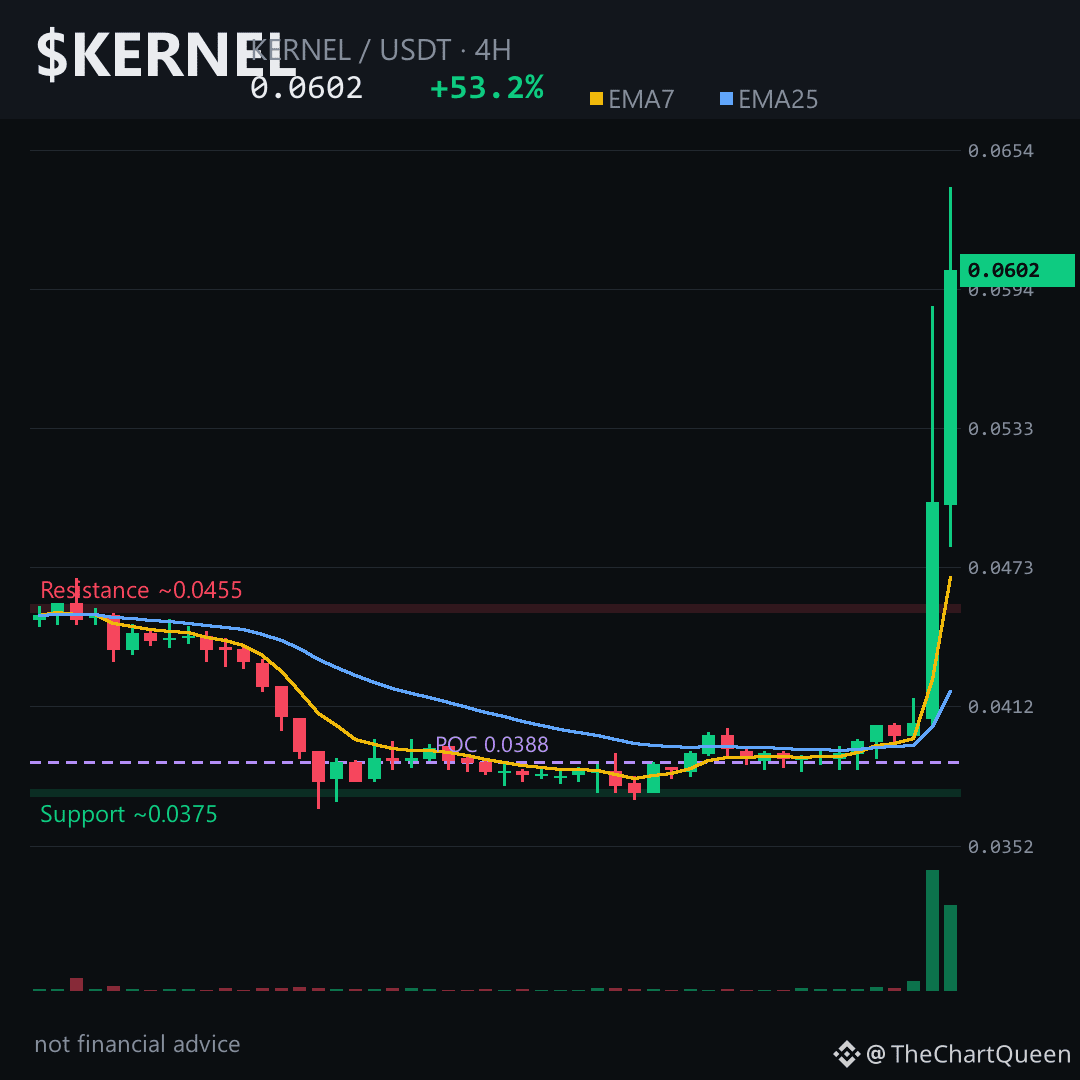
Imagine watching a quiet coin for two days, then a single 4-hour candle rips 23% higher. That's $KERNEL right now — up 53% in 24 hours, and the question isn't whether it's moving. It's whether the fuel behind this move is real demand or borrowed momentum.
Funding is deeply negative — shorts paying longs. Open interest at 120M means big liquidity is watching. Long/short ratio leans long, a contrarian caution flag against that funding.
4H chart: price holding above 0.0569 — around 0.057. As long as that zone survives on a close, the bullish read stays intact. EMA7 above EMA25; RSI screaming at 91 — extremely overbought, but momentum like this can persist. Volume profile shows heavy interest near 0.0388, so this launch came from real accumulation. Next objective: 0.065 area, roughly +8%. Lose 0.057 on a 4H close, and it flips from "dip buyers defending" to "late longs trapped."
My read: momentum-driven breakout with genuine volume, but negative funding + overbought RSI make it a high-risk chase. Structure is respectable, but gravity is real.
Tap $KERNEL to pull up the chart and see if these levels make sense to you. I'll keep updating this read as the structure evolves — follow so the next breakdown lands on your feed.
What level are you watching more closely right now — the support holding it up or the objective zone above?
⚠️ Not financial advice. DYOR.
#KERNEL #Crypto #BinanceSquare #Altcoins
Funding is deeply negative — shorts paying longs. Open interest at 120M means big liquidity is watching. Long/short ratio leans long, a contrarian caution flag against that funding.
4H chart: price holding above 0.0569 — around 0.057. As long as that zone survives on a close, the bullish read stays intact. EMA7 above EMA25; RSI screaming at 91 — extremely overbought, but momentum like this can persist. Volume profile shows heavy interest near 0.0388, so this launch came from real accumulation. Next objective: 0.065 area, roughly +8%. Lose 0.057 on a 4H close, and it flips from "dip buyers defending" to "late longs trapped."
My read: momentum-driven breakout with genuine volume, but negative funding + overbought RSI make it a high-risk chase. Structure is respectable, but gravity is real.
Tap $KERNEL to pull up the chart and see if these levels make sense to you. I'll keep updating this read as the structure evolves — follow so the next breakdown lands on your feed.
What level are you watching more closely right now — the support holding it up or the objective zone above?
⚠️ Not financial advice. DYOR.
#KERNEL #Crypto #BinanceSquare #Altcoins