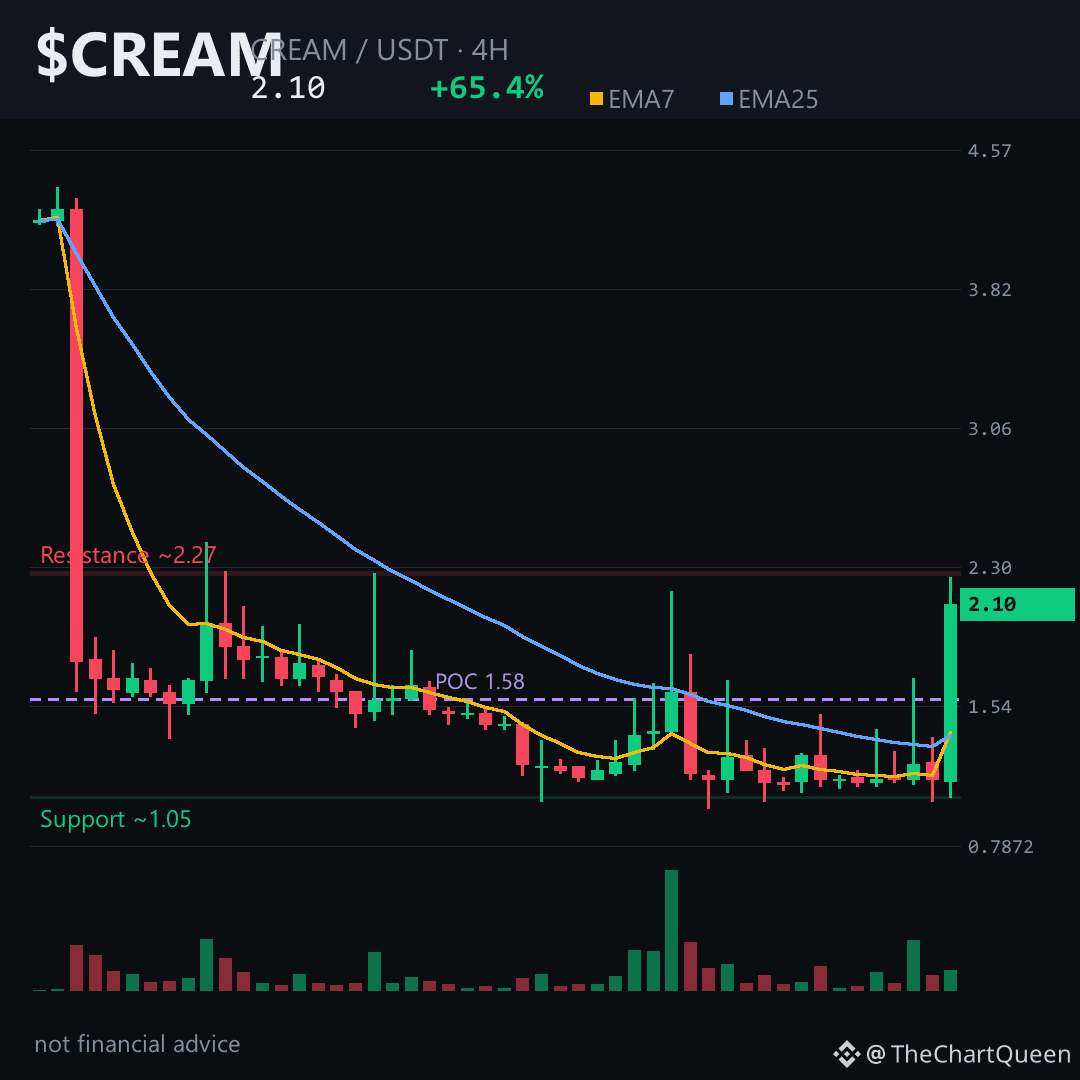
That 84% single-candle rip from $1.05 to $2.25 looks like a dead cat on a trampoline — fun to watch, dangerous to chase. The 4H chart is screaming momentum, but the bigger picture is still bleeding. Here’s the trap hiding in plain sight.
Price sits just above the 4H pivot near 2.09. 4H RSI is 65 — warm, not overheated — and shorter EMAs have flipped bullish. That’s the seductive part. But the daily RSI is still buried at 33, and price remains far below every major weekly moving average. This is a bounce inside a downtrend, not a regime change.
The 4H read is the cleanest: as long as $CREAM holds above the 1.99 area, momentum favors continuation toward 2.28. Lose that 1.99 floor on a 4H close, and the bounce narrative unravels fast — the next magnet below isn’t pretty.
Futures show zero open interest and flat funding. No leveraged crowd driving this — just thin spot flow, making the move fragile in both directions.
My read: the 4H chart wants higher, but the daily chart is a ceiling. Chasing a +65% candle into bearish daily structure is how accounts bleed. Tap $CREAM and watch the 2.28 zone on the 4H — that’s the real test.
Which level are you trusting more right now on $CREAM — the 4H momentum or the daily downtrend? 👇
Follow for the next read on this chart.
⚠️ Not financial advice. DYOR.
#CREAM #Crypto #BinanceSquare
Price sits just above the 4H pivot near 2.09. 4H RSI is 65 — warm, not overheated — and shorter EMAs have flipped bullish. That’s the seductive part. But the daily RSI is still buried at 33, and price remains far below every major weekly moving average. This is a bounce inside a downtrend, not a regime change.
The 4H read is the cleanest: as long as $CREAM holds above the 1.99 area, momentum favors continuation toward 2.28. Lose that 1.99 floor on a 4H close, and the bounce narrative unravels fast — the next magnet below isn’t pretty.
Futures show zero open interest and flat funding. No leveraged crowd driving this — just thin spot flow, making the move fragile in both directions.
My read: the 4H chart wants higher, but the daily chart is a ceiling. Chasing a +65% candle into bearish daily structure is how accounts bleed. Tap $CREAM and watch the 2.28 zone on the 4H — that’s the real test.
Which level are you trusting more right now on $CREAM — the 4H momentum or the daily downtrend? 👇
Follow for the next read on this chart.
⚠️ Not financial advice. DYOR.
#CREAM #Crypto #BinanceSquare