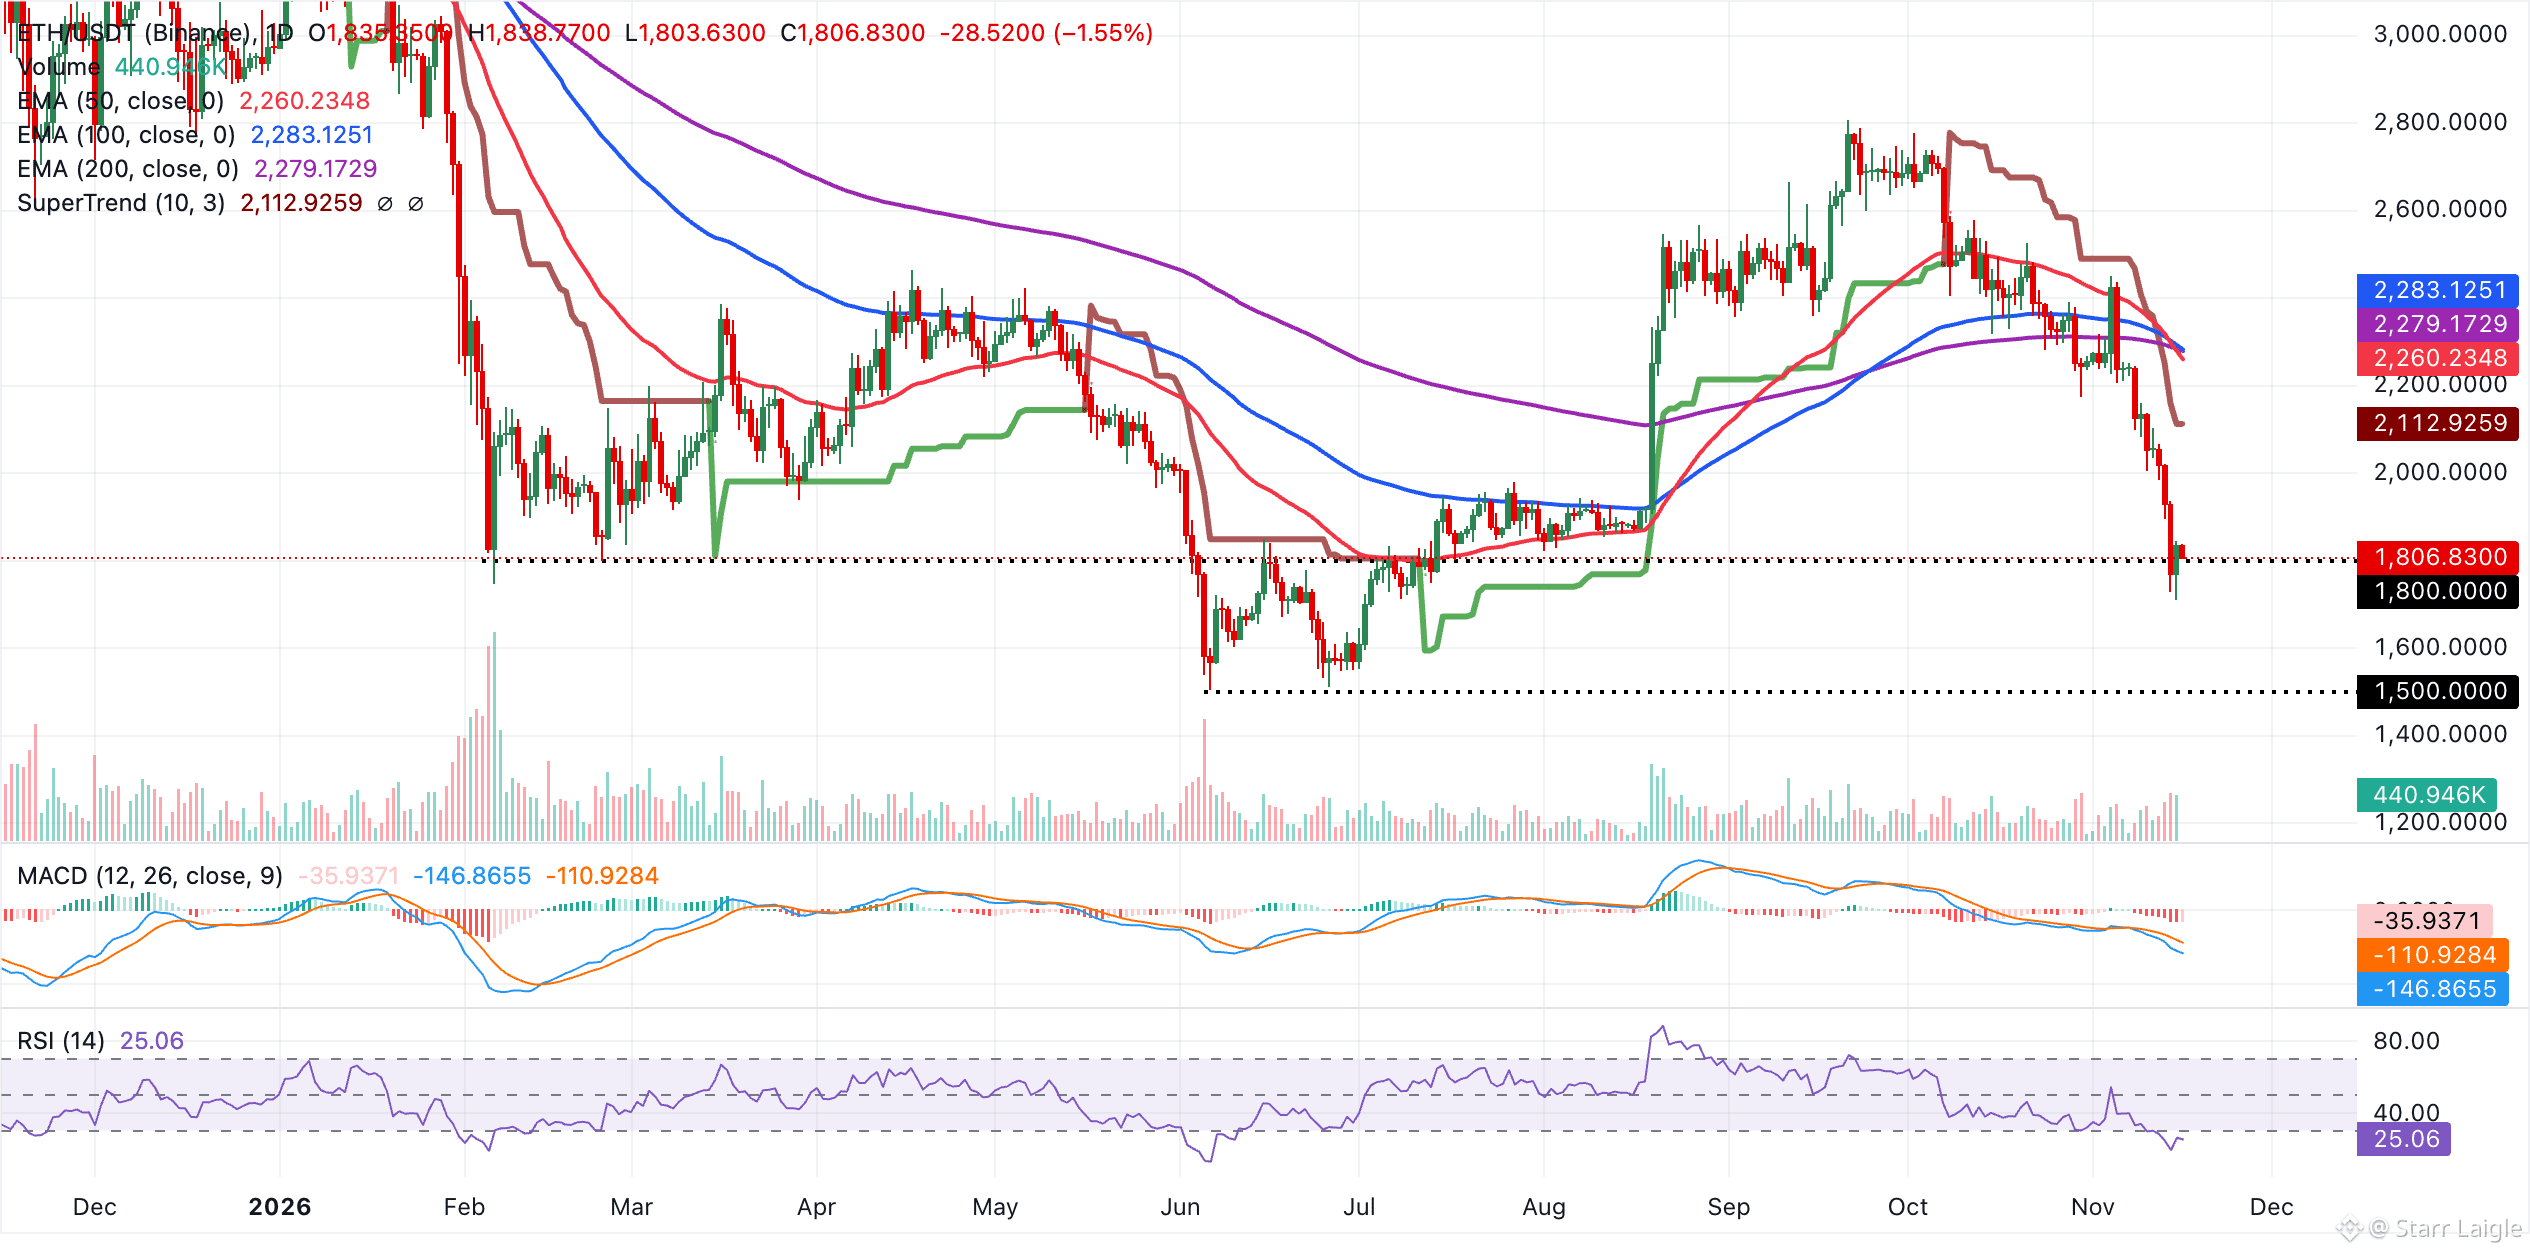
$ETH technical analysis: $ETH momentum deteriorates further
$ETH trades at $1,807, keeping a clear bearish near-term bias as price holds well below the 50-day, 100-day and 200-day EMAs clustered in the $2,260-$2,283 area. The MACD stays deep in negative territory, while the RSI at 25 sits in oversold conditions, suggesting persistent downside pressure even as the market shows signs of short-term exhaustion.
Immediate resistance lies at the 50-day EMA near $2,260, followed by the 200-day EMA at $2,279 and the 100-day EMA around $2,283, forming a dense overhead supply zone that would need to be reclaimed to ease the current bearish tone. On the downside, the Super Trend line offers the next notable support around $2,113, with a daily close back above that zone needed to hint at stabilization rather than a continuation of the recent slide.
#ETH #ETH🔥🔥🔥🔥🔥🔥 #Ethereum #ETH(二饼) #BTC
$ETH trades at $1,807, keeping a clear bearish near-term bias as price holds well below the 50-day, 100-day and 200-day EMAs clustered in the $2,260-$2,283 area. The MACD stays deep in negative territory, while the RSI at 25 sits in oversold conditions, suggesting persistent downside pressure even as the market shows signs of short-term exhaustion.
Immediate resistance lies at the 50-day EMA near $2,260, followed by the 200-day EMA at $2,279 and the 100-day EMA around $2,283, forming a dense overhead supply zone that would need to be reclaimed to ease the current bearish tone. On the downside, the Super Trend line offers the next notable support around $2,113, with a daily close back above that zone needed to hint at stabilization rather than a continuation of the recent slide.
#ETH #ETH🔥🔥🔥🔥🔥🔥 #Ethereum #ETH(二饼) #BTC