


$ETH / USD - Complete Analysis
19 Nov 2026
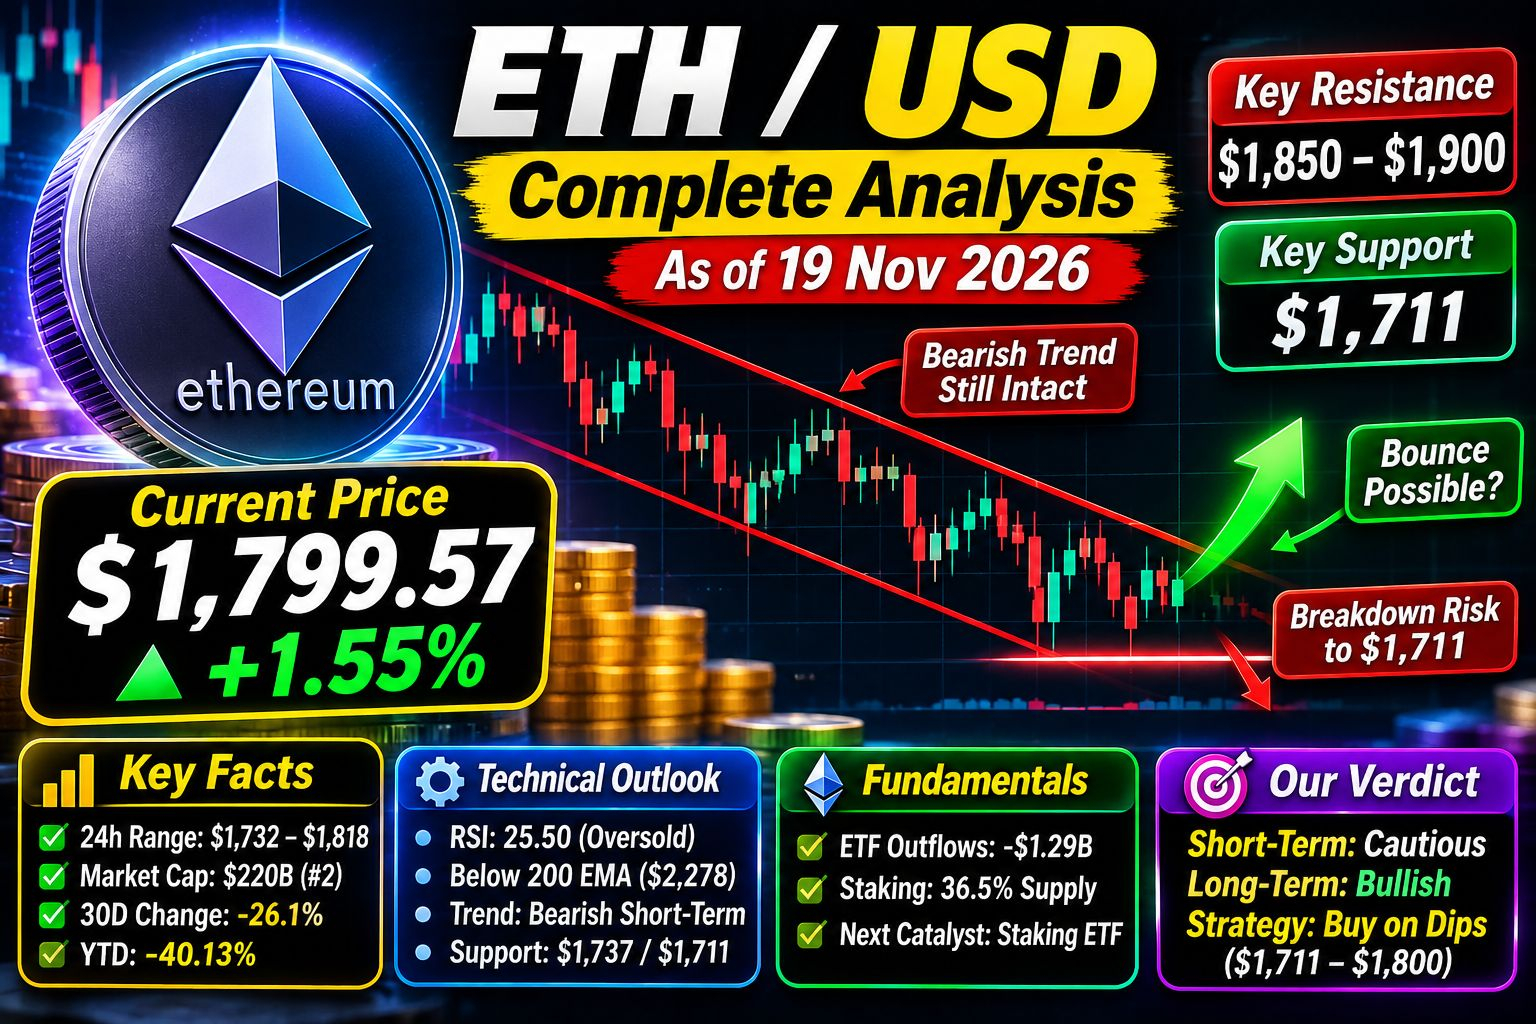
1. Current Price Snapshot
Price: ~ $1,769 - $1,810 depending on exchange / time
Latest Binance quote: $1,799.57 USDT at 15:10 UTC, +1.55% on the day
24h Range: $1,732.83 - $1,818.48
24h Change: -1.92% to +1.55% - choppy, recovering from intraday low
5-Day Change: +1.66%
30-Day Change: -26.1% to -26.56%
6-Month Change: -15.54%
Year-to-Date: -40.13%
1-Year Change: -36.54%
Market Cap: $220.32B
Market Cap Rank: #2
Circulating Supply: 122.23M ETH
30-Day High: $2,526
30-Day Low / November Low: $1,711
Distance from 30-day High: -29%
ETH is in a deep correction after breaking below $2,000. It is now fighting to hold the $1,750-$1,800 zone.
### 2. Technical Analysis

Overall Bias: Bearish short-term, Oversold
Structure: Series of lower highs since breaking below $2,000. Broke down from $2,515 -> $2,005 leg, then lost $2,000, then lost $1,900.
Immediate Contest: $1,780 - $1,820 - buyers need to turn this shelf into a base, sellers need only a breakdown to expose $1,711.
Momentum:
RSI: 25.50 - Deeply oversold on one model, classic bounce territory but tape still leaning against bulls
Other RSI readings: Weak, but not yet capitulation
Bollinger Lower Band: $1,704.67 - price is hugging the lower band
Key Moving Average:
200-day EMA: $2,278.80 - Upside stays capped below this until ETH closes back above $1,900
Price is far below all major MAs - trend is damaged
Key Levels - Support & Resistance:
| Type | Level | Distance from ~$1,800 |
| --- | --- | --- |
| Immediate Resistance | $1,841 - $1,850 | +2.3% to +2.8% |
| Strong Resistance | $1,885 - $1,900 | +4.7% to +5.5% |
| Breakout Resistance | $1,927 - $2,000 | +7% to +11% |
| Major Resistance | $2,170 - $2,200 | +20% to +22% |
| Major Resistance | $2,278 (200-day EMA) | +26.5% |
| Psychological Resistance | $2,526 (30-day high) | +40% |
| Pivot | $1,800.45 | Right at price |
| Immediate Support | $1,764.90 - $1,749.70 | -2% to -2.8% |
| Strong Support | $1,737 - $1,715 | -3.5% to -4.7% |
| Critical Support | $1,711 (November Low) | -4.9% |
| Breakdown Target | $1,540 - $1,200 | -14% to -33% |
Nearest support $1,737, nearest resistance $1,850.
What to watch:
Bullish trigger: Daily close above $1,850, then reclaim $1,900. That would signal oversold bounce is real.
Bearish trigger: Daily close below $1,764, then break of $1,711 opens a deeper extension toward $1,540, and in worst-case models $1,200.
3. Fundamental Analysis
On-Chain - Still Solid, But Revenue Down:
Daily Mainnet Txs (2026 avg): 2.16M
Gas: At 5-year lows - cheap to use, but means low fee revenue
Fee Revenue: Down -58% YoY - this is eroding the "ultrasound money" narrative
Stablecoin Transfers (Jan-Oct 2026): $25.8 Trillion, up +61% YoY - Ethereum is still the settlement layer for stablecoins
Consensus: Proof-of-Stake
Staking - Record High, But Slowing:
Staked Supply: ∼36.5% - 35.9% of circulating supply
Amount Staked: 43.80M - 44.6M ETH
Active Validators: ∼796,121
Validator Entry Queue: 1,036,882 ETH (∼$2.3B) waiting to enter
Average Gross Staking Yield: 2.63%, down from 2.81%
Caveat: Staking inflows fell ∼40% even as ratio hit record - new demand is easing
This is bullish for supply: Over 1/3 of ETH is locked and cannot be sold instantly. But lower yield + falling price = less incentive for new stakers.
ETF Flows - The Main Pressure:
This is the biggest reason $ETH is down.
Cumulative Net Inflows Since Launch (July 2024): $12.4B (down from $14.0B on Sep 28)
October Outflows: $578.9M
Last 30 Days: -$1.29B (-574.79K ETH), price -24.40% in same period
Trailing 30 Days (Nov 12): Over -$2B outflows reported
Nov 4: +$53.02M - First positive day after 7 sessions / $514.8M outflows prior week. BlackRock ETHA led with +$32.8M, Fidelity FETH +$19.24M
Nov 5: -$99.9M outflows, BlackRock ETHA -$75.2M
Nov 6: -$93.19M
Nov 9-13 Week: -$398.9M total. Nov 11: -$144.8M, Nov 12: -$70.5M
Nov 17: -$29.1M, Last Week -$43.2M
Pattern: One green day, then 3-4 red days. Institutions are net sellers in November.
Upcoming Catalyst:
Staking ETF decision due by 15 Nov 2026 - If approved, BlackRock's ETHB (iShares Staked Ethereum Trust, launched Jan 2026) and Grayscale staking products could bring yield to traditional investors. This is the next major catalyst.
Glamsterdam Upgrade - Mentioned as next catalyst for $2,200 floor thesis.
Institutional Target:
Citi 12-month Target: $3,000 (from earlier analysis, now looks far)
BTC/ETH Ratio: 35.6 - Climbing, meaning BTC is outperforming ETH heavily. "Flippening" narrative is dead for now.
4. Forecast / Price Predictions
Model-based, not guarantees:
End of November 2026:
Projected: ∼$1,950, with upside capped below $2,278 until close above $1,900
End of 2027:
Projected: $3,600
2030:
Projected: $5,600
2040:
Projected: $14,000
Other Models:
DappRadar Support/Resistance Model: S1 $1.54k - $1.74k, R3 $2.71k - $2.95k
Recovery Scenario: Bulls must first clear $2,170 - $2,200 before $2,450 target (10% upside from $2,230 levels) comes into play
5. Risk Assessment
Bullish Factors:
RSI 25.5 = deeply oversold, bounce likely
36% supply staked, stablecoin volume +61% YoY
Still #2, still dominant smart-contract chain
Extreme fear often marks bottoms
Bearish Factors:
ETF outflows -$1.29B in 30 days, -$2B trailing
Fee revenue -58% YoY
Below $2,000, below 200-day EMA $2,278, series of lower highs
BTC outperforming, capital rotating out of ETH
6. Complete Verdict & Strategy
Short-term (Days - Weeks): BEARISH / OVERSOLD BOUNCE POSSIBLE
$ETH could bounce to $1,850-$1,900 purely because it's oversold, but trend is still down.
Medium-term (1-3 Months): NEUTRAL TO BEARISH
Needs to reclaim $1,900 and hold it. Until then, every rally is a sell opportunity for trapped buyers from $2,000+.
Long-term (12+ Months): NEUTRAL TO BULLISH on Fundamentals
If staking ETF is approved and Glamsterdam delivers, and ETF flows turn positive, $3,000-$3,600 by end-2027 is plausible. If flows stay negative, $1,200-$1,540 breakdown risk remains.
Simple Plan:
Scalper: Trade $1,764 - $1,850 range. Long above $1,800.45 pivot, short below $1,764.90.
Swing Trader: Wait for daily close above $1,900 for long. Avoid longs below $1,711. If $1,711 breaks, wait for $1,540.
Long-term Holder / DCA: $1,711 - $1,800 is a historical accumulation zone, but DCA in small parts. Don't go all-in. Keep cash for $1,540 if breakdown happens.
Avoid: Buying just because "ETH is cheap now" - it was $2,526 a month ago and fell 29%. Oversold can stay oversold.
This is not financial advice. Verify live price before trading.
Want me to compare ETH vs HYPE head-to-head, or make you a buy/sell plan in PKR for ETH?
#Ethereum #ethupdates #ETHUSDTANALYSIS #ETHAnalysis #ETH🔥🔥🔥🔥🔥🔥