BTCUSDT Alert! Is this distribution or just a shakeout before the next leg up? 🚨
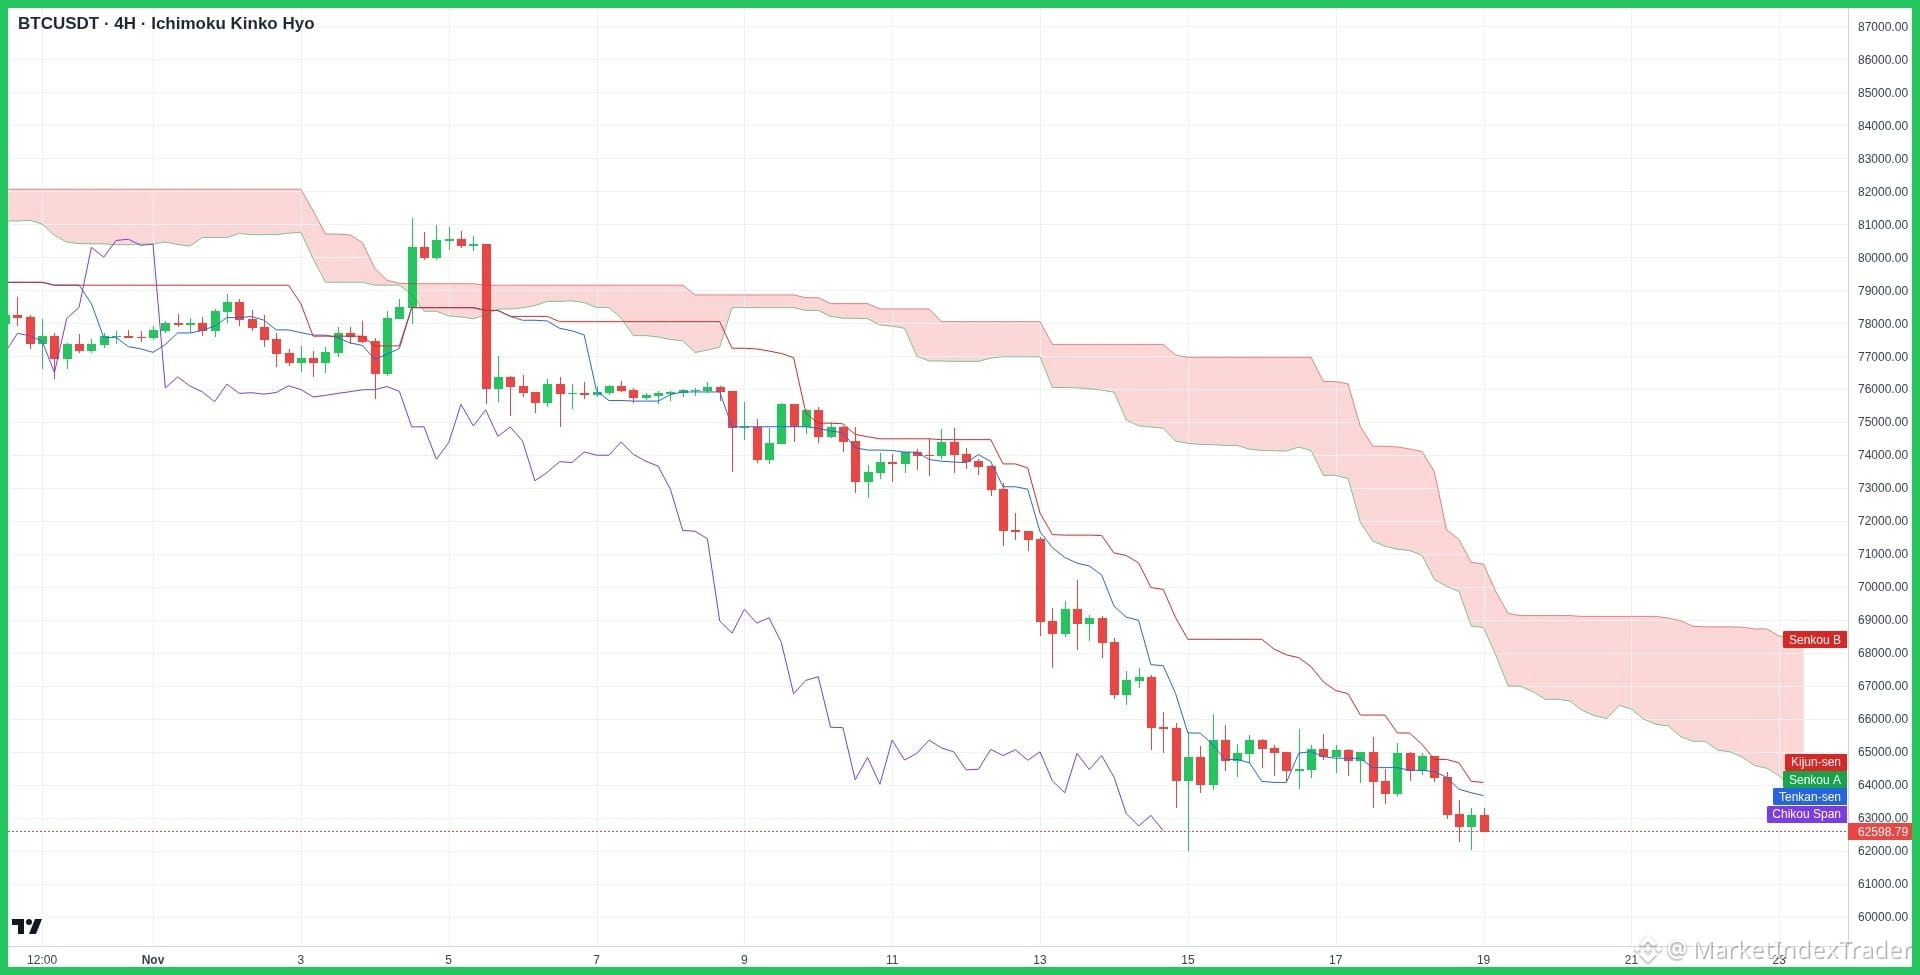
BTC/USDT's H4 chart shows price testing crucial support near $62,500 below the Ichimoku Cloud.
Alright team, let's break down this juicy $BTC chart and see what's cooking.
Looking at the 4-hour chart with Ichimoku Kinko Hyo, Bitcoin is currently facing strong bearish pressure, trading well below the Kumo cloud. Price has dipped down to test the immediate support zone around $62,500, while the major overhead resistance stands firmly near the $65,000 to $68,000 range. The Tenkan-sen and Kujun-sen lines remain bearishly aligned, but oversold conditions on lower timeframes suggest a potential relief bounce could be forming.
On the fundamental side, Bitcoin adoption continues to accelerate globally with major institutional inflows and expanding ETF volumes providing robust long-term backing. The macroeconomic backdrop is also showing increasing favorability for decentralized assets as global liquidity shifts.
My strategy here is to watch for a confirmed stabilization above $62,000 before scaling in, keeping risk managed tightly.
Highly recommend HOLD and Stacking $BTC at Binance
Feel free to comment the altcoin you are holding and we will check it for you!
BTC #TechnicalAnalysis #Crypto #BinanceSquare #Bitcoin
BTC/USDT's H4 chart shows price testing crucial support near $62,500 below the Ichimoku Cloud.
Alright team, let's break down this juicy $BTC chart and see what's cooking.
Looking at the 4-hour chart with Ichimoku Kinko Hyo, Bitcoin is currently facing strong bearish pressure, trading well below the Kumo cloud. Price has dipped down to test the immediate support zone around $62,500, while the major overhead resistance stands firmly near the $65,000 to $68,000 range. The Tenkan-sen and Kujun-sen lines remain bearishly aligned, but oversold conditions on lower timeframes suggest a potential relief bounce could be forming.
On the fundamental side, Bitcoin adoption continues to accelerate globally with major institutional inflows and expanding ETF volumes providing robust long-term backing. The macroeconomic backdrop is also showing increasing favorability for decentralized assets as global liquidity shifts.
My strategy here is to watch for a confirmed stabilization above $62,000 before scaling in, keeping risk managed tightly.
Highly recommend HOLD and Stacking $BTC at Binance
Feel free to comment the altcoin you are holding and we will check it for you!
BTC #TechnicalAnalysis #Crypto #BinanceSquare #Bitcoin