$XAUT: Beyond Narratives: Reading XAUT Volume Data
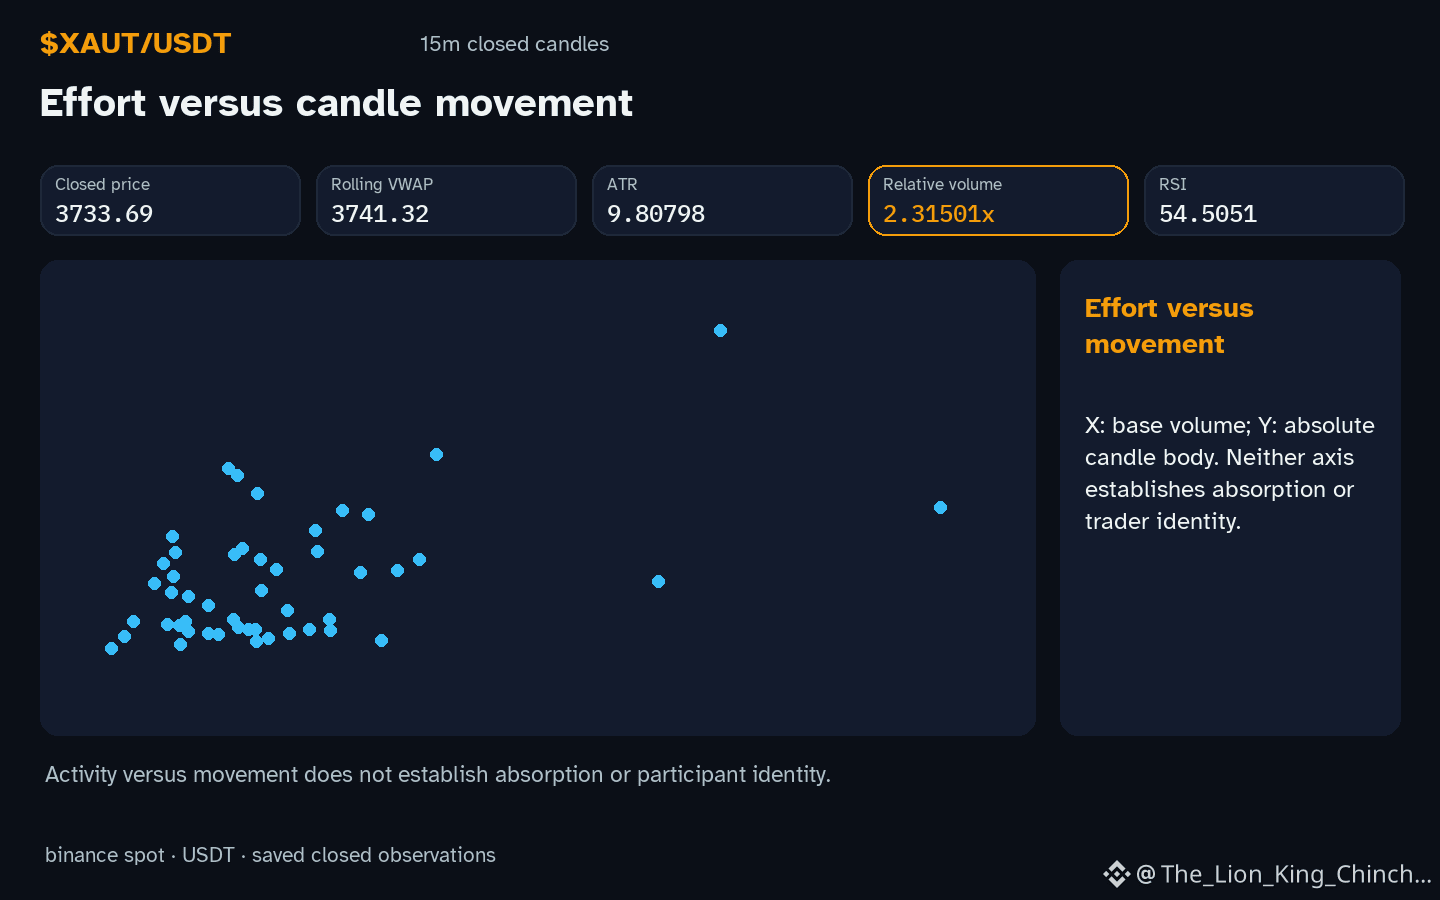
Does $XAUT show strength when volume rises, or are we just witnessing a standard liquidity event? Analysis often depends on whether we treat data as a story or a measurement. Recent data shows $XAUT moving up within its recorded range while relative volume sits at 2.32x its baseline.
Public crypto content often falls into the trap of anthropomorphizing price movements. Writers might describe a candle as a deliberate hunt or a trap set by invisible actors. However, candles do not have motives. They are simply aggregations of completed trades. The daily change of -1.25126% and an RSI of 54.5 describe what has happened, not why it happened or who was responsible. This is an important distinction when considering general incentives like Write to Earn. These systems encourage people to publish frequently, which can lead to over-explaining simple noise to satisfy a craving for certainty.
To separate evidence from persuasion, try this self-check. If a post describes an asset as being angry, manipulative, or exhausted, replace those words with their technical equivalents. If the logic falls apart without the human drama, the analysis may be more story than science. A future hourly close below the support of 3692.19 or a drop in relative volume would weaken the current upward interpretation, showing that previous activity lacked sustained participation. Data provides the bounds, while we provide the meaning.
Probabilistic market research, not a recommendation or guaranteed return.
#XAUT
Does $XAUT show strength when volume rises, or are we just witnessing a standard liquidity event? Analysis often depends on whether we treat data as a story or a measurement. Recent data shows $XAUT moving up within its recorded range while relative volume sits at 2.32x its baseline.
Public crypto content often falls into the trap of anthropomorphizing price movements. Writers might describe a candle as a deliberate hunt or a trap set by invisible actors. However, candles do not have motives. They are simply aggregations of completed trades. The daily change of -1.25126% and an RSI of 54.5 describe what has happened, not why it happened or who was responsible. This is an important distinction when considering general incentives like Write to Earn. These systems encourage people to publish frequently, which can lead to over-explaining simple noise to satisfy a craving for certainty.
To separate evidence from persuasion, try this self-check. If a post describes an asset as being angry, manipulative, or exhausted, replace those words with their technical equivalents. If the logic falls apart without the human drama, the analysis may be more story than science. A future hourly close below the support of 3692.19 or a drop in relative volume would weaken the current upward interpretation, showing that previous activity lacked sustained participation. Data provides the bounds, while we provide the meaning.
Probabilistic market research, not a recommendation or guaranteed return.
#XAUT