$BTC /USDT Market Update | Nov 19, 2026*
Price:* $63,453.17 (Rs 17,537,821.65) *-1.88%*
24H High:* $64,952.92
24H Low:* $62,062.97
24H Vol:* 19,078.66 BTC / 1.21B USDT
*Technical Analysis:*
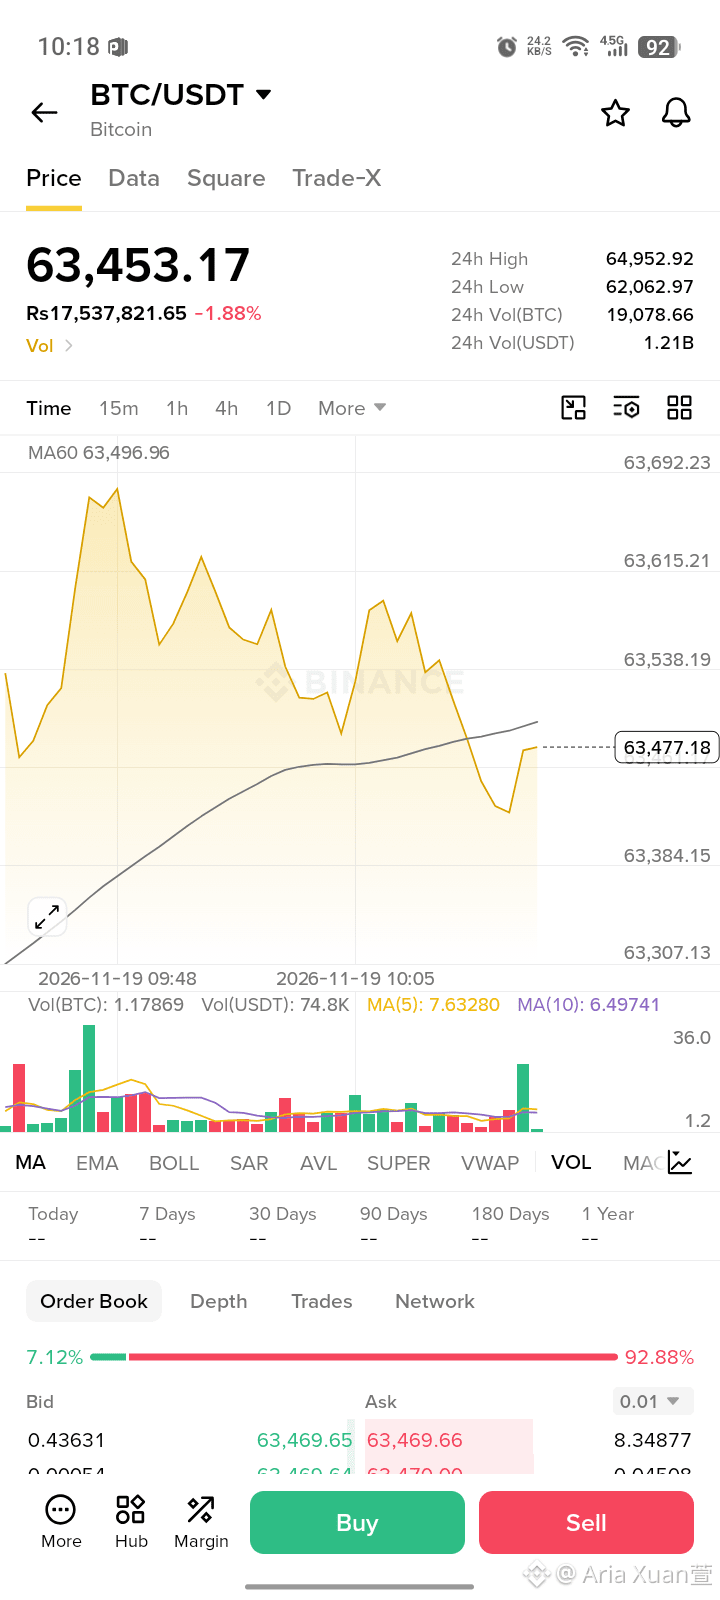
BTC is showing a clear intraday correction after testing the $64,952 high. On the chart, price made a strong top around 09:48 and then formed lower highs, dropping to near $63,300 before a bounce.
Key level is *MA60 at $63,496.96*. Price is currently at $63,477.18, trading just below MA60. MA60 is acting as dynamic resistance. Until we get a strong close above $63,496, the short-term pressure remains.
Volume indicator shows a fresh green volume spike at the bottom, which indicates buyers are stepping in at the low. The buy/sell ratio is 7.12% vs 92.88%, showing heavy selling dominance but a possible reversal attempt.
*Levels to Watch:*
Immediate Support: $63,384 / $63,307
Immediate Resistance: $63,496 (MA60) / $63,538 / $63,615
Break above MA60 with volume can target $63,600+. If it fails, retest of $63,384 likely.
NFA - For educational purpose only. #BTC #Bitcoin #Crypto
Price:* $63,453.17 (Rs 17,537,821.65) *-1.88%*
24H High:* $64,952.92
24H Low:* $62,062.97
24H Vol:* 19,078.66 BTC / 1.21B USDT
*Technical Analysis:*
BTC is showing a clear intraday correction after testing the $64,952 high. On the chart, price made a strong top around 09:48 and then formed lower highs, dropping to near $63,300 before a bounce.
Key level is *MA60 at $63,496.96*. Price is currently at $63,477.18, trading just below MA60. MA60 is acting as dynamic resistance. Until we get a strong close above $63,496, the short-term pressure remains.
Volume indicator shows a fresh green volume spike at the bottom, which indicates buyers are stepping in at the low. The buy/sell ratio is 7.12% vs 92.88%, showing heavy selling dominance but a possible reversal attempt.
*Levels to Watch:*
Immediate Support: $63,384 / $63,307
Immediate Resistance: $63,496 (MA60) / $63,538 / $63,615
Break above MA60 with volume can target $63,600+. If it fails, retest of $63,384 likely.
NFA - For educational purpose only. #BTC #Bitcoin #Crypto