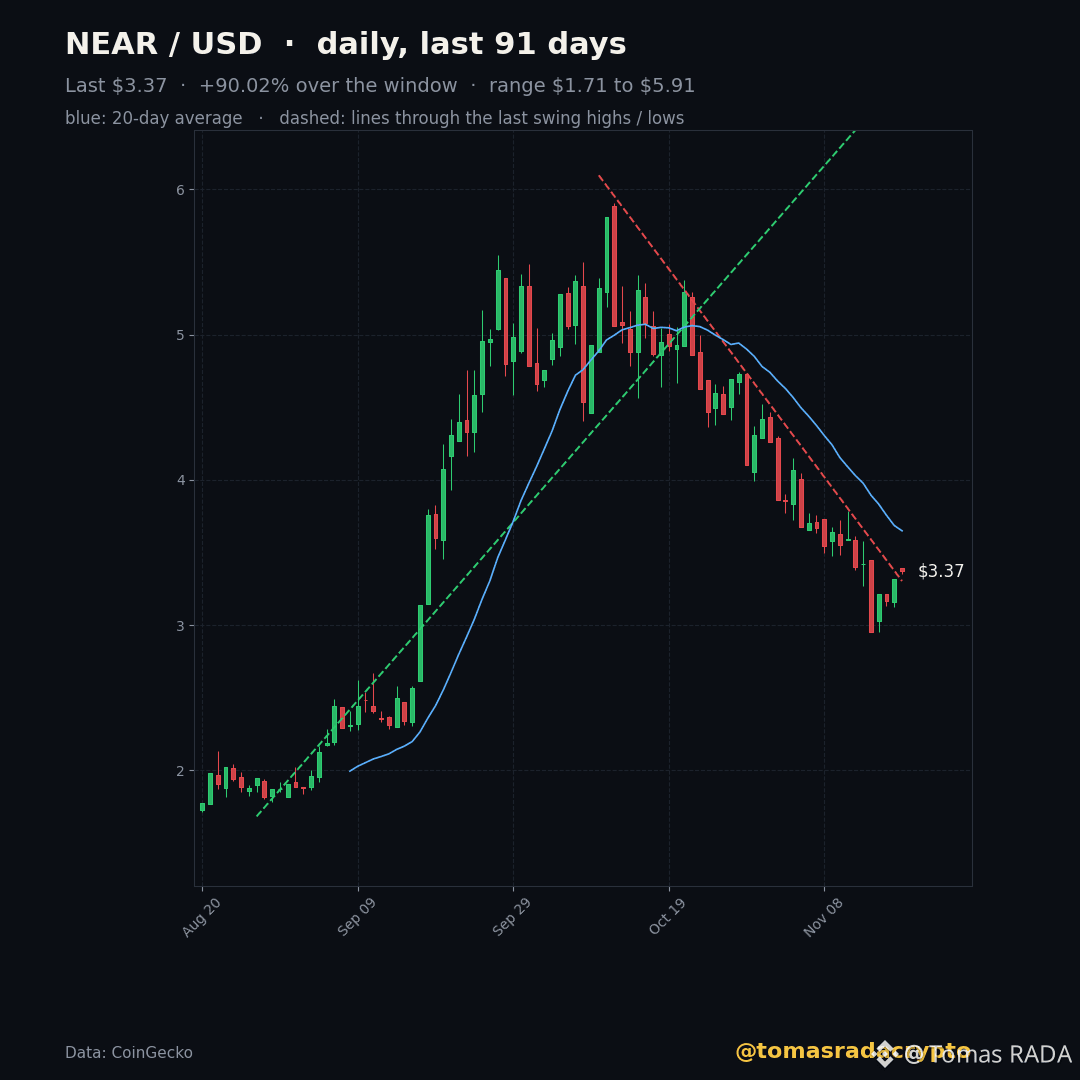
$NEAR is trading at 3.352 USDT, up 2.54% in the last 24 hours. Despite this daily bounce, the price stays below its 20-day moving average of 3.649. This gap shows that the short-term trend remains lower than the monthly average, even with a 79.1M USDT volume day. The 91-day chart shows a pattern of falling tops and rising bottoms, squeezing the price between a high of 5.908 and a low of 1.709. My read is that the current compression between these trend lines suggests the asset is losing volatility as it sits near the middle of its 3-month range. Are you waiting for a break above the 20-day average or are you trading the volatility within the current range?
#NEAR #TechnicalAnalysis
#NEAR #TechnicalAnalysis