🚨 BITCOIN WARNING: IS THE $40,000 LEVEL BACK IN PLAY?
₿ BTC/USD | 1D TIMEFRAME | BINANCE
The Bitcoin market is approaching a technically critical phase. The latest daily chart structure suggests that the recent recovery may have been a corrective move rather than the beginning of a sustainable bullish reversal.
This is a scenario worth watching closely.
🔴 1. HIGHER-TIMEFRAME MARKET STRUCTURE
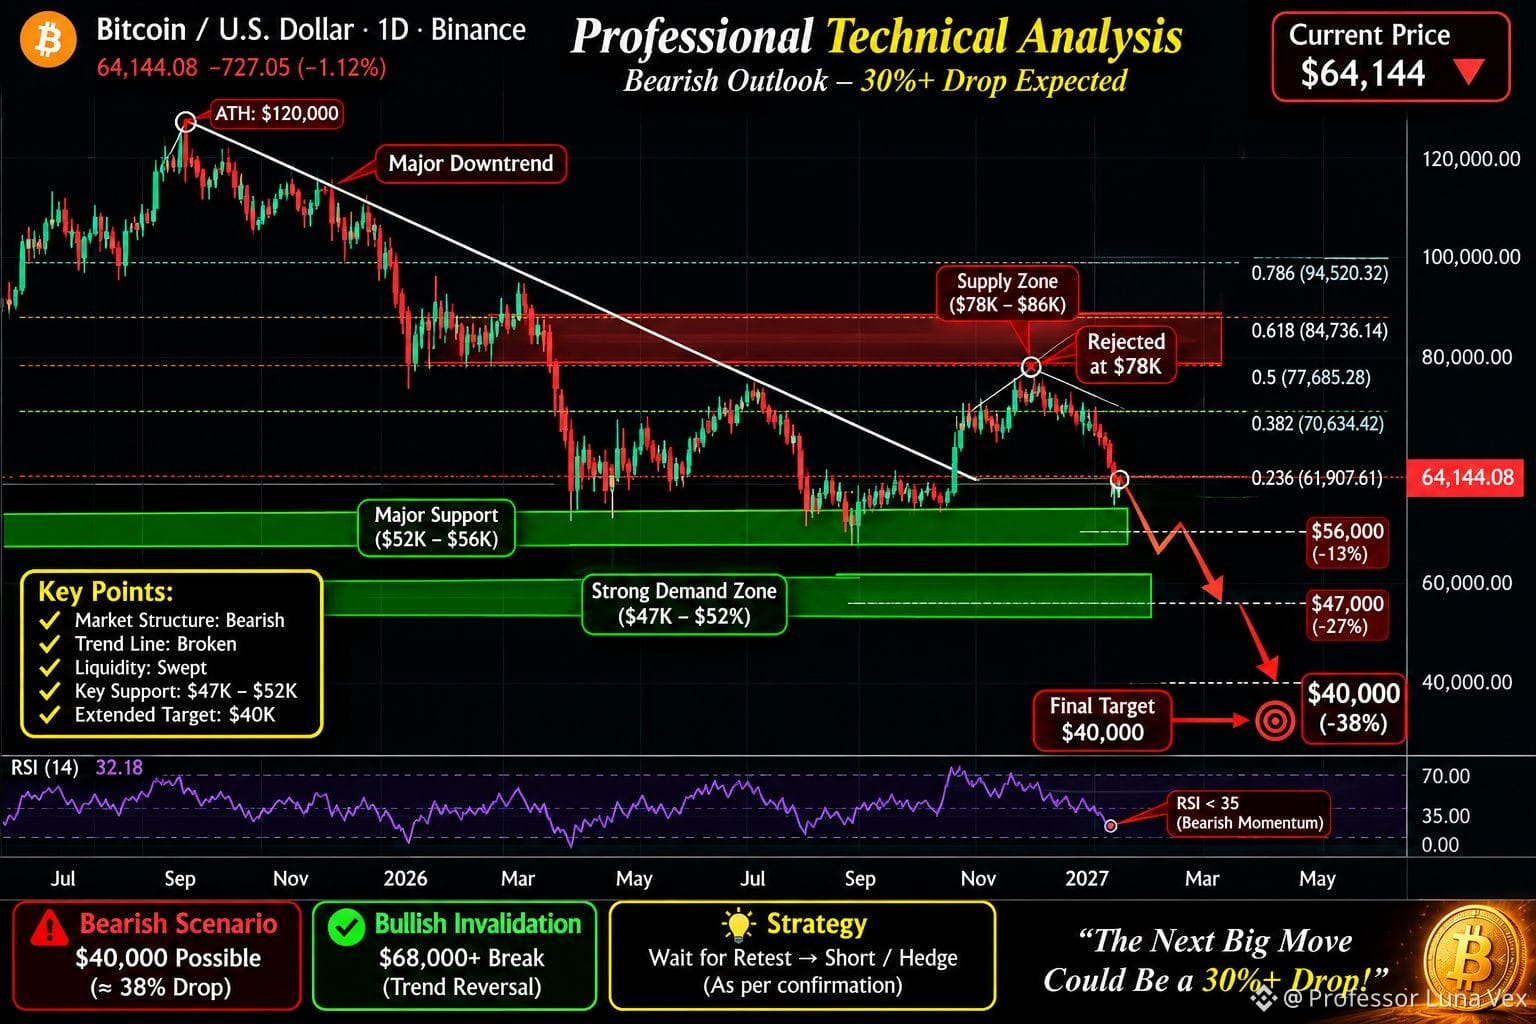
Bitcoin continues to show a broader bearish structure, with lower highs and significant rejection from the $78,000 supply region.
The inability to sustain momentum above this zone raises concerns about further downside expansion.
🔴 2. CRITICAL SUPPLY ZONE: $78K–$86K
This region represents a major overhead supply area.
A rejection from this zone strengthens the bearish case, particularly if subsequent rallies fail to establish higher highs.
🟢 3. THE SUPPORT LEVELS THAT MATTER
Key downside levels to monitor:
• $62K–$64K — Immediate support
• $52K–$56K — Major demand zone
• $47K–$52K — Critical structural support
• $40K — Extended downside target
A confirmed breakdown below the major demand regions could significantly increase the probability of a deeper correction.
📉 4. THE $40,000 SCENARIO
From the chart's reference price of approximately $64,144, a move toward $40,000 would represent a decline of approximately 37.6%.
However, this is a conditional bearish projection, NOT a confirmed destination.
The market would need to break multiple support levels before this scenario becomes technically stronger.
⚠️ 5. WHAT COULD INVALIDATE THIS OUTLOOK?
A sustained recovery above $68K, followed by a successful reclaim of higher resistance levels, would weaken the bearish thesis.
A decisive recovery toward $78K would require a complete reassessment of the current market structure.
🎯 FINAL MARKET ASSESSMENT
The most important question is not whether Bitcoin can reach $40K.
The real question is whether buyers can defend the $52K
#TechniquesOverEmotions #SmartMoney #MarketStructureb #LiquidityFarming #BitcoinPrediction
₿ BTC/USD | 1D TIMEFRAME | BINANCE
The Bitcoin market is approaching a technically critical phase. The latest daily chart structure suggests that the recent recovery may have been a corrective move rather than the beginning of a sustainable bullish reversal.
This is a scenario worth watching closely.
🔴 1. HIGHER-TIMEFRAME MARKET STRUCTURE
Bitcoin continues to show a broader bearish structure, with lower highs and significant rejection from the $78,000 supply region.
The inability to sustain momentum above this zone raises concerns about further downside expansion.
🔴 2. CRITICAL SUPPLY ZONE: $78K–$86K
This region represents a major overhead supply area.
A rejection from this zone strengthens the bearish case, particularly if subsequent rallies fail to establish higher highs.
🟢 3. THE SUPPORT LEVELS THAT MATTER
Key downside levels to monitor:
• $62K–$64K — Immediate support
• $52K–$56K — Major demand zone
• $47K–$52K — Critical structural support
• $40K — Extended downside target
A confirmed breakdown below the major demand regions could significantly increase the probability of a deeper correction.
📉 4. THE $40,000 SCENARIO
From the chart's reference price of approximately $64,144, a move toward $40,000 would represent a decline of approximately 37.6%.
However, this is a conditional bearish projection, NOT a confirmed destination.
The market would need to break multiple support levels before this scenario becomes technically stronger.
⚠️ 5. WHAT COULD INVALIDATE THIS OUTLOOK?
A sustained recovery above $68K, followed by a successful reclaim of higher resistance levels, would weaken the bearish thesis.
A decisive recovery toward $78K would require a complete reassessment of the current market structure.
🎯 FINAL MARKET ASSESSMENT
The most important question is not whether Bitcoin can reach $40K.
The real question is whether buyers can defend the $52K
#TechniquesOverEmotions #SmartMoney #MarketStructureb #LiquidityFarming #BitcoinPrediction