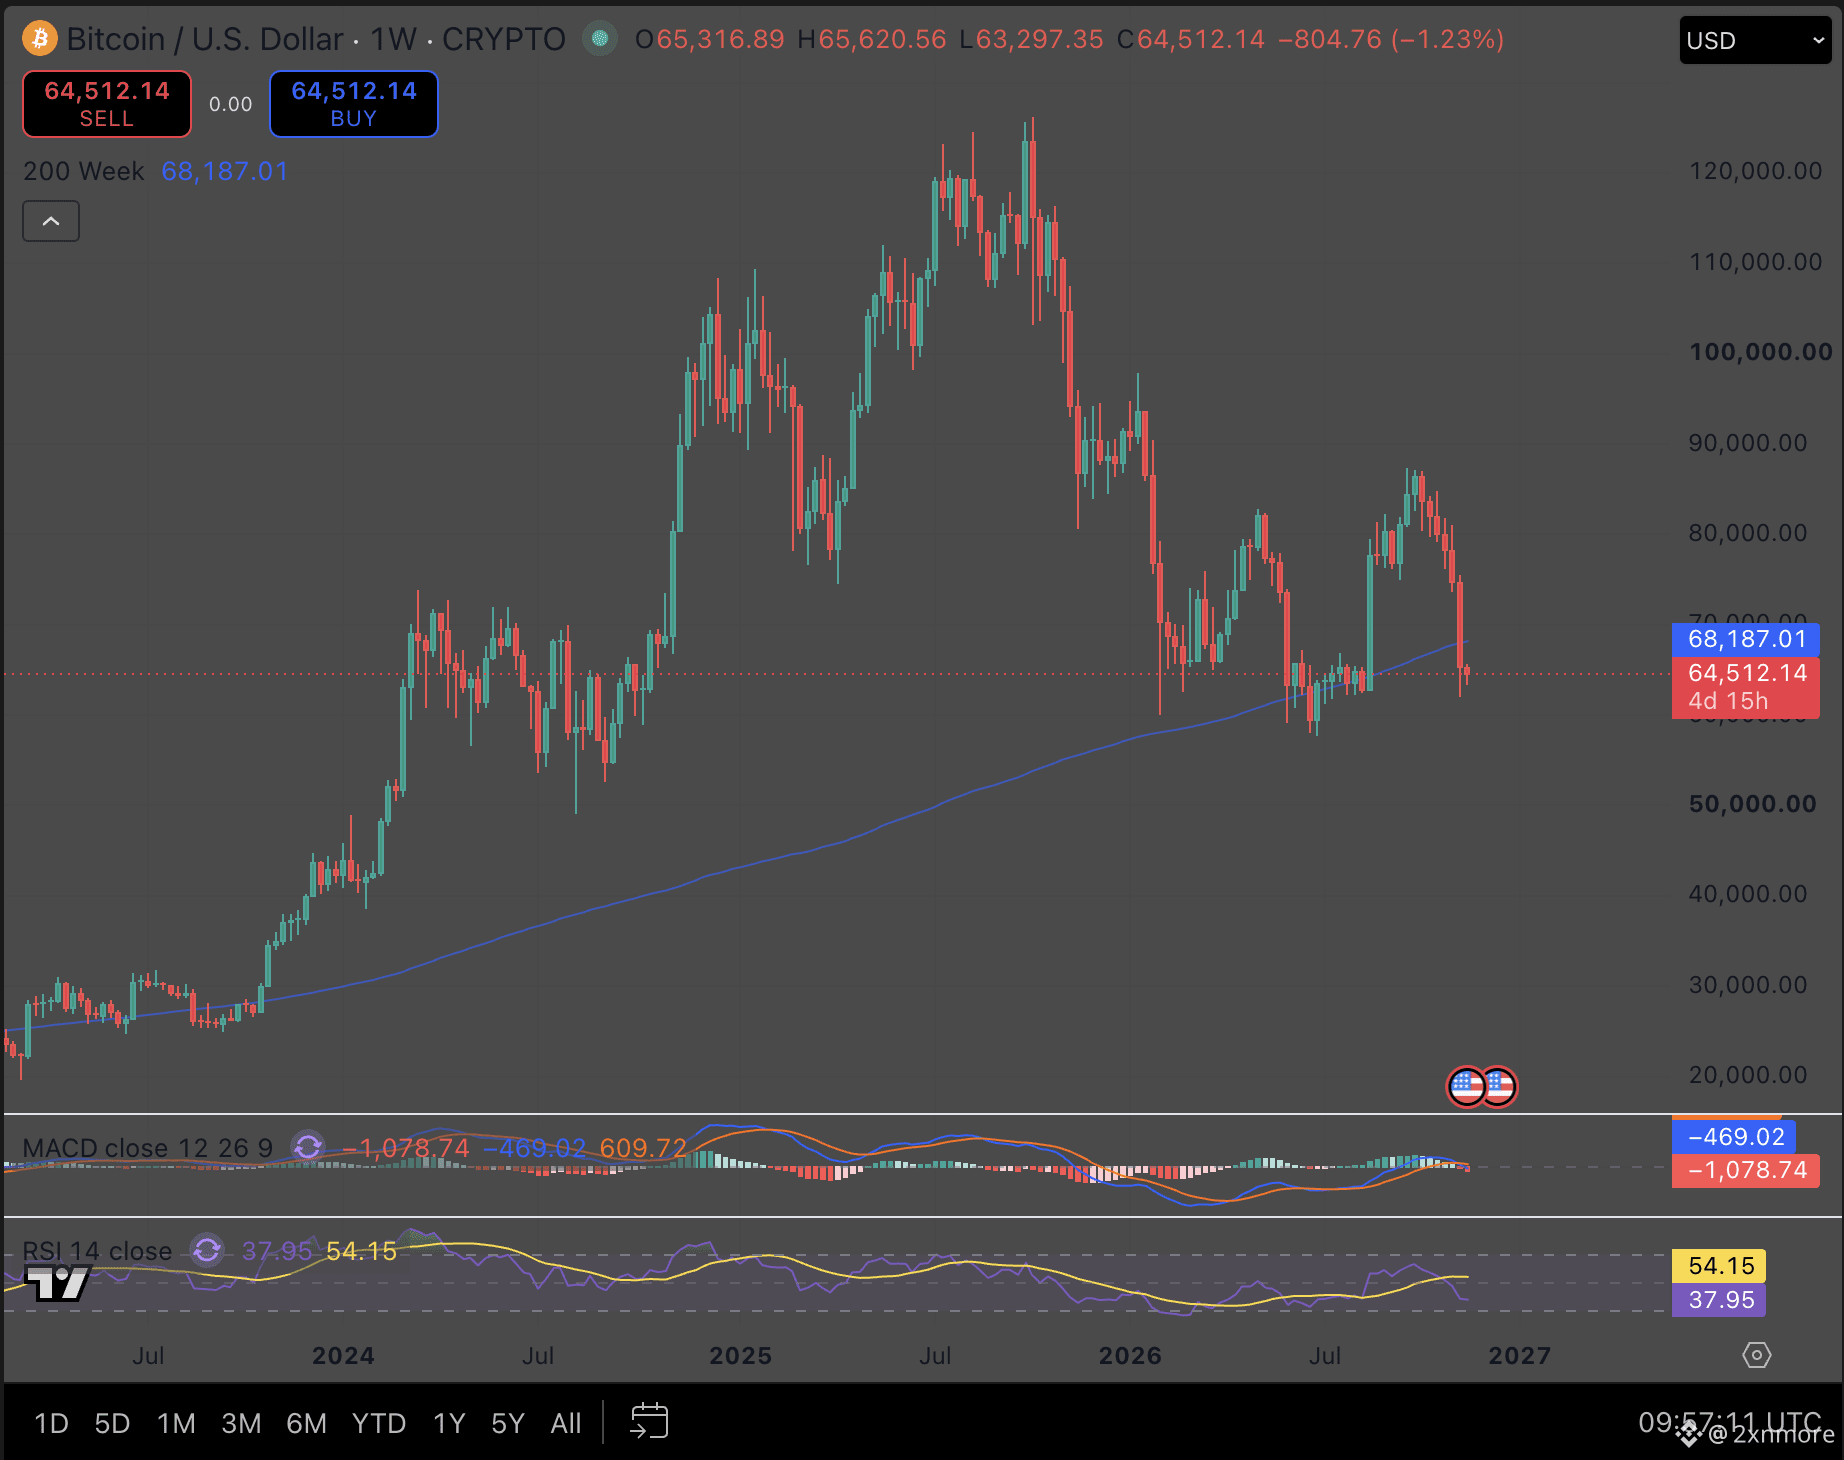
Bitcoin is down 49% from its all time high.
And for the second time this year, it is trading below the line that has defined the floor of this entire cycle.
When you zoom out, the weekly chart tells a story the daily chart cannot.
Where we are
Bitcoin topped near $126K in October 2025.
Today it trades at $64,512, below the 200 week moving average at $68,187.
The weekly candle closes in under five days. That close matters more than any move between now and then.
The structure since the top
Every major rally since the peak has failed lower: near $97K in January, near $83K in spring, near $87K in October.
The lows have held a range: near $60K in February and near $58K in June.
That leaves a market trapped between falling highs and a floor that has been tested twice.
What happened last time
In June, Bitcoin slipped below the 200 week average and spent weeks underneath it.
In August, it reclaimed the line, and that reclaim launched the rally to $87K.
So falling below this line is not new. What matters is how long it stays below.
What momentum says
Weekly RSI is near 38, well under its average line. It is weak, but not yet at the lows it printed in June.
Weekly MACD has crossed below its signal line, both sitting just under zero. On this timeframe, that cross often marks the start of a slower grind, not a quick bounce.
The levels that decide the next move
Reclaim: a weekly close back above $68,187 repeats the August playbook.
First support: the $58K to $60K zone, where the February and June lows sit.
Below that: the $49K to $50K area, the August 2024 low, with little support visible in between.
The two paths
Bull case: buyers defend $58K to $60K for a third time and Bitcoin closes a week back above $68,187. A triple tested floor under a reclaimed 200 week average is one of the strongest bases a market can build.
Bear case: a weekly close below $58K breaks the floor that has held all year.
That would open the path toward $50K, with little in between to slow it down.
And for the second time this year, it is trading below the line that has defined the floor of this entire cycle.
When you zoom out, the weekly chart tells a story the daily chart cannot.
Where we are
Bitcoin topped near $126K in October 2025.
Today it trades at $64,512, below the 200 week moving average at $68,187.
The weekly candle closes in under five days. That close matters more than any move between now and then.
The structure since the top
Every major rally since the peak has failed lower: near $97K in January, near $83K in spring, near $87K in October.
The lows have held a range: near $60K in February and near $58K in June.
That leaves a market trapped between falling highs and a floor that has been tested twice.
What happened last time
In June, Bitcoin slipped below the 200 week average and spent weeks underneath it.
In August, it reclaimed the line, and that reclaim launched the rally to $87K.
So falling below this line is not new. What matters is how long it stays below.
What momentum says
Weekly RSI is near 38, well under its average line. It is weak, but not yet at the lows it printed in June.
Weekly MACD has crossed below its signal line, both sitting just under zero. On this timeframe, that cross often marks the start of a slower grind, not a quick bounce.
The levels that decide the next move
Reclaim: a weekly close back above $68,187 repeats the August playbook.
First support: the $58K to $60K zone, where the February and June lows sit.
Below that: the $49K to $50K area, the August 2024 low, with little support visible in between.
The two paths
Bull case: buyers defend $58K to $60K for a third time and Bitcoin closes a week back above $68,187. A triple tested floor under a reclaimed 200 week average is one of the strongest bases a market can build.
Bear case: a weekly close below $58K breaks the floor that has held all year.
That would open the path toward $50K, with little in between to slow it down.