Imagine a coin that dropped hard for weeks, then suddenly starts stitching together green candles like it’s repairing something. That’s $SOL right now.
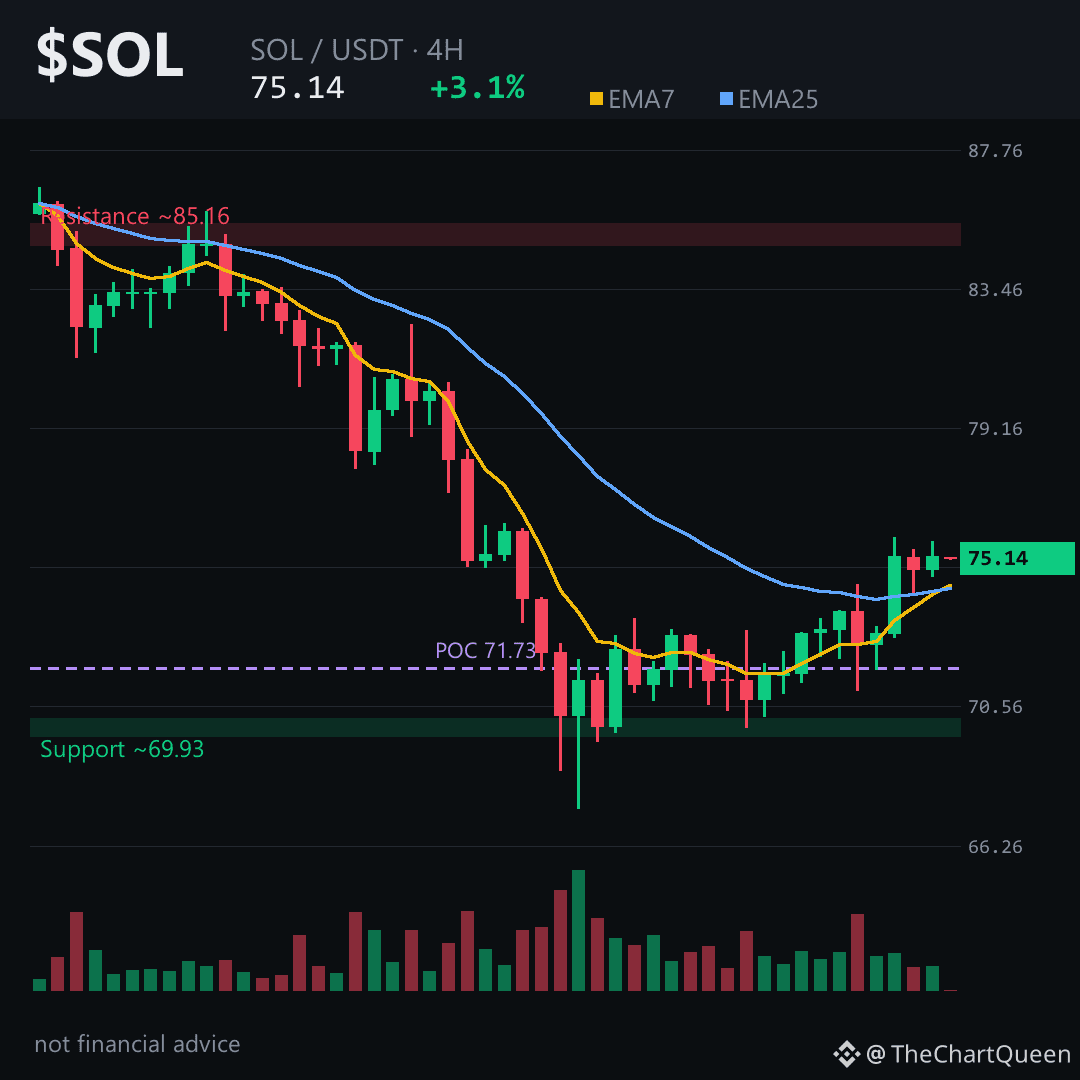
The 4-hour chart is the only timeframe that matters today. Price has climbed from the low 70s and is hovering around 74.7 — right at a Fibonacci shelf acting like a springboard. Short-term moving averages are flattening and starting to curl upward, a sign momentum is shifting before the bigger picture agrees.
Here’s what makes this interesting: funding is negative, yet the long/short ratio is heavily skewed long. Conviction longs are holding while shorts get paid. When that unwinds, it can fuel a sharp move.
The level I’m watching is the 74 zone on the 4-hour chart. If $SOL holds around 74 and pushes through 79, the path toward the low 80s opens up — that’s where the next real supply sits. Lose the 71 area on a 4-hour close, though, and this little recovery story falls apart.
My read: the short-term picture is quietly bullish, but fragile. The daily chart is still deeply oversold, meaning bounces can be violent — in both directions. Tap $SOL to pull up the chart and see how price reacts to that 74 shelf.
I’ll be watching whether the 71 floor holds if this gets tested again — follow along if you want the update when it does.
What’s the one level on SOL you’re trusting right now? 👇
⚠️ Not financial advice. DYOR.
#SOL #Solana #Crypto #BinanceSquare
The 4-hour chart is the only timeframe that matters today. Price has climbed from the low 70s and is hovering around 74.7 — right at a Fibonacci shelf acting like a springboard. Short-term moving averages are flattening and starting to curl upward, a sign momentum is shifting before the bigger picture agrees.
Here’s what makes this interesting: funding is negative, yet the long/short ratio is heavily skewed long. Conviction longs are holding while shorts get paid. When that unwinds, it can fuel a sharp move.
The level I’m watching is the 74 zone on the 4-hour chart. If $SOL holds around 74 and pushes through 79, the path toward the low 80s opens up — that’s where the next real supply sits. Lose the 71 area on a 4-hour close, though, and this little recovery story falls apart.
My read: the short-term picture is quietly bullish, but fragile. The daily chart is still deeply oversold, meaning bounces can be violent — in both directions. Tap $SOL to pull up the chart and see how price reacts to that 74 shelf.
I’ll be watching whether the 71 floor holds if this gets tested again — follow along if you want the update when it does.
What’s the one level on SOL you’re trusting right now? 👇
⚠️ Not financial advice. DYOR.
#SOL #Solana #Crypto #BinanceSquare