⚡ Market Titans Dual Analysis: Bitcoin $BTC vs Ethereum $ETH
1. Bitcoin $BTC Technical Outlook
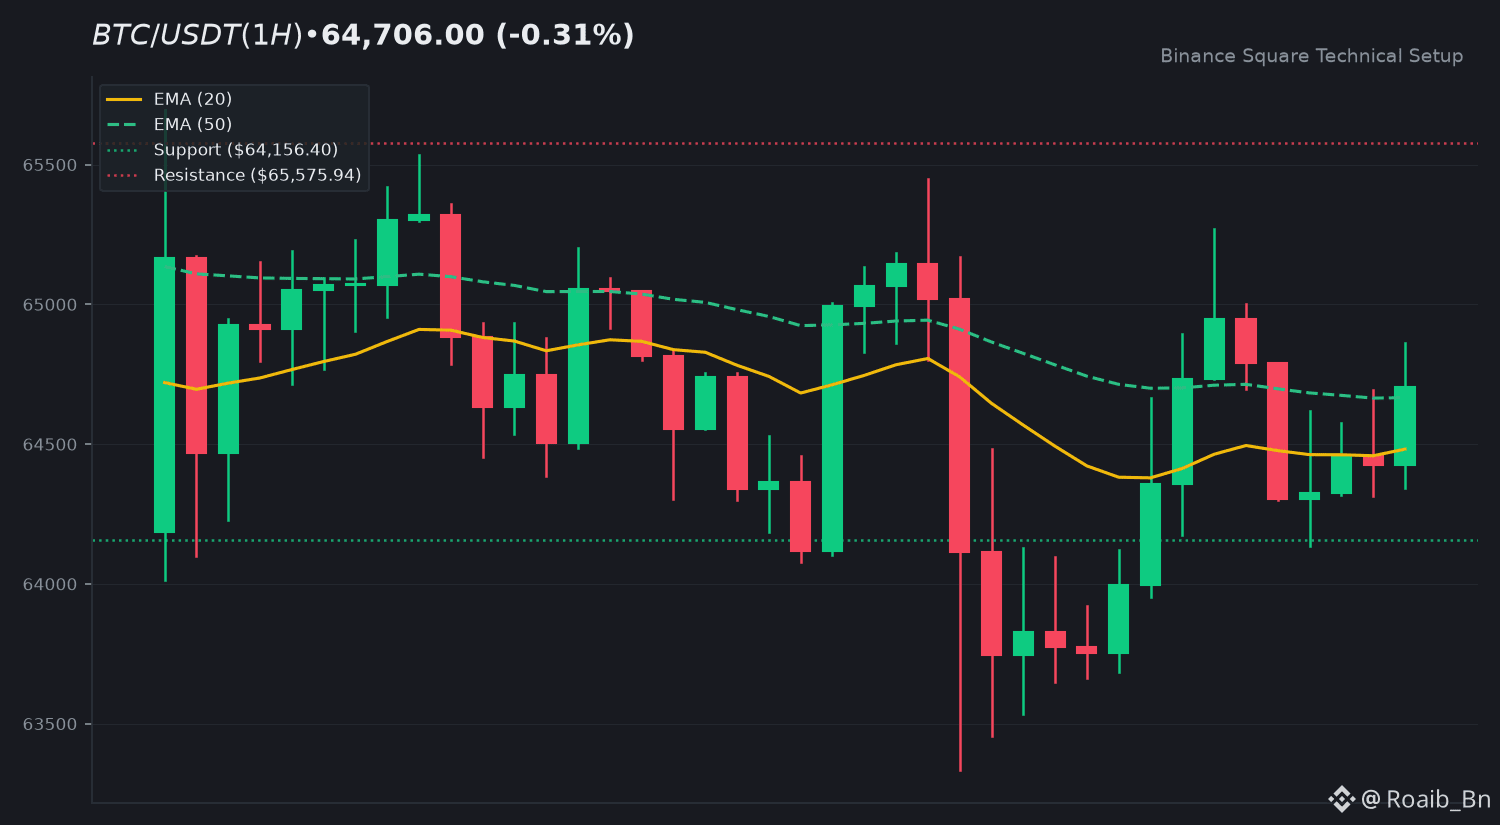
The leading asset is currently priced at 64,706.00, reflecting a minor pullback of 0.31%. Price action remains constructive as it hovers above the EMA 20 at 64,482.00 and the EMA 50 at 64,666.22. With an RSI of 53.16, the momentum is neutral but leaning toward a recovery phase. The MACD histogram at 48.1887 suggests building buying pressure. Key support floors are established at 64,156.40 and 62,006.00, while resistance hurdles sit at 65,575.94 and 67,523.05.
2. Ethereum $ETH Technical Outlook
Ethereum $ETH trades at $1,812.99, down 1.30%. The price is currently caught between the EMA 20 at $1,808.66 and the EMA 50 at $1,814.37, indicating a period of consolidation. The RSI at 51.51 confirms the lack of strong directional bias. Support levels to monitor are $1,790.48 and $1,711.08, while resistance ceilings are located at $1,842.42 and $1,919.76.
3. Macro Confluence & Market Structure
Bitcoin $BTC shows stronger structural health by maintaining its position above key EMAs compared to Ethereum $ETH , which is currently testing its EMA 50 as resistance. The divergence in MACD histograms indicates that capital flow is currently favoring the primary asset. Market participants should watch for a decisive break above the EMA 50 for $ETH to regain relative strength.
4. Community Discussion
Which asset do you expect to lead momentum this week: $BTC or $ETH? Share below! 👇
⚠️ Educational analysis only. Not financial advice (NFA). DYOR.
$BTC $ETH #BinanceSquare #CryptoMarket
1. Bitcoin $BTC Technical Outlook
The leading asset is currently priced at 64,706.00, reflecting a minor pullback of 0.31%. Price action remains constructive as it hovers above the EMA 20 at 64,482.00 and the EMA 50 at 64,666.22. With an RSI of 53.16, the momentum is neutral but leaning toward a recovery phase. The MACD histogram at 48.1887 suggests building buying pressure. Key support floors are established at 64,156.40 and 62,006.00, while resistance hurdles sit at 65,575.94 and 67,523.05.
2. Ethereum $ETH Technical Outlook
Ethereum $ETH trades at $1,812.99, down 1.30%. The price is currently caught between the EMA 20 at $1,808.66 and the EMA 50 at $1,814.37, indicating a period of consolidation. The RSI at 51.51 confirms the lack of strong directional bias. Support levels to monitor are $1,790.48 and $1,711.08, while resistance ceilings are located at $1,842.42 and $1,919.76.
3. Macro Confluence & Market Structure
Bitcoin $BTC shows stronger structural health by maintaining its position above key EMAs compared to Ethereum $ETH , which is currently testing its EMA 50 as resistance. The divergence in MACD histograms indicates that capital flow is currently favoring the primary asset. Market participants should watch for a decisive break above the EMA 50 for $ETH to regain relative strength.
4. Community Discussion
Which asset do you expect to lead momentum this week: $BTC or $ETH? Share below! 👇
⚠️ Educational analysis only. Not financial advice (NFA). DYOR.
$BTC $ETH #BinanceSquare #CryptoMarket