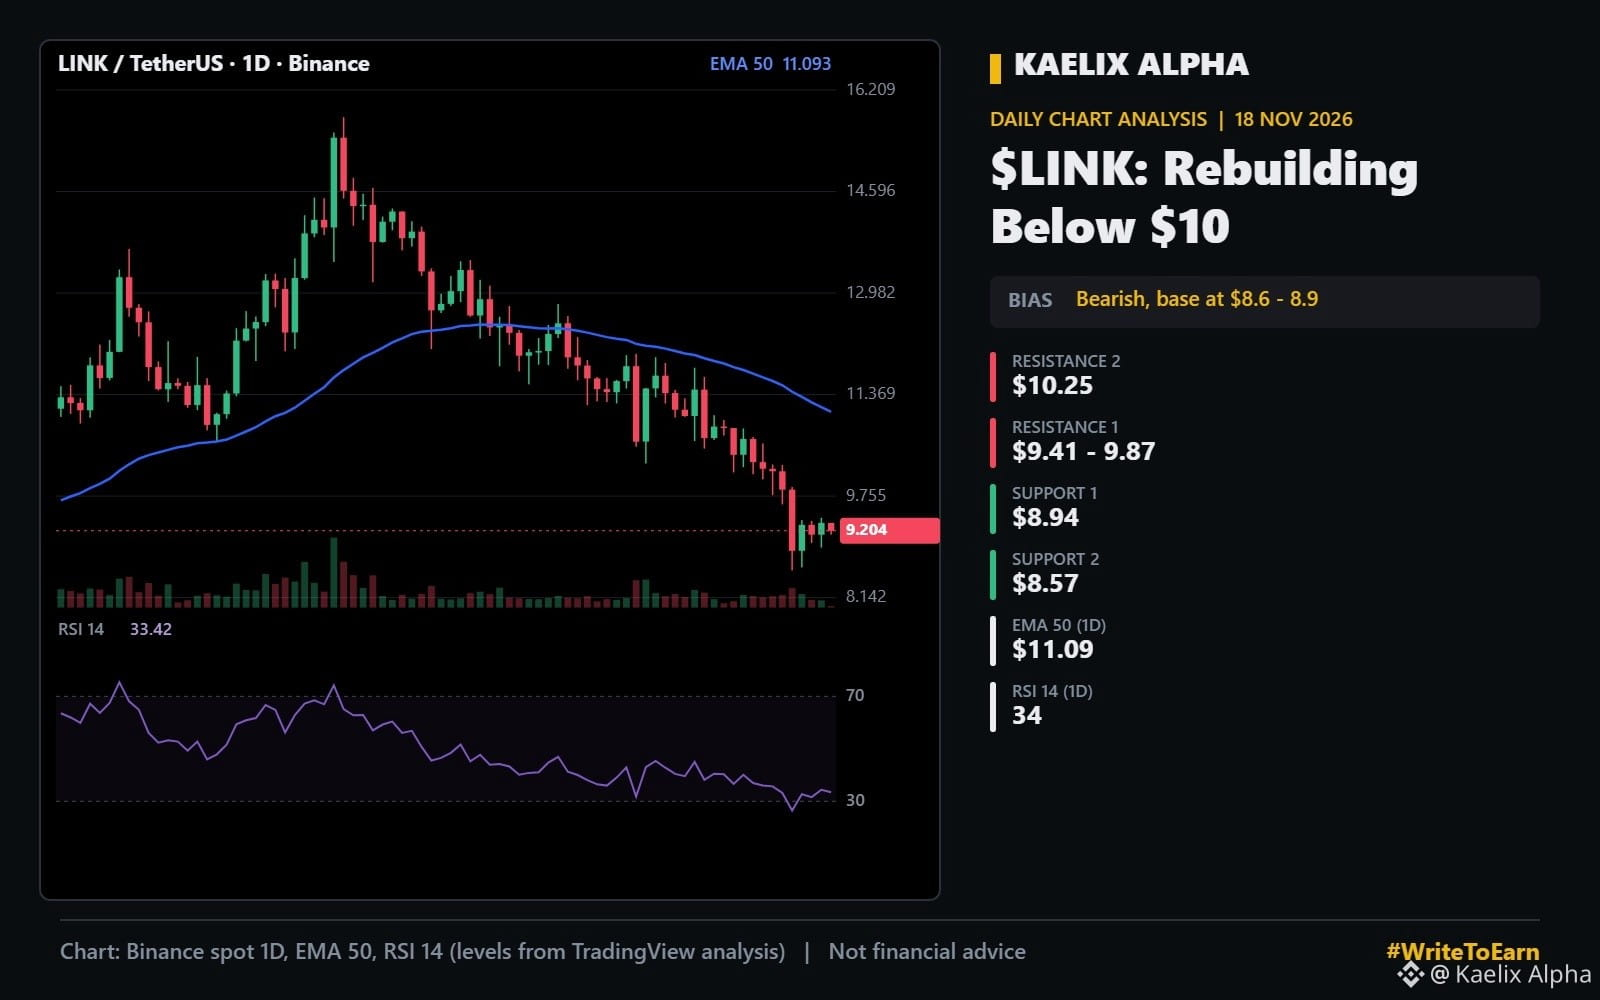

$LINK 𝗨𝗡𝗗𝗘𝗥 $10. 𝗛𝗘𝗥𝗘 𝗔𝗥𝗘 𝗠𝗬 𝗟𝗘𝗩𝗘𝗟𝗦 𝗙𝗢𝗥 𝗧𝗛𝗘 𝗡𝗘𝗫𝗧 𝗠𝗢𝗩𝗘.
Chainlink is down 23% in 30 days and trading below every major moving average. TradingView breakdown:
𝗧𝗵𝗲 𝘀𝘁𝗿𝘂𝗰𝘁𝘂𝗿𝗲
LINK topped near $15.78 in late September and has made lower highs ever since. It lost the 200-day EMA (about $10.63) and dropped to $8.57 this week before buyers stepped in.
𝗧𝗵𝗲 𝗺𝗼𝗺𝗲𝗻𝘁𝘂𝗺
Daily RSI is at 34, recovering from oversold. Still below its moving average, so the trend has not turned.
𝗞𝗲𝘆 𝗹𝗲𝘃𝗲𝗹𝘀
Resistance: $9.41, then $9.87, then $10.25 (20-day EMA)
Support: $8.94, then $8.57
Trend lines: 50-day EMA $11.09, 200-day EMA $10.63
𝗠𝘆 𝗽𝗹𝗮𝗻
I want to see a daily close back above $10.25 before calling this a recovery. Below $8.57, there is little support until the low $8s.
Long-term holders, are you adding LINK at these levels?
#WriteToEarn #Write2Earn #LINK #Chainlink #TechnicalAnalysis
Not financial advice. Do your own research.
Chainlink is down 23% in 30 days and trading below every major moving average. TradingView breakdown:
𝗧𝗵𝗲 𝘀𝘁𝗿𝘂𝗰𝘁𝘂𝗿𝗲
LINK topped near $15.78 in late September and has made lower highs ever since. It lost the 200-day EMA (about $10.63) and dropped to $8.57 this week before buyers stepped in.
𝗧𝗵𝗲 𝗺𝗼𝗺𝗲𝗻𝘁𝘂𝗺
Daily RSI is at 34, recovering from oversold. Still below its moving average, so the trend has not turned.
𝗞𝗲𝘆 𝗹𝗲𝘃𝗲𝗹𝘀
Resistance: $9.41, then $9.87, then $10.25 (20-day EMA)
Support: $8.94, then $8.57
Trend lines: 50-day EMA $11.09, 200-day EMA $10.63
𝗠𝘆 𝗽𝗹𝗮𝗻
I want to see a daily close back above $10.25 before calling this a recovery. Below $8.57, there is little support until the low $8s.
Long-term holders, are you adding LINK at these levels?
#WriteToEarn #Write2Earn #LINK #Chainlink #TechnicalAnalysis
Not financial advice. Do your own research.