
$SOL 𝗜𝗦 𝗧𝗛𝗘 𝗙𝗜𝗥𝗦𝗧 𝗠𝗔𝗝𝗢𝗥 𝗧𝗢 𝗙𝗟𝗔𝗦𝗛 𝗔 𝗥𝗘𝗩𝗘𝗥𝗦𝗔𝗟 𝗦𝗜𝗚𝗡𝗔𝗟
Out of all the large caps, Solana's chart looks the most interesting today.
𝗪𝗵𝗮𝘁 𝘁𝗵𝗲 𝗧𝗿𝗮𝗱𝗶𝗻𝗴𝗩𝗶𝗲𝘄 𝗰𝗵𝗮𝗿𝘁 𝘀𝗵𝗼𝘄𝘀
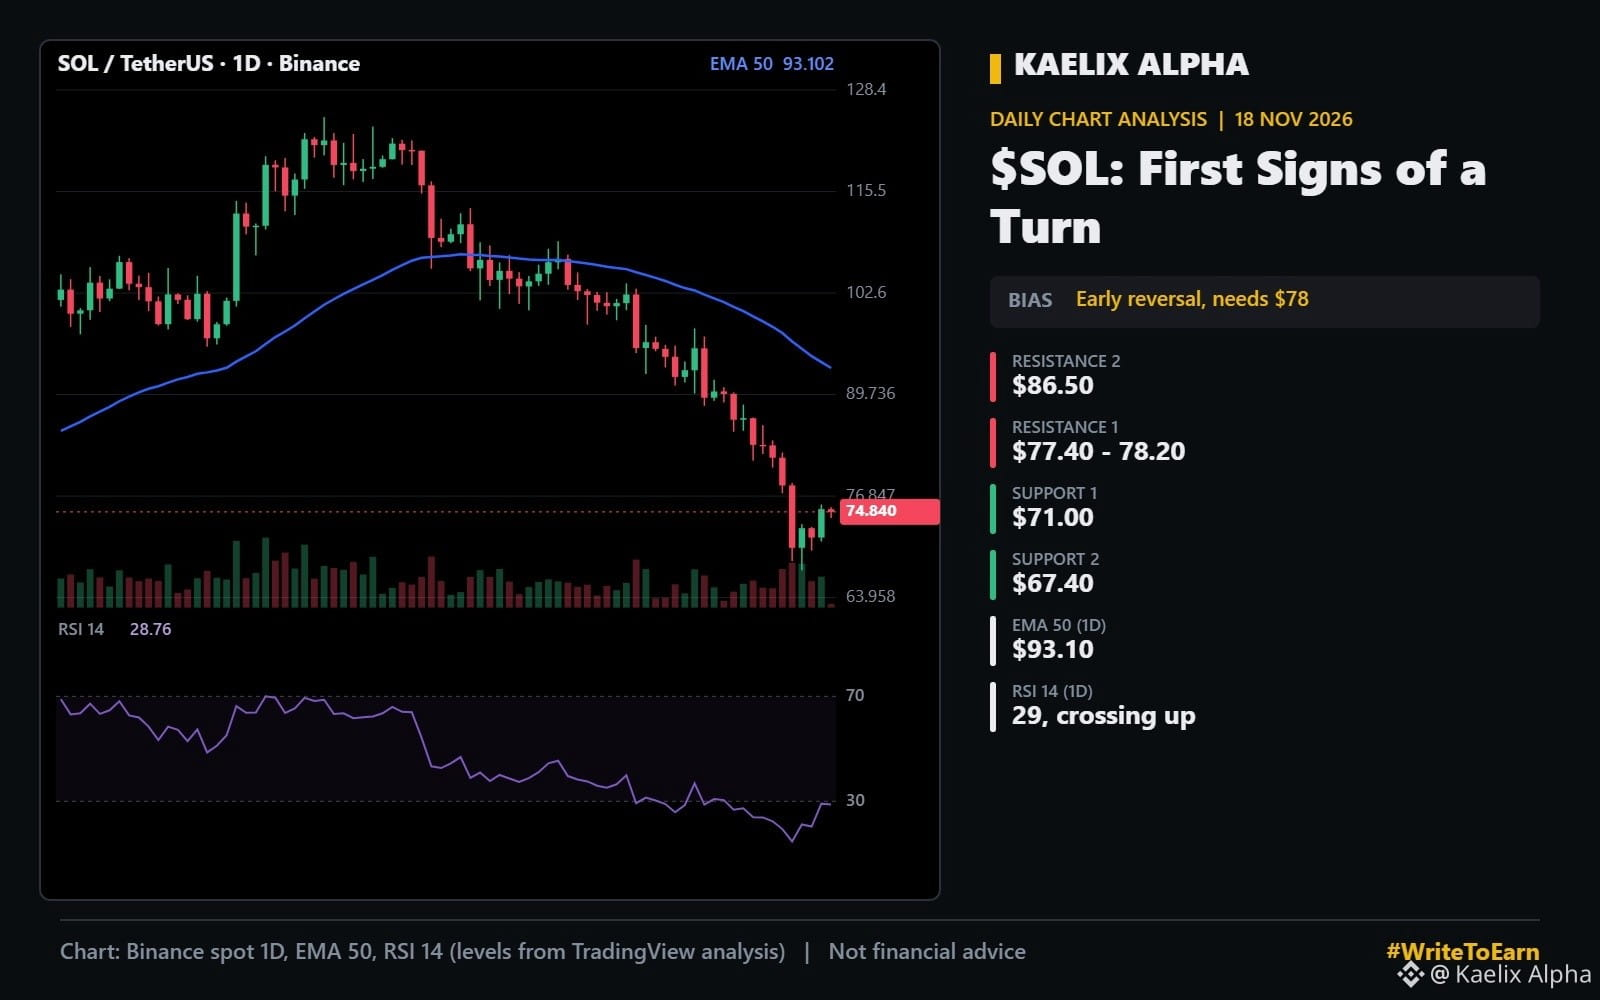
SOL wicked down to $67.41 and buyers stepped in hard. The last candles printed higher lows, and the daily RSI crossed above its moving average (28.7 vs 24.8). That is usually the first momentum shift after a sell-off.
On the 4 hour chart RSI is already back above 50.
𝗞𝗲𝘆 𝗹𝗲𝘃𝗲𝗹𝘀
Resistance: $77.40 to $78.20 (4H 50 EMA and breakdown level), then $86.50
Support: $71.00, then $67.40
Big trend line: daily 50 EMA near $93
𝗧𝗵𝗲 𝘁𝗿𝗮𝗱𝗲 𝗹𝗼𝗴𝗶𝗰
Bullish trigger: a 4H close above $78.20 confirms the higher low and targets $86.50.
Invalidation: losing $67.40 cancels the reversal idea completely.
Still bearish on the higher timeframe, but this is how bottoms start.
Is SOL leading the next bounce? Yes or no?
#WriteToEarn #Write2Earn #SOL #Solana #TechnicalAnalysis
Not financial advice. Do your own research.
Out of all the large caps, Solana's chart looks the most interesting today.
𝗪𝗵𝗮𝘁 𝘁𝗵𝗲 𝗧𝗿𝗮𝗱𝗶𝗻𝗴𝗩𝗶𝗲𝘄 𝗰𝗵𝗮𝗿𝘁 𝘀𝗵𝗼𝘄𝘀
SOL wicked down to $67.41 and buyers stepped in hard. The last candles printed higher lows, and the daily RSI crossed above its moving average (28.7 vs 24.8). That is usually the first momentum shift after a sell-off.
On the 4 hour chart RSI is already back above 50.
𝗞𝗲𝘆 𝗹𝗲𝘃𝗲𝗹𝘀
Resistance: $77.40 to $78.20 (4H 50 EMA and breakdown level), then $86.50
Support: $71.00, then $67.40
Big trend line: daily 50 EMA near $93
𝗧𝗵𝗲 𝘁𝗿𝗮𝗱𝗲 𝗹𝗼𝗴𝗶𝗰
Bullish trigger: a 4H close above $78.20 confirms the higher low and targets $86.50.
Invalidation: losing $67.40 cancels the reversal idea completely.
Still bearish on the higher timeframe, but this is how bottoms start.
Is SOL leading the next bounce? Yes or no?
#WriteToEarn #Write2Earn #SOL #Solana #TechnicalAnalysis
Not financial advice. Do your own research.