

NEAR Protocol is showing a recovery, but is the latest move strong enough to push through the next resistance? The four-timeframe chart reveals an interesting battle between short-term buyers and higher-timeframe resistance.
Let's break down the key levels and moving averages.
📊 15-Minute Chart: Short-Term Momentum
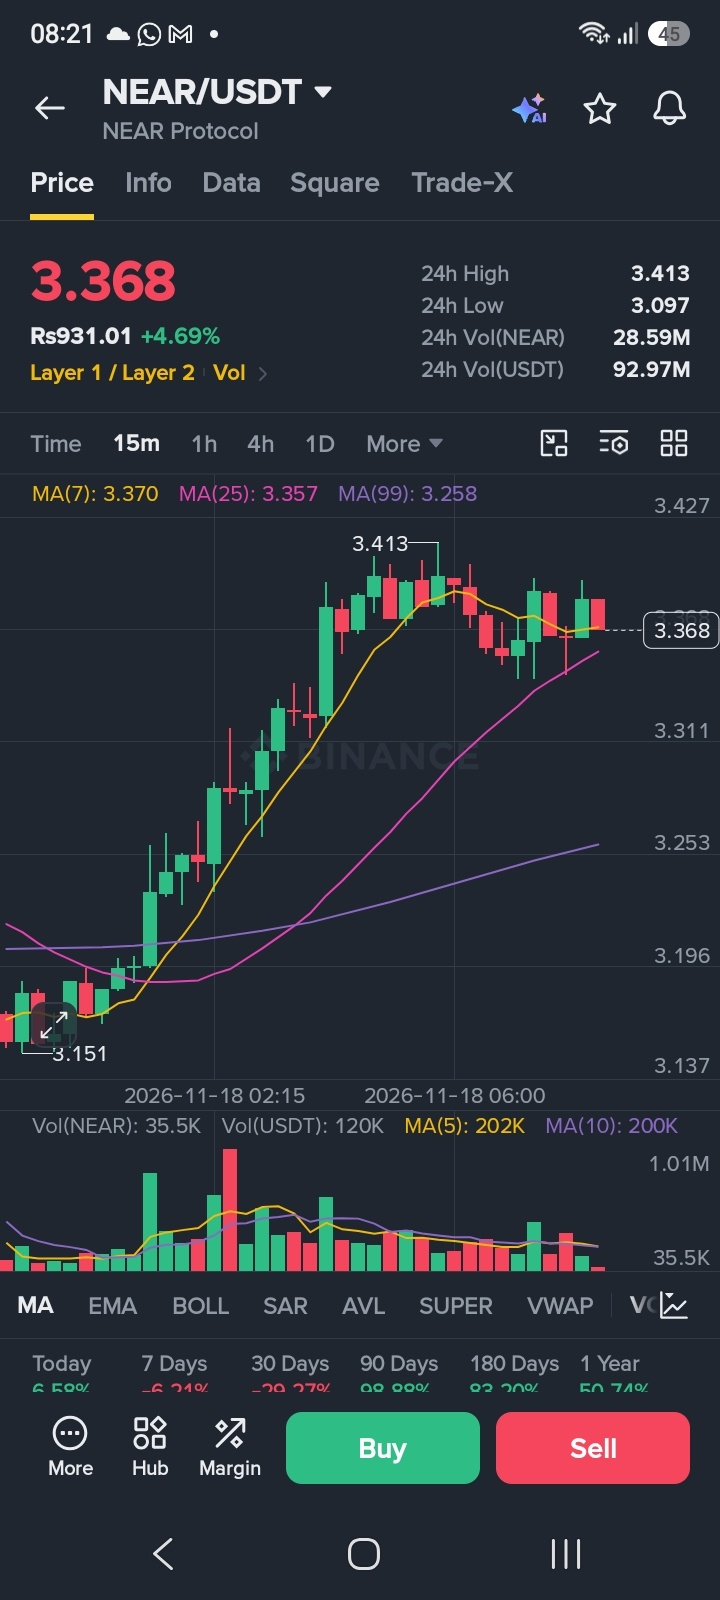
MA(7): $3.715
MA(25): $3.745
MA(99): $3.664
Candle Volume: 70.3K
Volume MA(5): 138K
Volume MA(10): 104K
Price is slightly above MA(7) and MA(99), but remains below MA(25). This suggests short-term recovery, although buying volume is still below both volume averages.
📊 1-Hour Chart: Buyers Have an Advantage
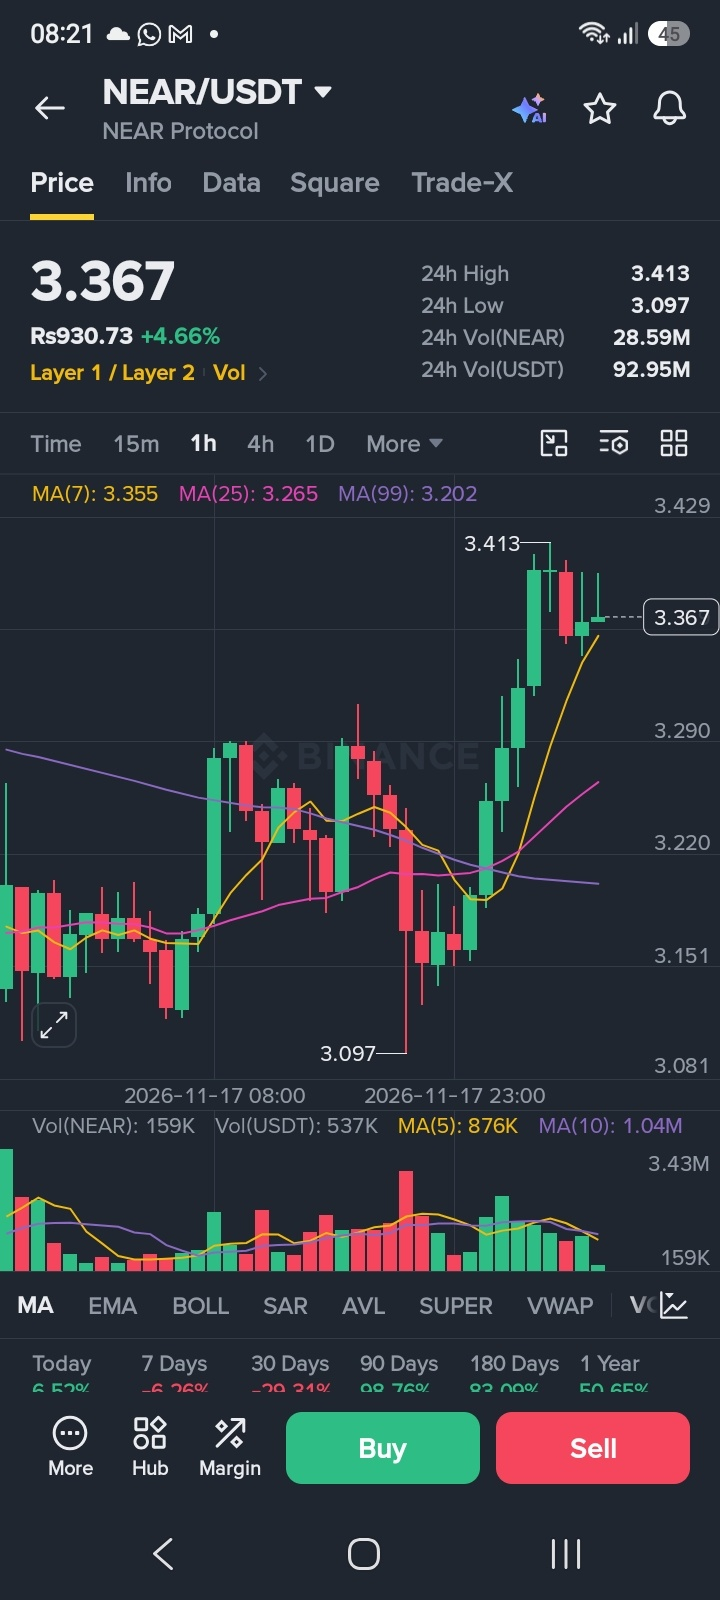
MA(7): $3.748
MA(25): $3.668
MA(99): $3.637
Candle Volume: 542K
Volume MA(5): 716K
Volume MA(10): 1.17M
Price is below MA(7), but remains above MA(25) and MA(99). The structure is mixed, and volume has not yet confirmed a strong breakout.
📊 4-Hour Chart: Major Resistance Ahead
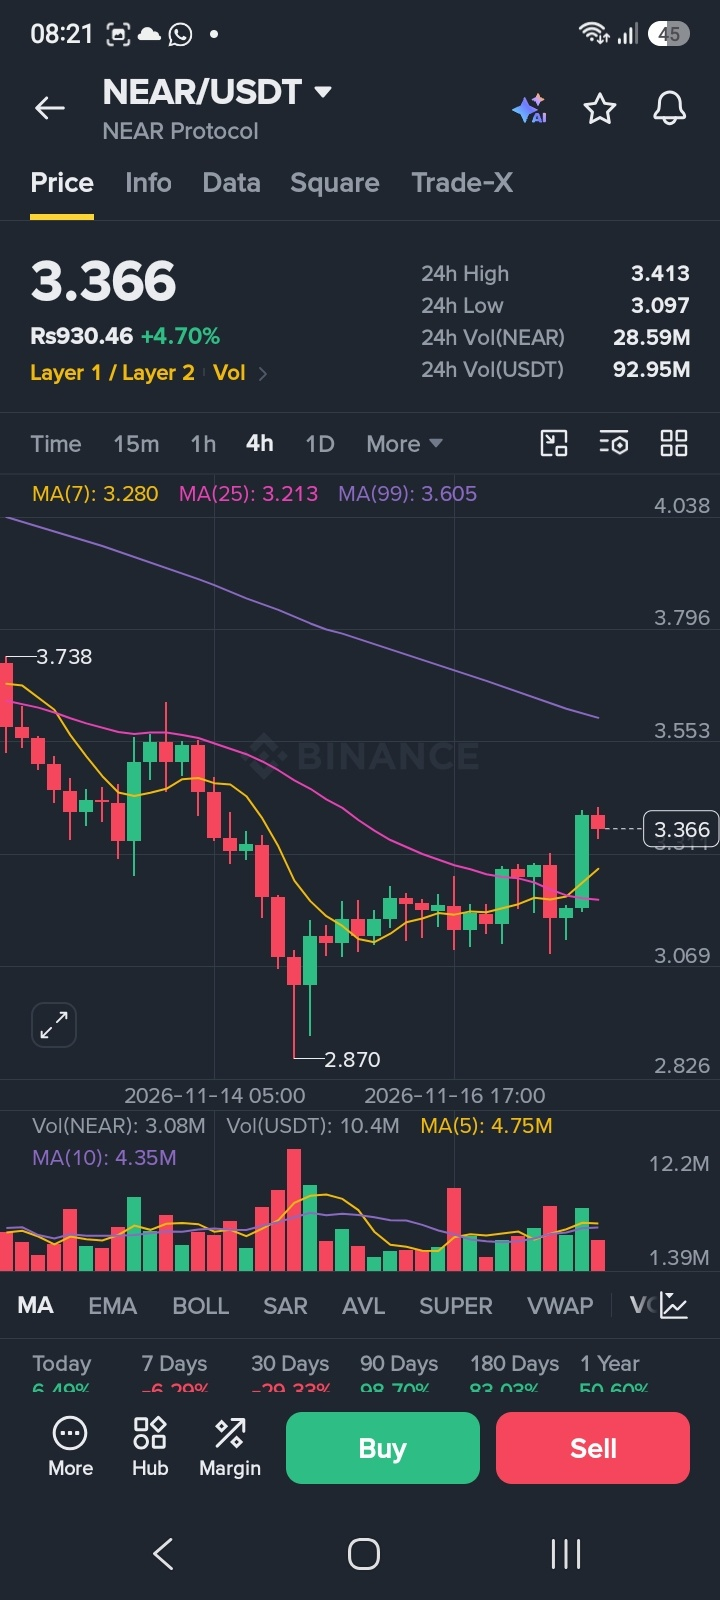
MA(7): $3.677
MA(25): $3.644
MA(99): $4.048
Candle Volume: 2.26M
Volume MA(5): 3.89M
Volume MA(10): 4.07M
NEAR is trading above MA(7) and MA(25), showing a constructive recovery. However, MA(99) near $4.048 remains a major resistance zone. Volume is also below both averages.
📊 Daily Chart: The Bigger Picture
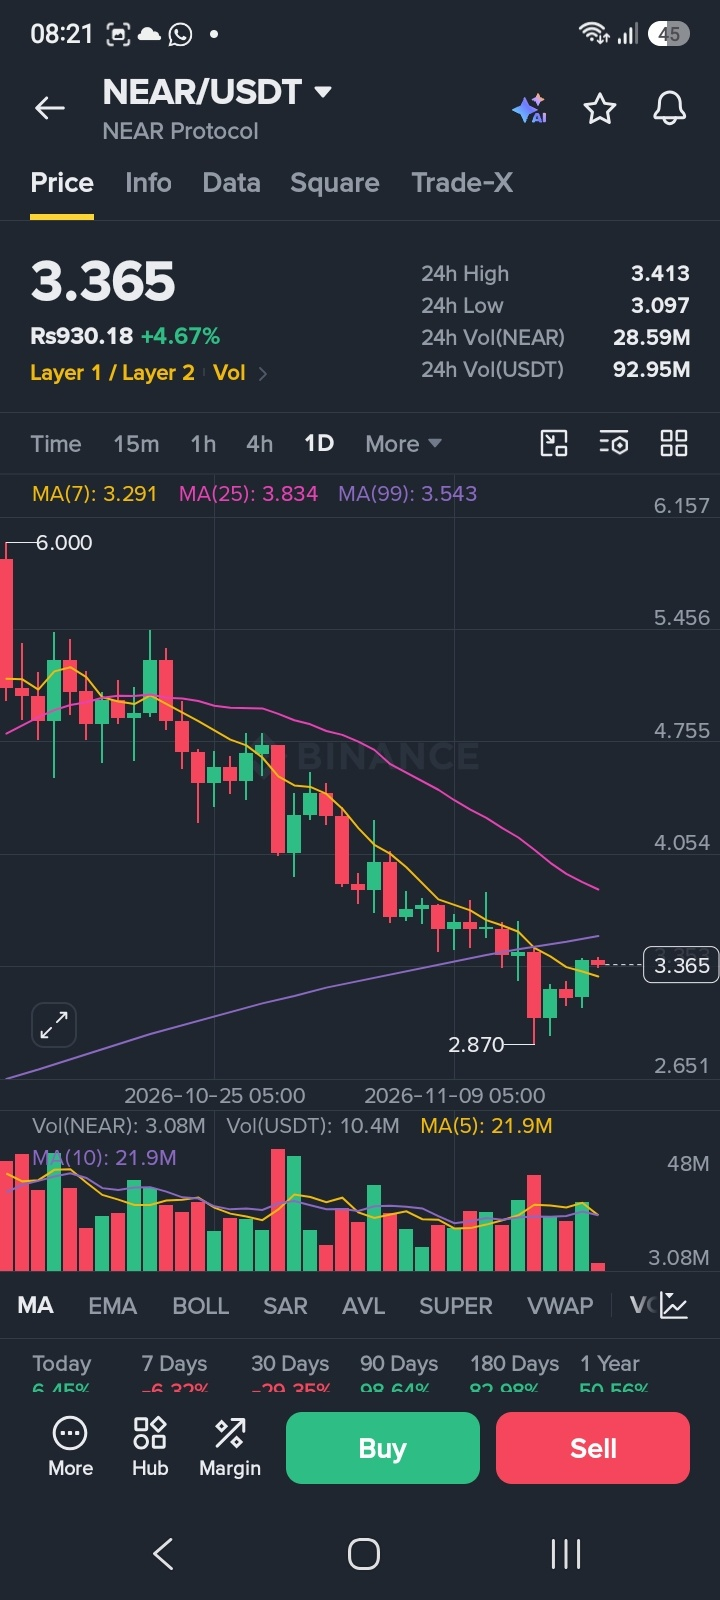
MA(7): $3.662
MA(25): $4.285
MA(99): $3.427
Candle Volume: 19.5M
Volume MA(5): 17.5M
Volume MA(10): 20.5M
The price is above MA(7) and MA(99), but still below MA(25). This indicates that the recovery is developing, while the broader trend still faces resistance.
🎯 Key Support & Resistance Levels
Resistance zones:
$3.815 — 24-hour high and immediate breakout test
$4.048 — 4H MA(99)
$4.285 — Daily MA(25)
Support zones:
$3.715–$3.668 — Short-term moving average area
$3.644–$3.637 — Important 4H/1H support zone
$3.530 — 24-hour low
$3.427 — Daily MA(99)
🔍 What Could Happen Next?
Bullish scenario: If NEAR breaks above $3.815 with stronger trading volume, buyers may attempt to challenge the $4.048 resistance.
Bearish scenario: If the price fails to hold the nearby support area, selling pressure could bring $3.530 back into focus.
Current outlook: NEAR is showing signs of recovery, but the breakout is not confirmed. Volume and the $3.815 resistance will be important to watch.
💬 Your Turn!
Do you think NEAR can break $3.815 and move toward $4.00, or will sellers defend the resistance?
Share your chart view in the comments!
Disclaimer: This article is based on the chart data provided at the time of analysis. It is for educational and informational purposes only, not financial advice. Always do your own research and manage risk.
#NEAR #NEARProtocol #CryptoAnalysis #TechnicalAnalysis #BinanceSquare #BinancePick #altcoins