
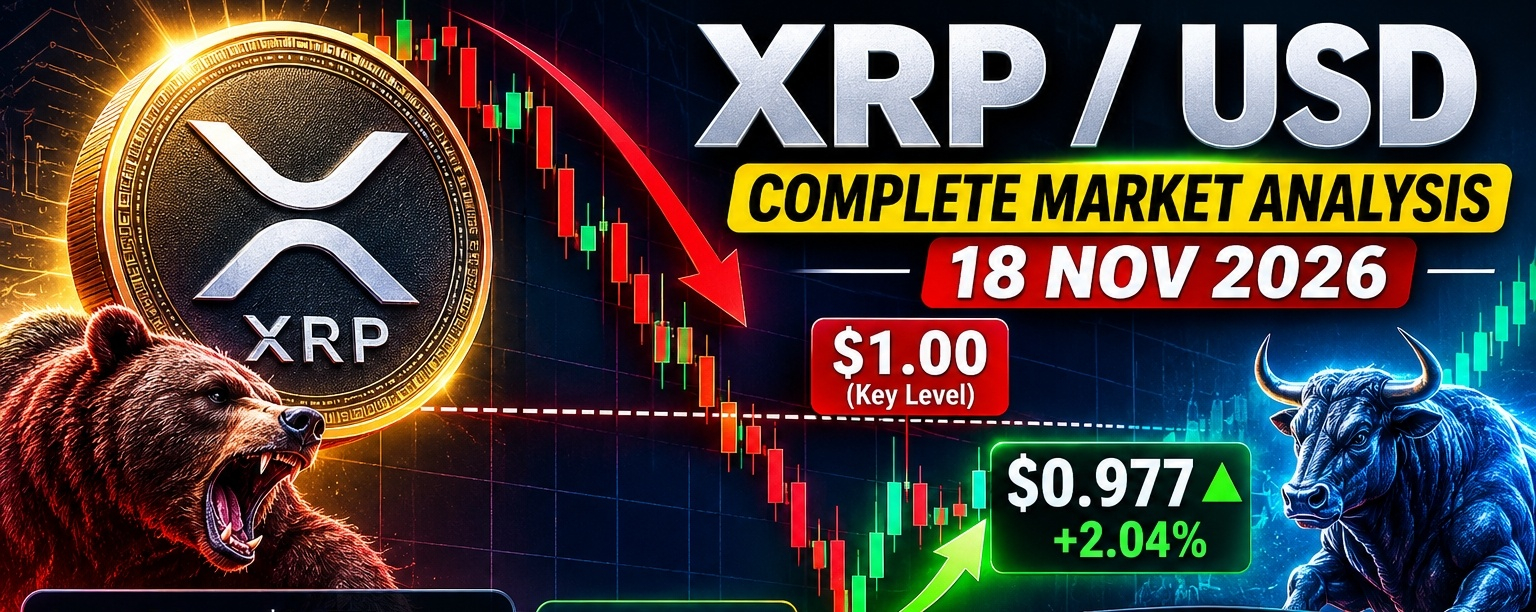

$XRP / USD - Complete Analysis
18 Nov 2026 | Price: ∼$0.977
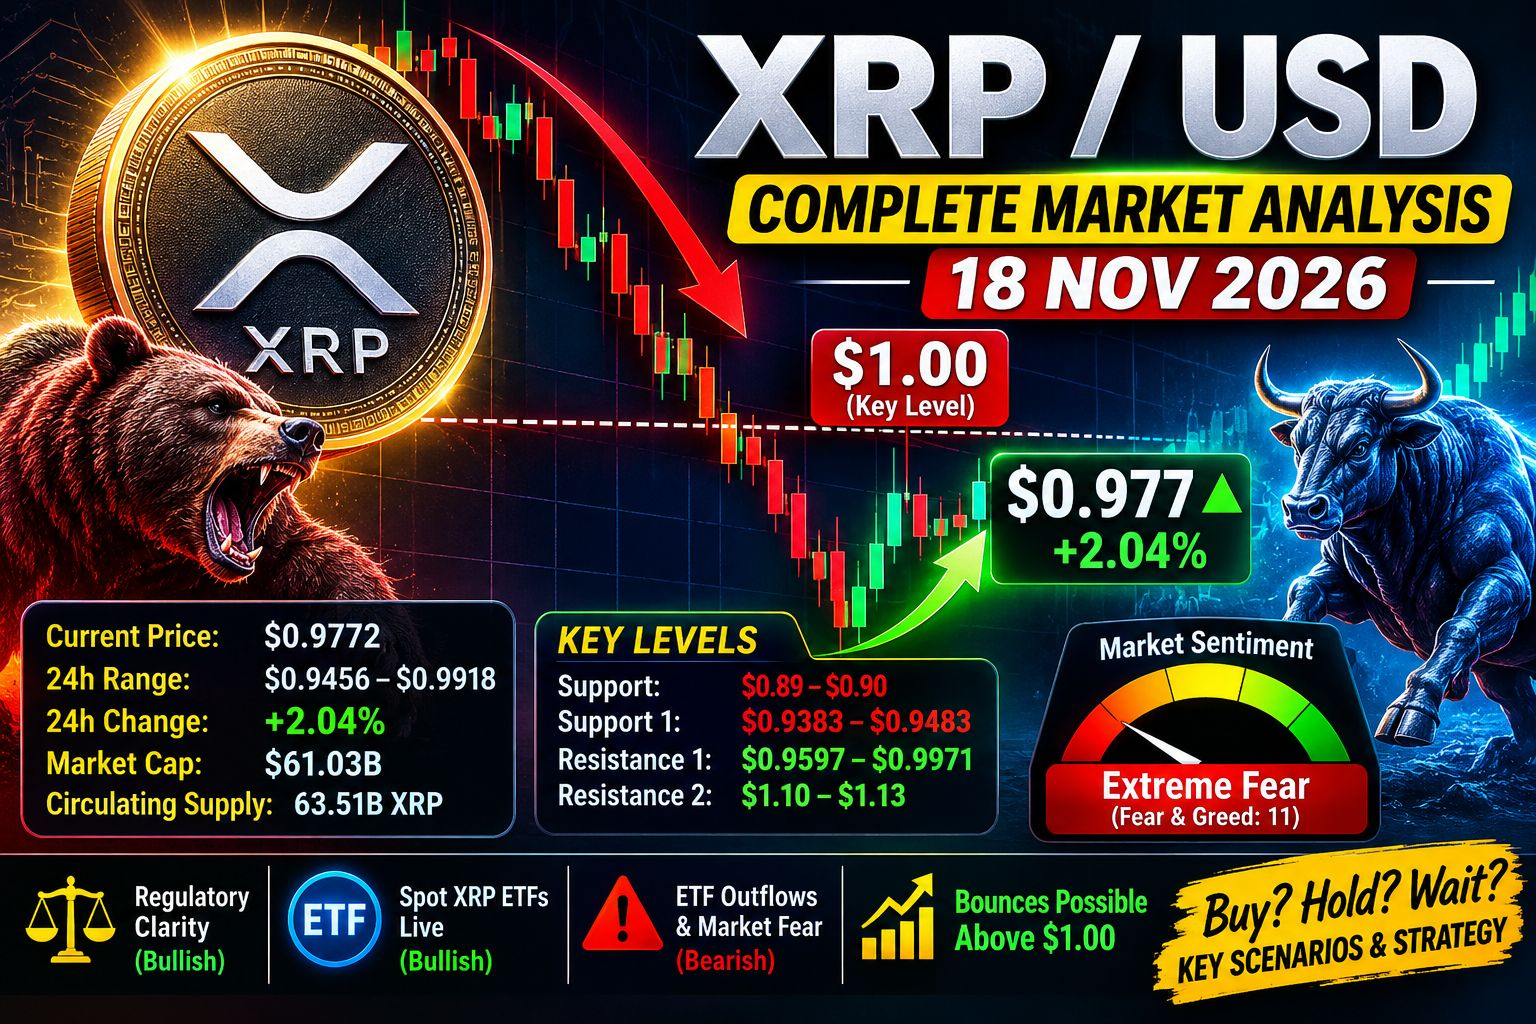
$XRP is in a bearish, oversold bounce phase. It just crashed to its lowest level since November 2024, lost the psychologically critical $1.00 level, and is now trying to reclaim it. The long-term regulatory story has improved dramatically, but short-term price action, ETF outflows, and market-wide fear are dominating.
This is not financial advice. Crypto is highly volatile.

1. Live Market Snapshot
| Metric | Value |
| --- | --- |
| Current Price | $0.9772 |
| 24h Range | $0.9456 - $0.9918 |
| 24h Change | +2.04% |
| 24h Volume | ~$1.62B |
| Market Cap | ~$61.03B |
| Circulating Supply | 63.51B XRP |
| Total / Max Supply | 99.98B / 100B XRP |
| All-Time High | $3.65 (17 July 2025) - now -73.3% below ATH |
Performance:
5 sessions: -6.72%
1 month: -25.69%
6 months: -30.12%
Year-to-date: -48.33%
1 year: -56.19%
Sentiment is Extreme Fear - Fear & Greed at 11, with AI signal rated Bearish 67% in recent trackers.
## 2. What Just Happened?
$XRP fell to $0.89 on 15 Nov, its lowest since November 2024, during sector-wide outflows from crypto ETFs and a contraction in stablecoin market cap.
It has since rebounded +2.36% to $0.9768, but is still below $1 for the first time since mid-August.
In short: Capitulation -> weak bounce -> now stuck under $1.00.
3. Technical Analysis
Trend: Bearish
Price is well below its major moving averages. The nearest moving average is close to $1.13 and the longer-term average remains above $1.30. That means every rally has to fight through overhead supply.
Momentum: Deeply Oversold, Starting to Turn
14-day RSI reads 26.35 after rebounding from a low near 17, its deepest oversold reading on the chart, and sits 3.39 points below its signal line at 29.74.
RSI < 30 = oversold. This often leads to a bounce, but in a strong downtrend it can stay oversold for a while. It does NOT mean the bottom is in.
Key Levels
| Type | Level | Why it matters |
| --- | --- | --- |
| Strong Support | $0.89 - $0.90 | Recent crash low, Nov 2024 levels. Break below opens $0.77-$0.87 |
| Support 1 | $0.9383 - $0.9483 | Nearest support, ∼3% below current price |
| Support 2 | $0.9031 | Consolidation floor for next 2-3 days |
| Resistance 1 | $0.9597 - $0.9971 | Ichimoku Kijun + first resistance. Must clear to hold bounce |
| Psychological Resistance | $1.00 | The big round number. Losing it was bearish, reclaiming it is bullish |
| Resistance 2 | $1.10 - $1.13 | 20-day EMA. First major level a real rebound must clear |
| Resistance 3 | $1.24 - $1.40 | 30-day high zone + previous breakdown zone |
Immediate outlook from analysts: Consolidation expected between $0.9031 and $0.9985 over the next 2-3 trading days, with Kijun at $0.9613 acting as immediate resistance.
First resistance is $0.9971 (+2.8%), first support $0.9383 (-3.3%).
4. Fundamental Analysis - Why Long-Term Is Different From Price
Bullish Fundamentals
1. Regulatory Clarity - Solved
On 17 March 2026, the SEC and CFTC jointly classified XRP as a digital commodity, placing it on the same legal footing as Bitcoin and Ethereum. This removes the key legal barrier that kept institutions away for years.
2. Spot XRP ETFs Are Live
Six spot XRP ETFs are now live in the U.S., with expense ratios from 0.19% to 0.75%. Funds include Bitwise, Grayscale, Franklin Templeton, 21Shares, Canary, and REX-Osprey. First spot ETFs cleared in November 2025 after the SEC ended its case against Ripple.
3. ETF Options Expansion
In Sept 2026, Canadian Derivatives Clearing Corporation registered options on the Evolve XRP ETF and Purpose XRP ETF for sale in the US. This adds hedging tools for institutions.
4. Ripple's Real Use Case
XRP Ledger is built for fast, cheap cross-border payments - a real utility narrative vs. pure meme coins.
Bearish Fundamentals
1. ETF Flows Are Negative Right Now
The recent crash was driven by outflows from crypto ETFs. Even with ETFs approved, inflows have stalled.
2. No Recovery Catalyst
Analysts note XRP is near $61B market cap but "lacks recovery catalyst" despite the regulatory wins.
3. Supply Overhang
∼36B XRP still not in circulation (held by Ripple escrow / company). Unlocks create constant selling pressure fear.
4. Crypto Market-Wide Weakness
Bitcoin and altcoins are also falling, stablecoin market is shrinking - XRP is not falling alone.
5. Scenarios - What to Watch
🟢 Bullish Scenario (30% probability short-term)
Trigger: Daily close back above $1.00, then above $1.10
Target: $1.13 -> $1.24 -> $1.40
November projection targets $1.04, within range $0.89 to $1.13. Upside target is $1.24, 15.9% above $1.07, once XRP closes above $1.10 and ETF flows turn positive.
🟡 Base / Sideways Scenario (45% probability)
Range: $0.90 - $1.00
XRP consolidates, builds a base, RSI recovers from oversold. This is the "continued struggle near the bottom of the 52-week range" base case.
🔴 Bearish Scenario (25% probability)
Trigger: Lose $0.89 on a daily close with high volume
Target: $0.77 - $0.87
Longer-term chart projections identify a lower potential support range between $0.77 and $0.87. Some analysts warn losing $0.99 could expose XRP to further losses toward $0.80. EGRAG identifies $0.75 to $0.85 as a major support zone.
Ignore extreme long-term hype targets like $31.64 Fibonacci extensions circulating on social media - those require a full new bull cycle and massive adoption, not a short-term trade.
6. Key Dates Ahead
30 Nov 2026: GraniteShares leveraged XRP ETFs (3x Long / 3x Short) new effective date after delay from Oct 26 filing. Leveraged products increase volatility, not necessarily price.
Late Nov: Watch for spot ETF weekly flow data - if inflows return, that's the first real bullish signal.
7. Strategy Summary (Not Advice)
For Traders:
Do NOT chase the bounce under $1.00
Bullish confirmation = close above $1.00 + hold it for 2 days
Bearish confirmation = close below $0.89
Stop-loss logic for longs is typically just below $0.89
For Long-Term Holders / DCA:
Current zone $0.89 - $1.00 is historically a value zone (Nov 2024 levels)
Risk is still high: YTD -48% shows trend is down
Fundamentals (commodity status + ETFs) are best ever, price is worst in 2 years - that divergence is why many long-term holders are accumulating cautiously, not all-in
Risk Score: 41/100 - moderate-high risk environment.
#XRPPredictions #Xrp🔥🔥 #XRPUSDT #Ripple #CryptoNews #WhaleAlert #BinanceUpdates #MarketVolatility