$RWUSD: Measuring Risk Variations and Liquidity Mechanics
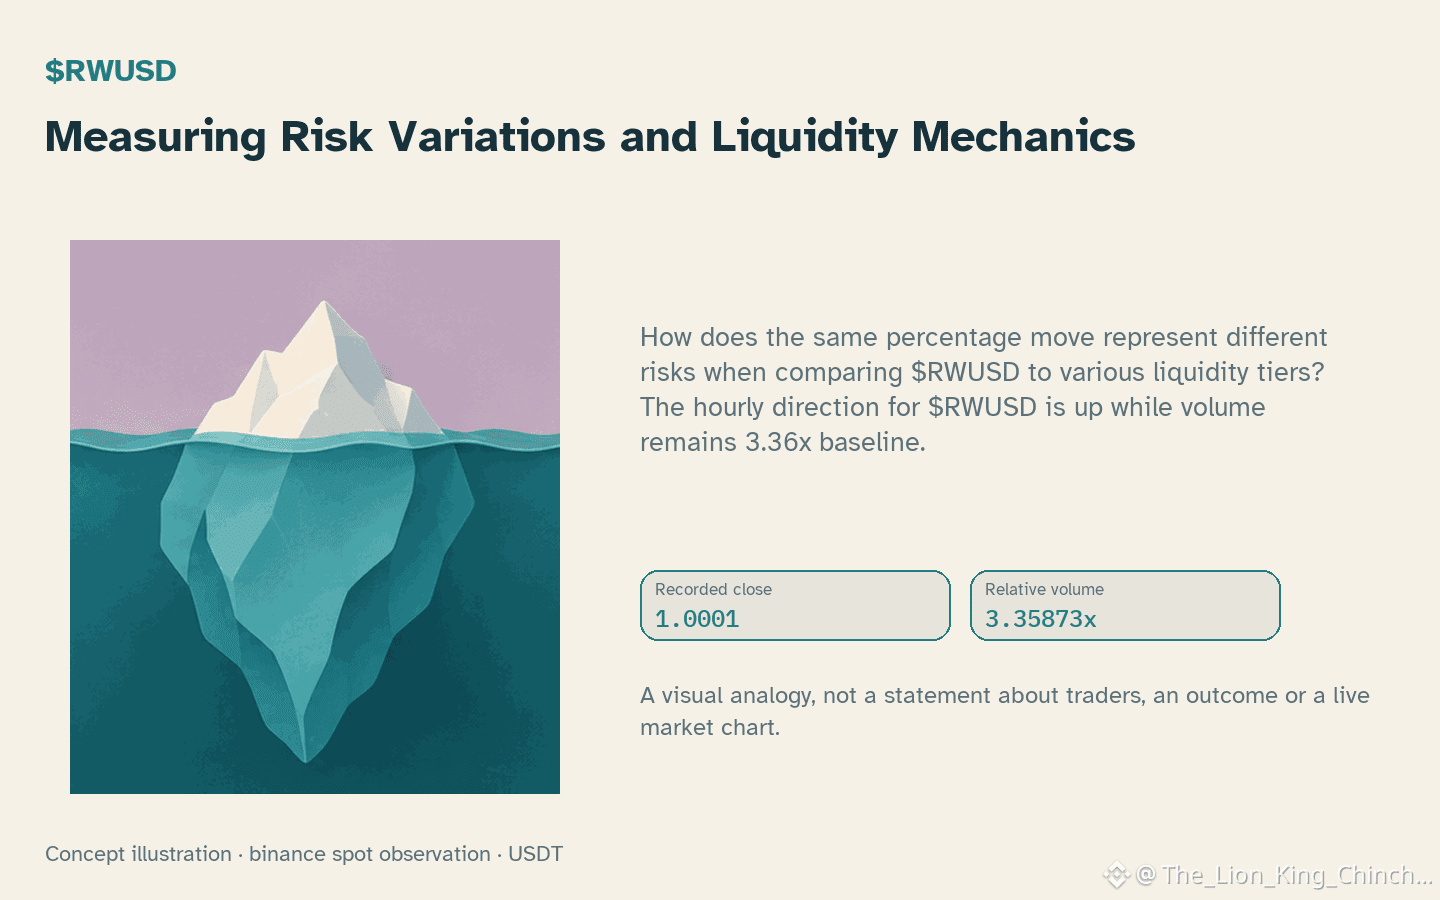
How does the same percentage move represent different risks when comparing $RWUSD to various liquidity tiers? The hourly direction for $RWUSD is up while volume remains 3.36x baseline.
Consider the hypothetical mechanism of slippage during periods of high volatility. Average True Range (ATR) measures the distance between high and low prices, yet it does not account for how many participants are willing to meet a trade at every price point. In a thin liquidity tier, a single trade might push the price across multiple ATR bands. Conversely, a deep liquidity asset might absorb large activity with minimal deviation from the current price 1.0001.
While $RWUSD moves up, peers show mixed outcomes. ETH has an hourly direction up with volume not above its baseline. HUMA shows an hourly direction down while volume is above its baseline. These distinct same-venue behaviors highlight that a shared direction is not a common cause. For example, if hourly change 0.01% occurred on ETH, the execution cost might differ significantly from a similar move on a lower-volume coin. This thought experiment reminds us that volatility alone is not a proxy for cost-effective entry. If future closed candles show $RWUSD breaking below support 0.9999 on falling volume, it could suggest the current volatility mechanism is shifting. ⚖️
Probabilistic market research, not a recommendation or guaranteed return.
The comparison to keep in mind: $ETH has hourly direction up and volume not above its baseline; $HUMA has hourly direction down and volume above its baseline. This alone does not establish correlation.
#RWUSD #ETH #HUMA
How does the same percentage move represent different risks when comparing $RWUSD to various liquidity tiers? The hourly direction for $RWUSD is up while volume remains 3.36x baseline.
Consider the hypothetical mechanism of slippage during periods of high volatility. Average True Range (ATR) measures the distance between high and low prices, yet it does not account for how many participants are willing to meet a trade at every price point. In a thin liquidity tier, a single trade might push the price across multiple ATR bands. Conversely, a deep liquidity asset might absorb large activity with minimal deviation from the current price 1.0001.
While $RWUSD moves up, peers show mixed outcomes. ETH has an hourly direction up with volume not above its baseline. HUMA shows an hourly direction down while volume is above its baseline. These distinct same-venue behaviors highlight that a shared direction is not a common cause. For example, if hourly change 0.01% occurred on ETH, the execution cost might differ significantly from a similar move on a lower-volume coin. This thought experiment reminds us that volatility alone is not a proxy for cost-effective entry. If future closed candles show $RWUSD breaking below support 0.9999 on falling volume, it could suggest the current volatility mechanism is shifting. ⚖️
Probabilistic market research, not a recommendation or guaranteed return.
The comparison to keep in mind: $ETH has hourly direction up and volume not above its baseline; $HUMA has hourly direction down and volume above its baseline. This alone does not establish correlation.
#RWUSD #ETH #HUMA