🚨 BITCOIN (BTC/USDT): Is This a Temporary Bounce or Another Leg Down?
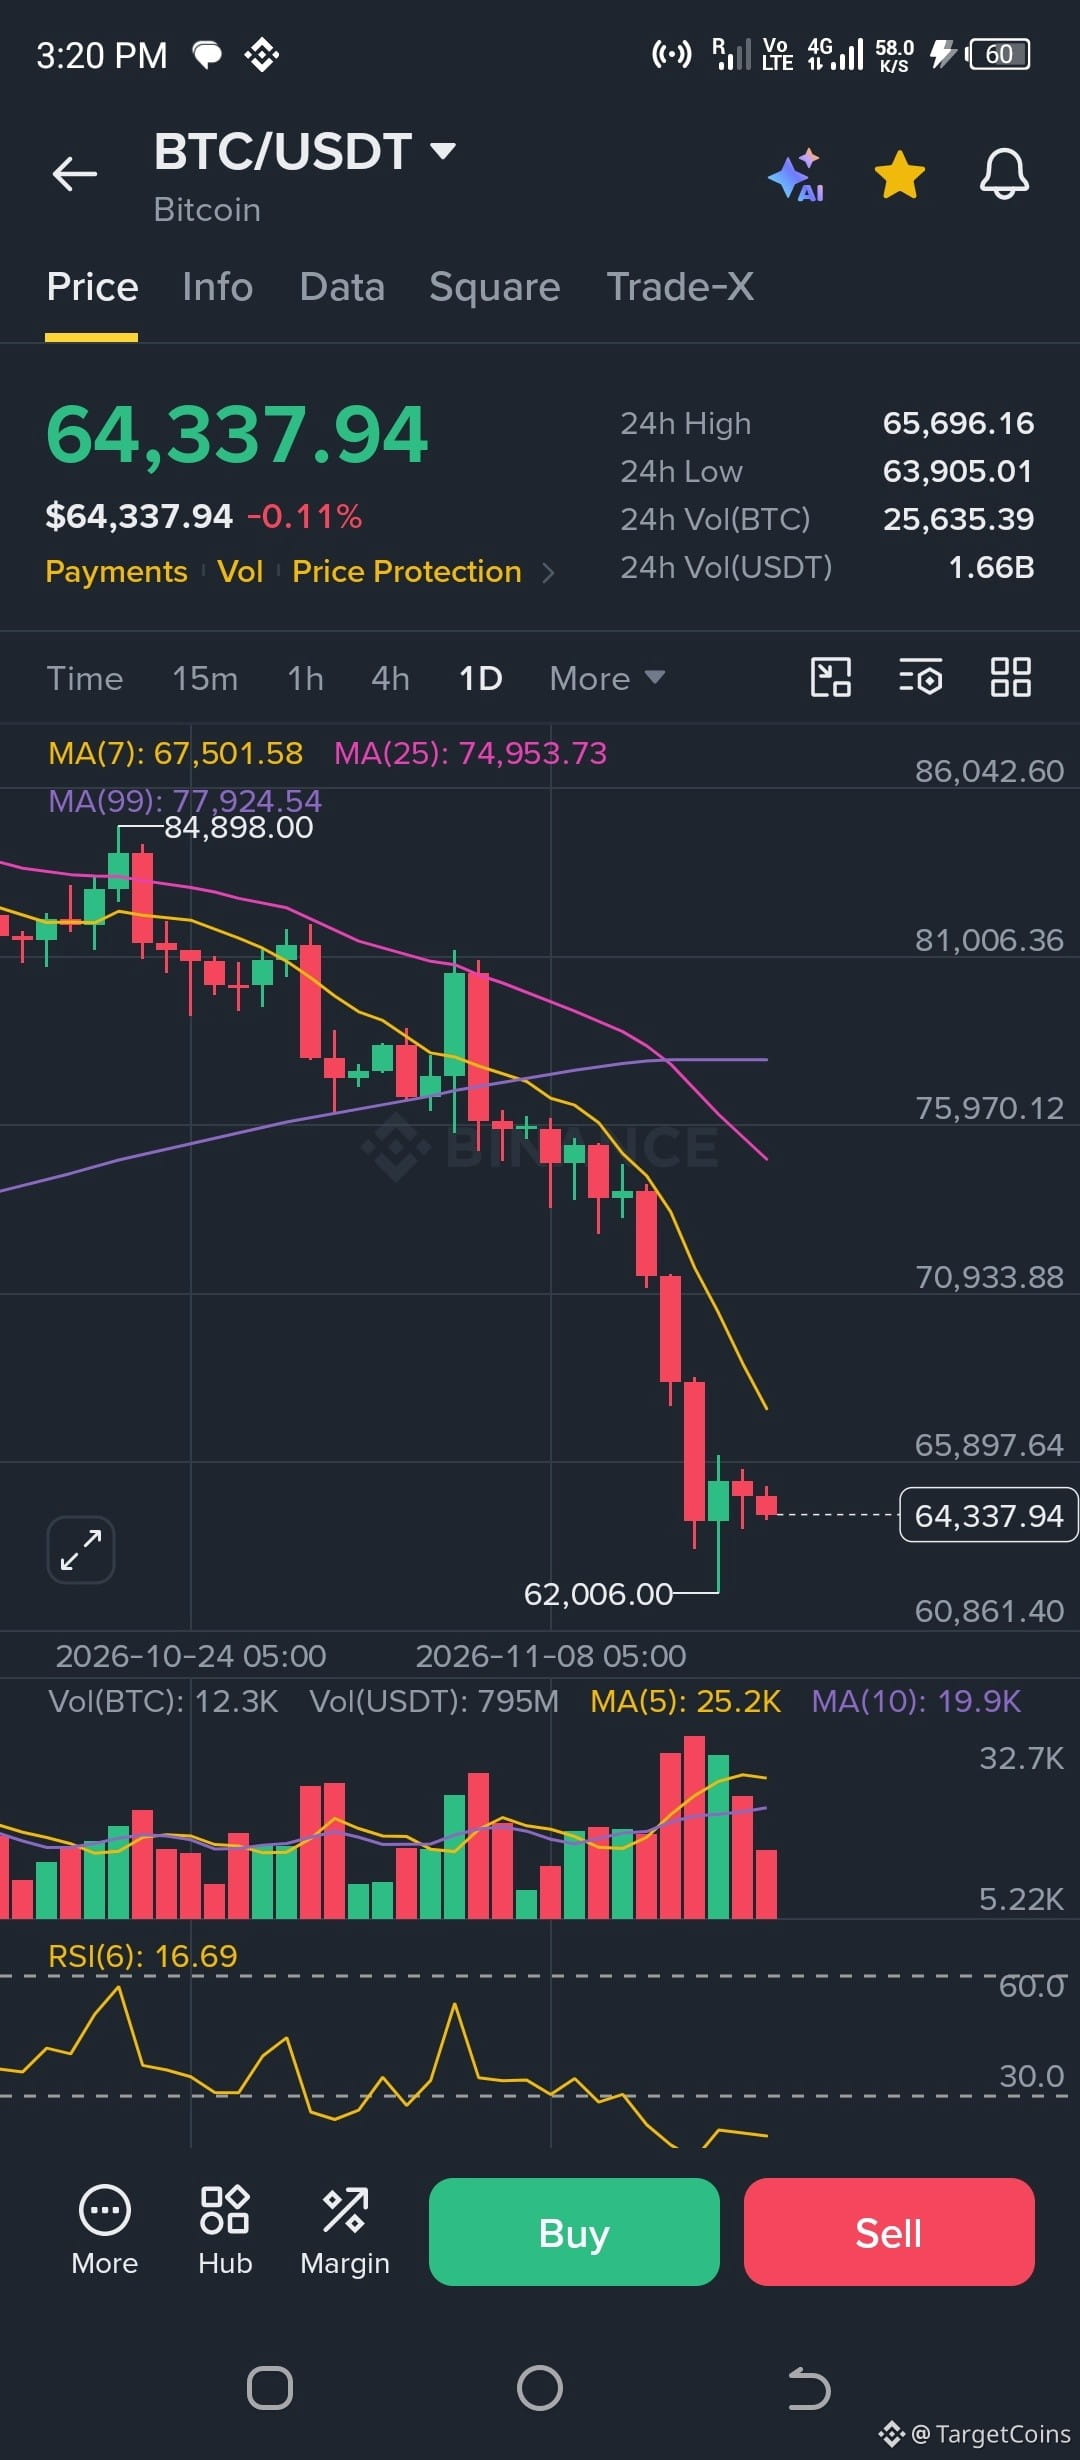
📉 Bitcoin is struggling to recover after a sharp correction from the $84K+ zone, with price now hovering around the $64,300 region.
The big question is: Are buyers preparing for a recovery, or is the market setting up for another downside move?
Let's examine the key technical signals.
🔍 MULTI-TIMEFRAME ANALYSIS
1️⃣ Daily Chart (1D)
- Strong bearish momentum remains dominant.
- Price has broken below major moving averages.
- RSI(6) dropped to approximately 16.69, indicating deeply oversold conditions.
- A relief bounce is possible, but a confirmed trend reversal is not yet visible.
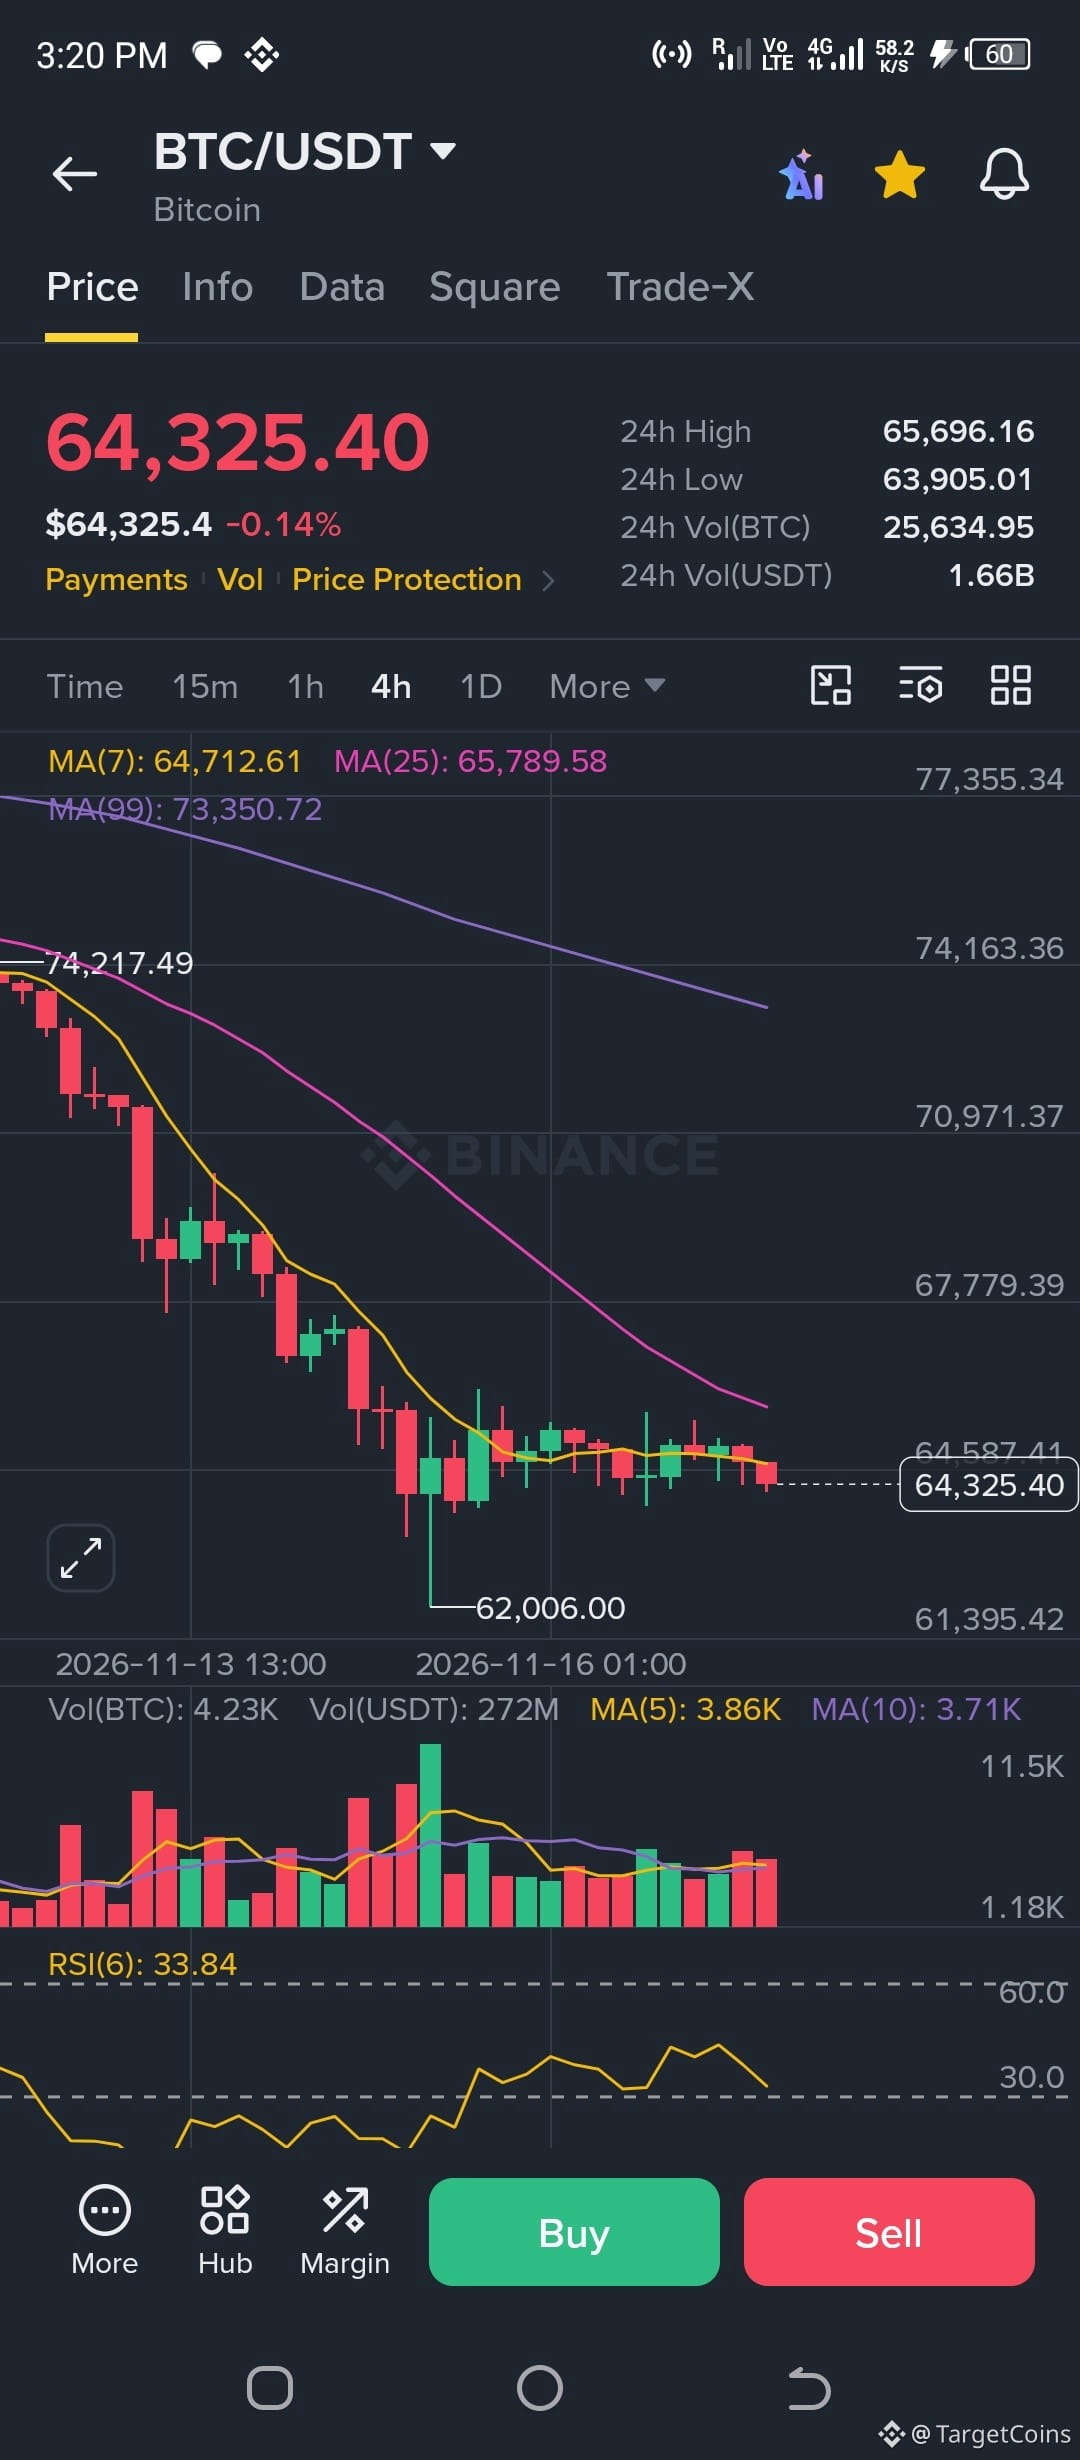
2️⃣ 4-Hour Chart (4H)
- BTC is consolidating around $64,300.
- RSI is approximately 33.84.
- Buyers are attempting to establish a support base, but momentum remains weak.
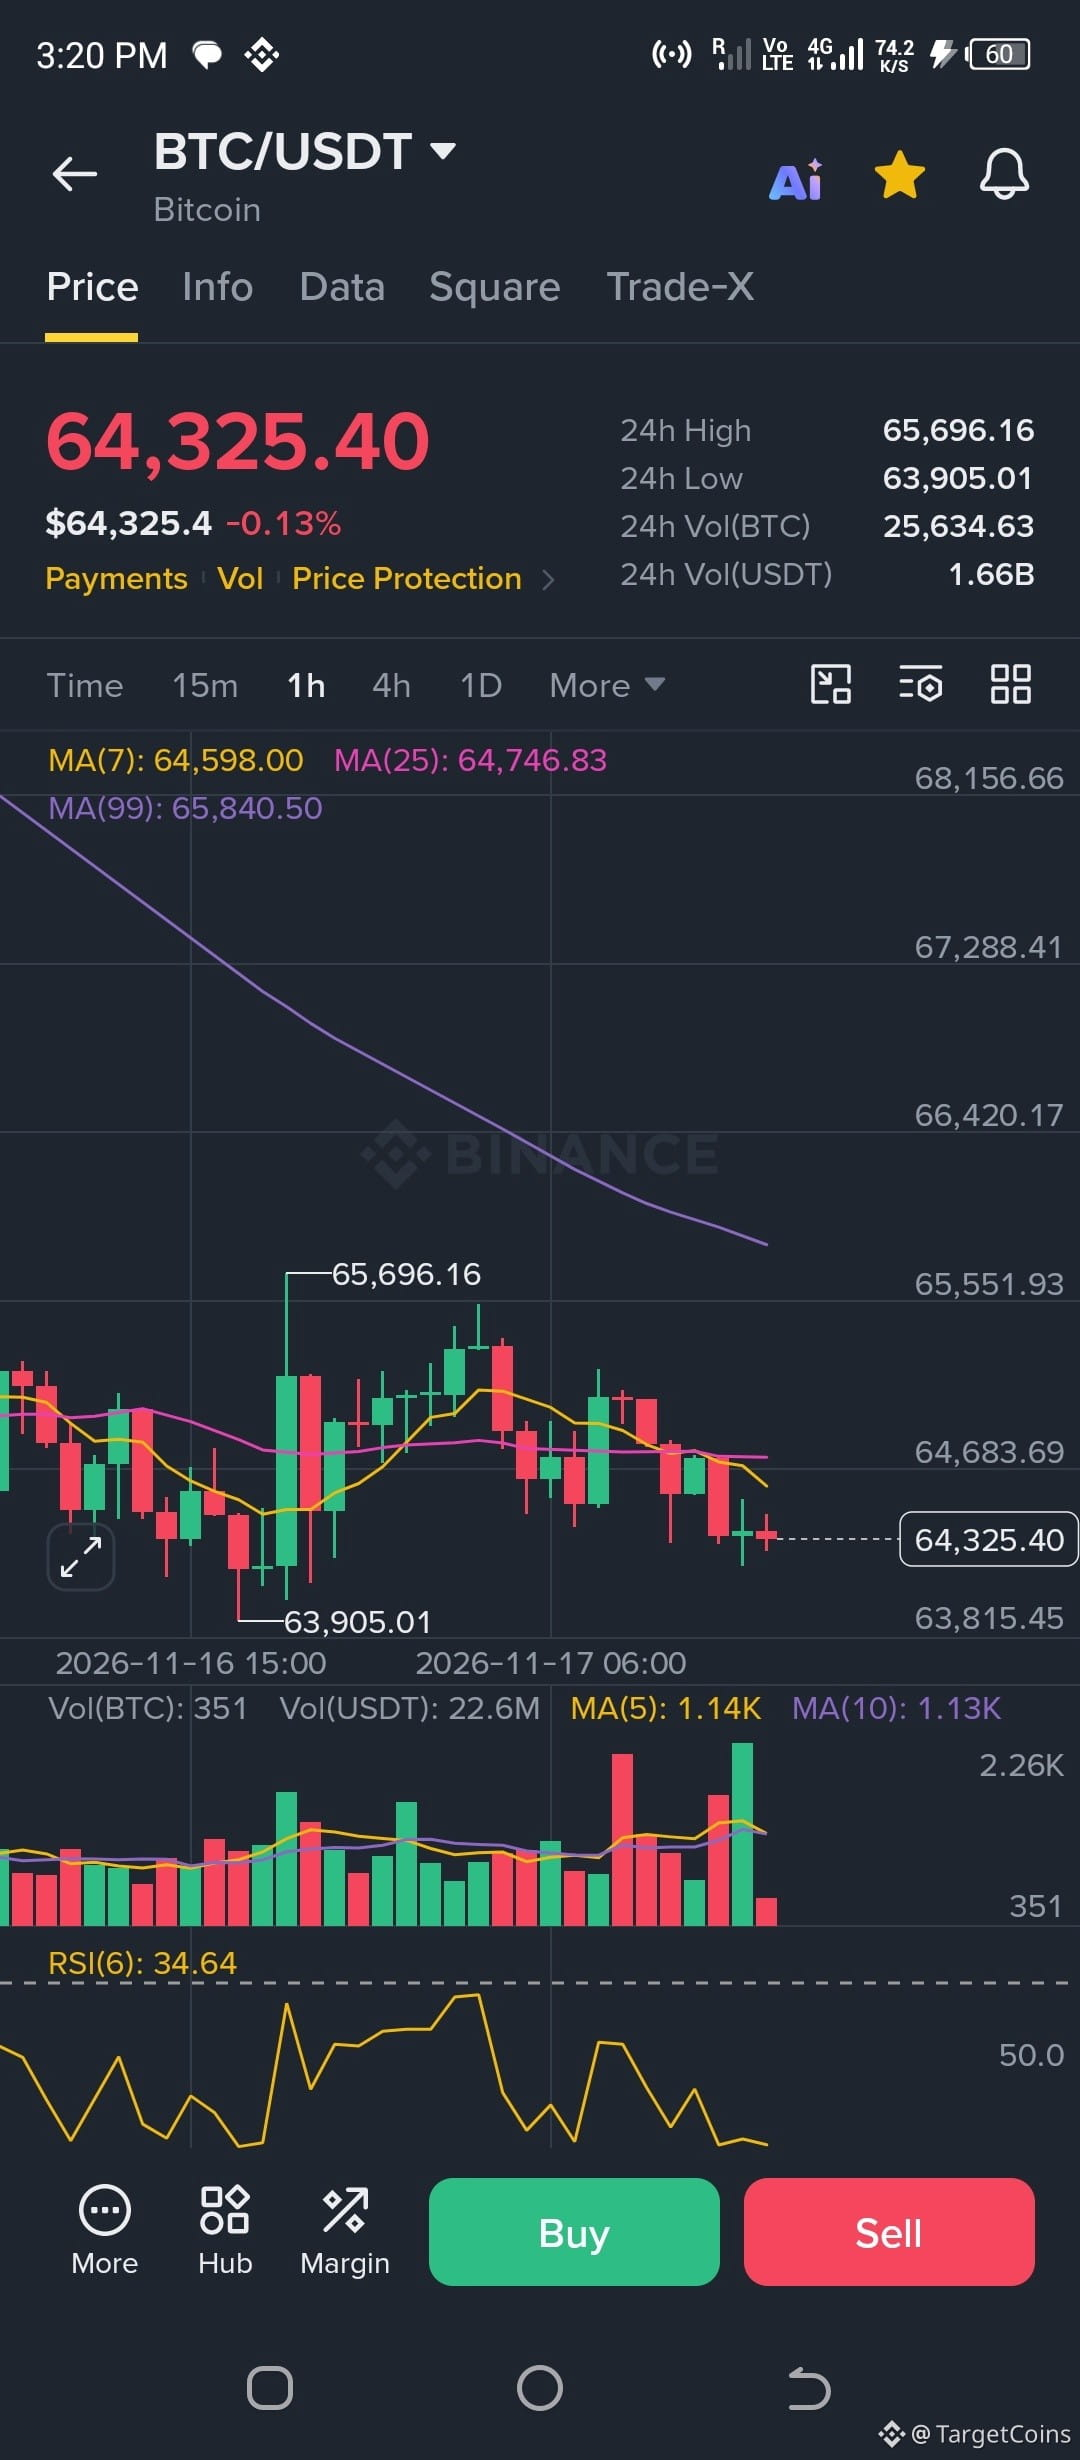
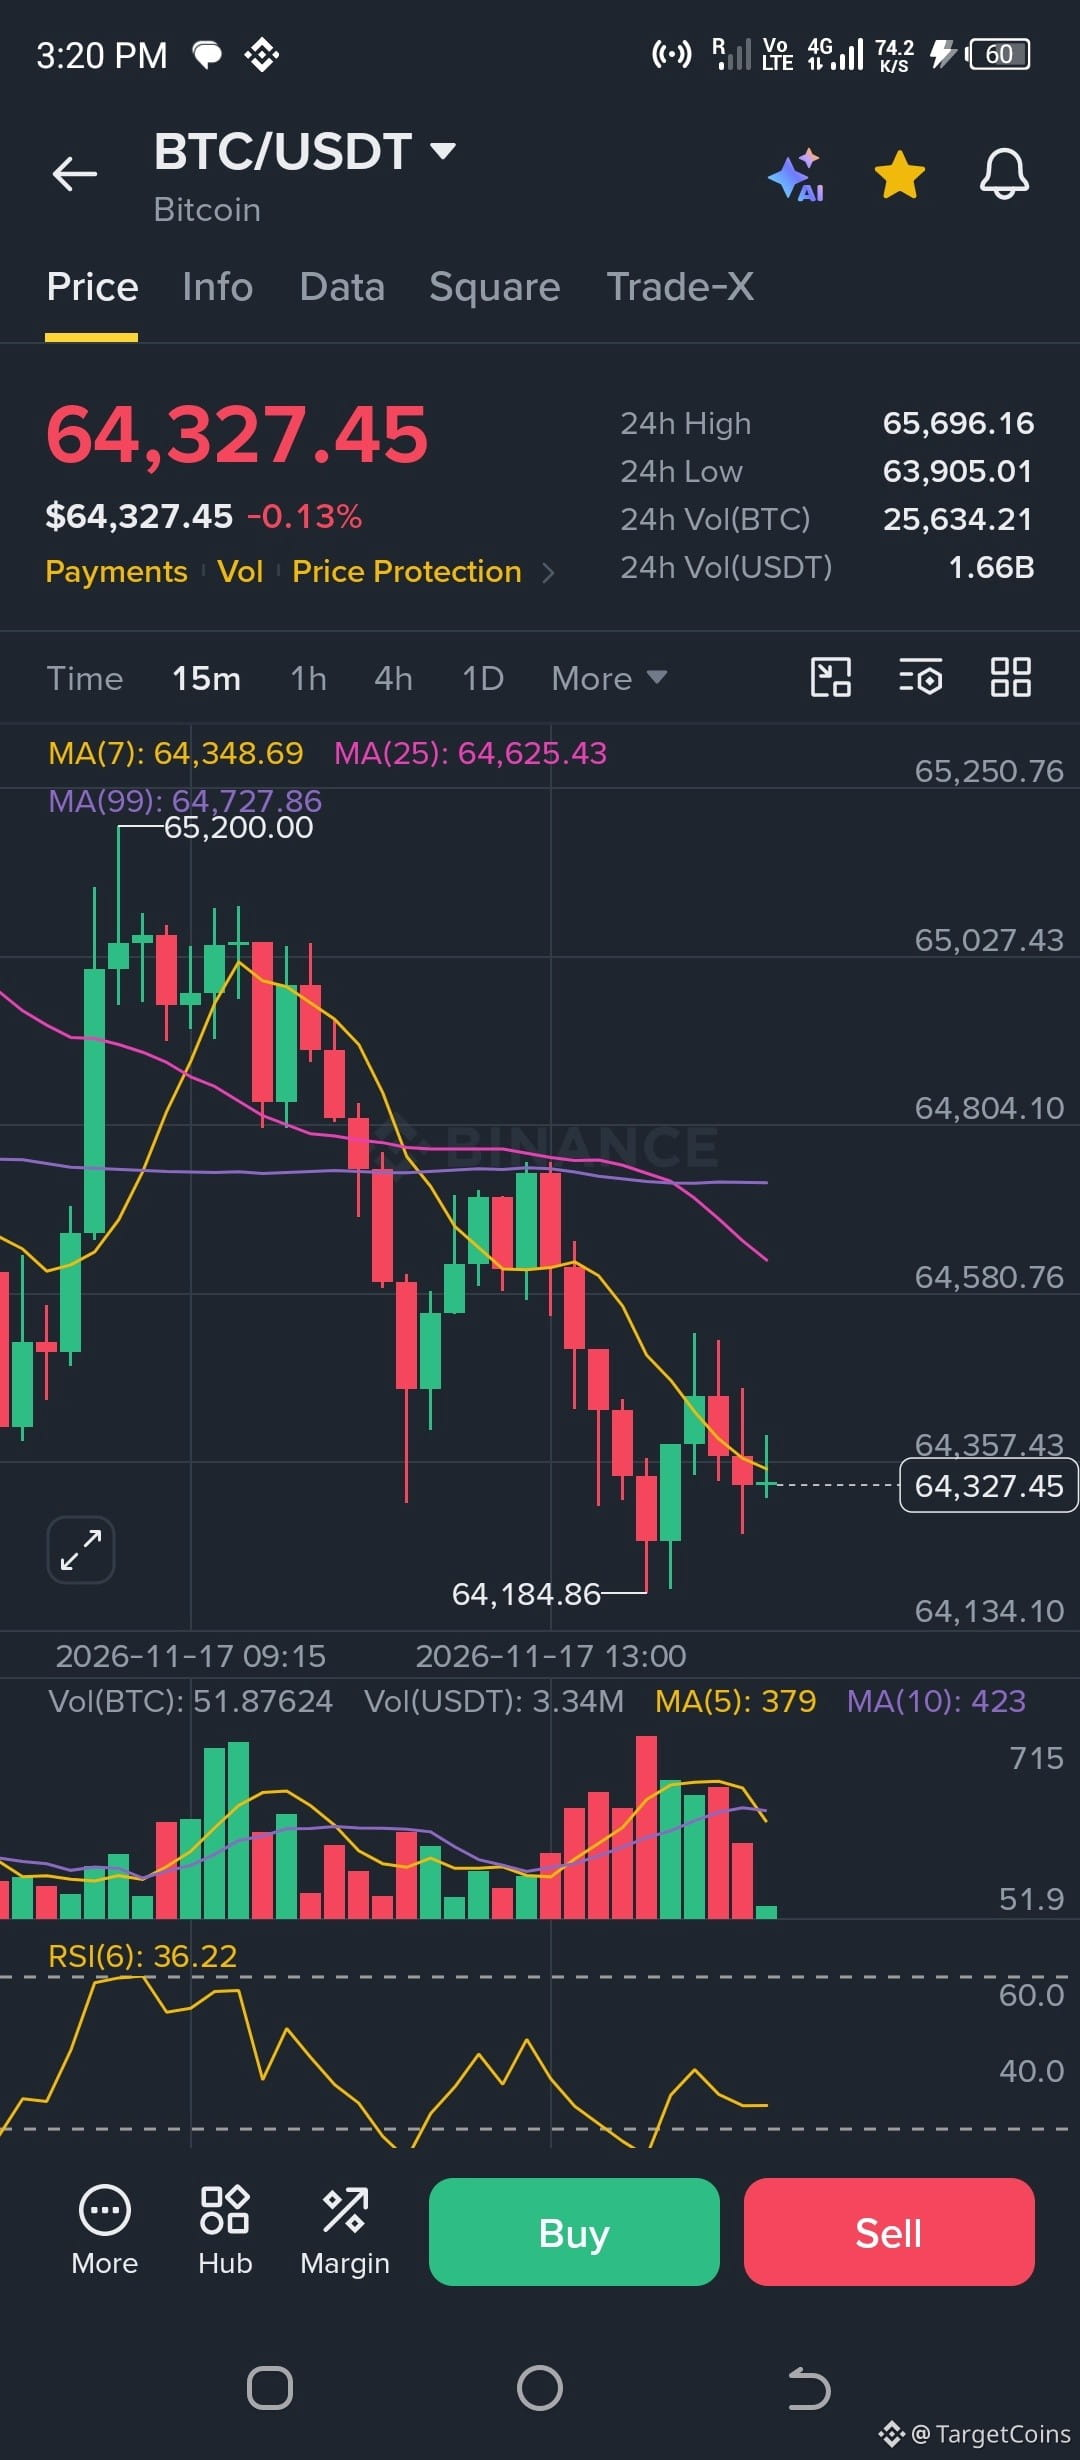
3️⃣ 1H & 15M Charts
- Short-term price action remains sideways and volatile.
- Resistance is concentrated around $64,700–$65,200.
- A strong breakout above this zone could improve short-term momentum.
🎯 CRITICAL PRICE LEVELS
🟢 Support Zones
- $63,900–$64,000: Immediate support
- $62,000: Major structural support
🔴 Resistance Zones
- $64,700–$65,500: Immediate resistance
- $67,500+: Major resistance and potential trend-reversal zone
📊 TWO POSSIBLE SCENARIOS
🟢 BULLISH SCENARIO
If BTC holds above $64,000 and buying volume increases, a relief rally toward $65,500–$67,500 could develop.
🔴 BEARISH SCENARIO
If BTC breaks below $63,900 with strong selling pressure, the next major downside target could be $62,000.
A confirmed breakdown below $62K would increase the risk of further downside.
⚠️ MY MARKET OUTLOOK
Despite extremely oversold RSI readings, the overall trend remains bearish until Bitcoin reclaims important resistance levels.
I would prefer confirmation before considering a bullish reversal.
Remember: Oversold does not automatically mean a bottom!
💬 What's your expectation?
📉 Bitcoin is struggling to recover after a sharp correction from the $84K+ zone, with price now hovering around the $64,300 region.
The big question is: Are buyers preparing for a recovery, or is the market setting up for another downside move?
Let's examine the key technical signals.
🔍 MULTI-TIMEFRAME ANALYSIS
1️⃣ Daily Chart (1D)
- Strong bearish momentum remains dominant.
- Price has broken below major moving averages.
- RSI(6) dropped to approximately 16.69, indicating deeply oversold conditions.
- A relief bounce is possible, but a confirmed trend reversal is not yet visible.
2️⃣ 4-Hour Chart (4H)
- BTC is consolidating around $64,300.
- RSI is approximately 33.84.
- Buyers are attempting to establish a support base, but momentum remains weak.
3️⃣ 1H & 15M Charts
- Short-term price action remains sideways and volatile.
- Resistance is concentrated around $64,700–$65,200.
- A strong breakout above this zone could improve short-term momentum.
🎯 CRITICAL PRICE LEVELS
🟢 Support Zones
- $63,900–$64,000: Immediate support
- $62,000: Major structural support
🔴 Resistance Zones
- $64,700–$65,500: Immediate resistance
- $67,500+: Major resistance and potential trend-reversal zone
📊 TWO POSSIBLE SCENARIOS
🟢 BULLISH SCENARIO
If BTC holds above $64,000 and buying volume increases, a relief rally toward $65,500–$67,500 could develop.
🔴 BEARISH SCENARIO
If BTC breaks below $63,900 with strong selling pressure, the next major downside target could be $62,000.
A confirmed breakdown below $62K would increase the risk of further downside.
⚠️ MY MARKET OUTLOOK
Despite extremely oversold RSI readings, the overall trend remains bearish until Bitcoin reclaims important resistance levels.
I would prefer confirmation before considering a bullish reversal.
Remember: Oversold does not automatically mean a bottom!
💬 What's your expectation?