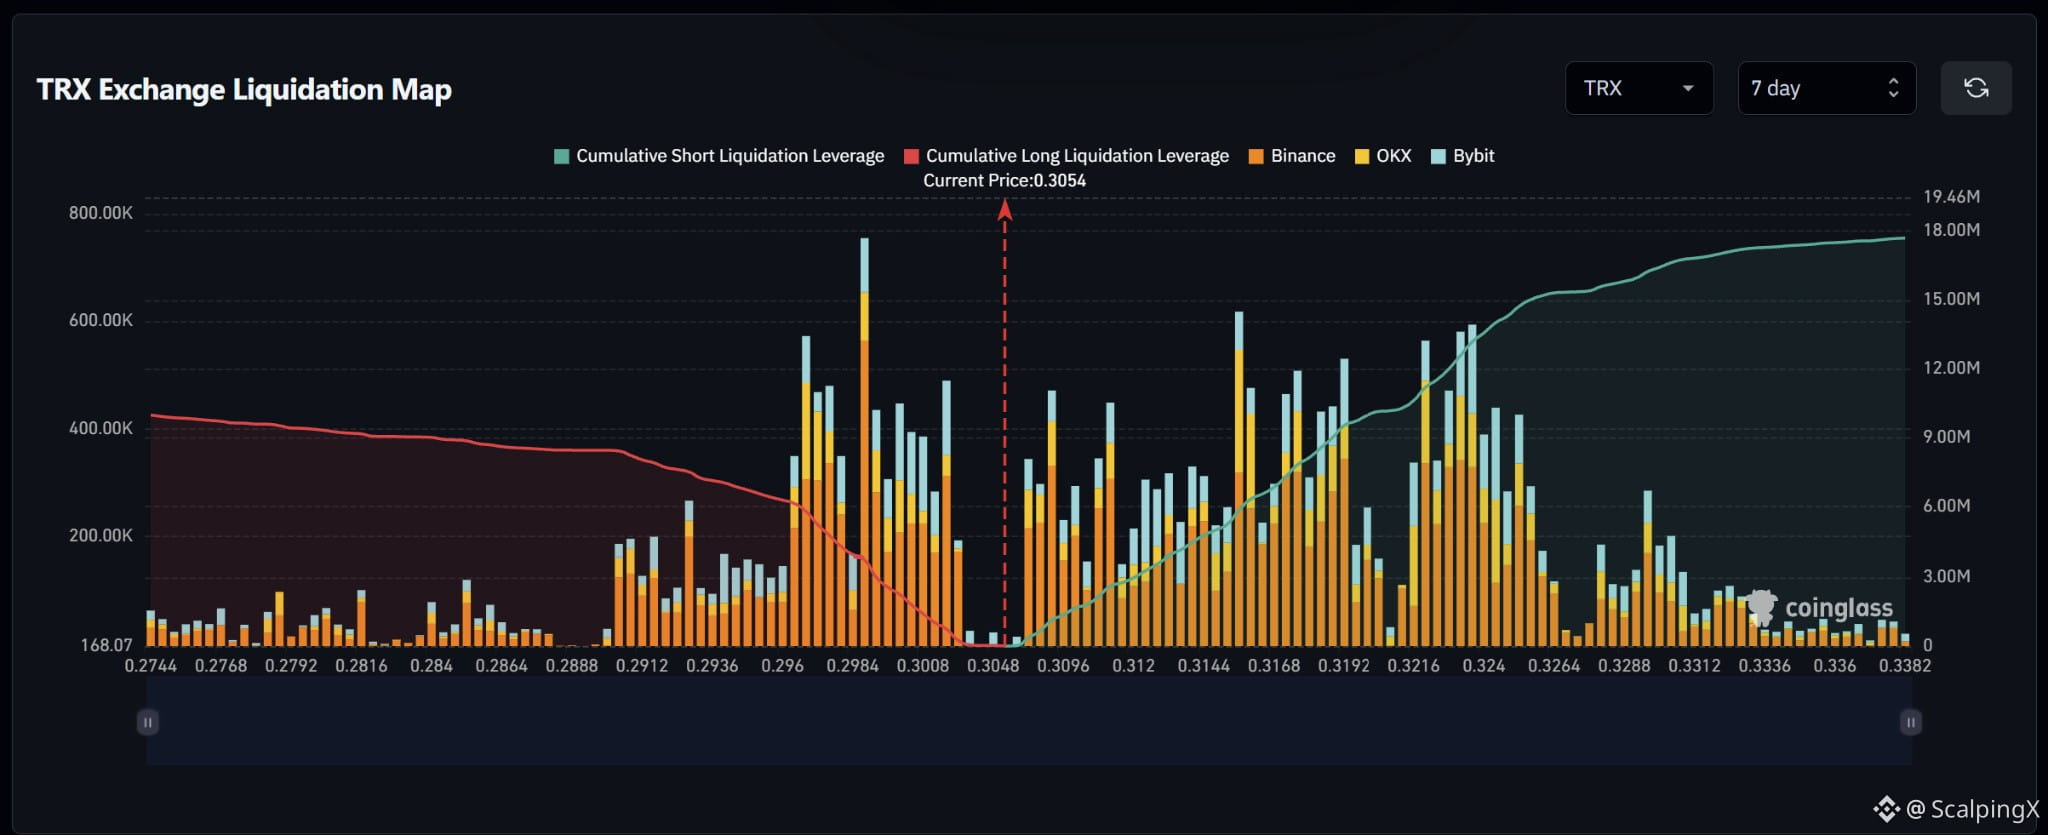
$TRX – Liquidation Map (7 days) – Index ~0.3054
🧭 Favor a short-liquidation sweep at 0.3060–0.3092. Liquidation bars sit close above price, particularly around 0.3088, while the nearest major long cluster lies lower at 0.3008–0.3020.
🔺 Breaking and holding above 0.3092 would shift focus to 0.3105–0.3120, followed by 0.3155–0.3200. The latter contains several large bars, especially around 0.3155 and 0.3192.
🎯 Holding above 0.3200 would bring 0.3220–0.3255 into view. Above 0.3264, liquidation density drops noticeably, with smaller clusters around 0.3288–0.3305. A short sweep followed by a drop below 0.3054 would weaken upside continuation.
⚖️ Losing 0.3048 without reclaiming it would shift preference toward a long-liquidation sweep at 0.3008–0.3020. Holding below 0.3008 would put 0.2984–0.3004, then 0.2965–0.2978 in focus; the largest long bar stands out around 0.2988.
#LiquidationMap
🧭 Favor a short-liquidation sweep at 0.3060–0.3092. Liquidation bars sit close above price, particularly around 0.3088, while the nearest major long cluster lies lower at 0.3008–0.3020.
🔺 Breaking and holding above 0.3092 would shift focus to 0.3105–0.3120, followed by 0.3155–0.3200. The latter contains several large bars, especially around 0.3155 and 0.3192.
🎯 Holding above 0.3200 would bring 0.3220–0.3255 into view. Above 0.3264, liquidation density drops noticeably, with smaller clusters around 0.3288–0.3305. A short sweep followed by a drop below 0.3054 would weaken upside continuation.
⚖️ Losing 0.3048 without reclaiming it would shift preference toward a long-liquidation sweep at 0.3008–0.3020. Holding below 0.3008 would put 0.2984–0.3004, then 0.2965–0.2978 in focus; the largest long bar stands out around 0.2988.
#LiquidationMap