
Something interesting happened in October’s U.S. inflation numbers.
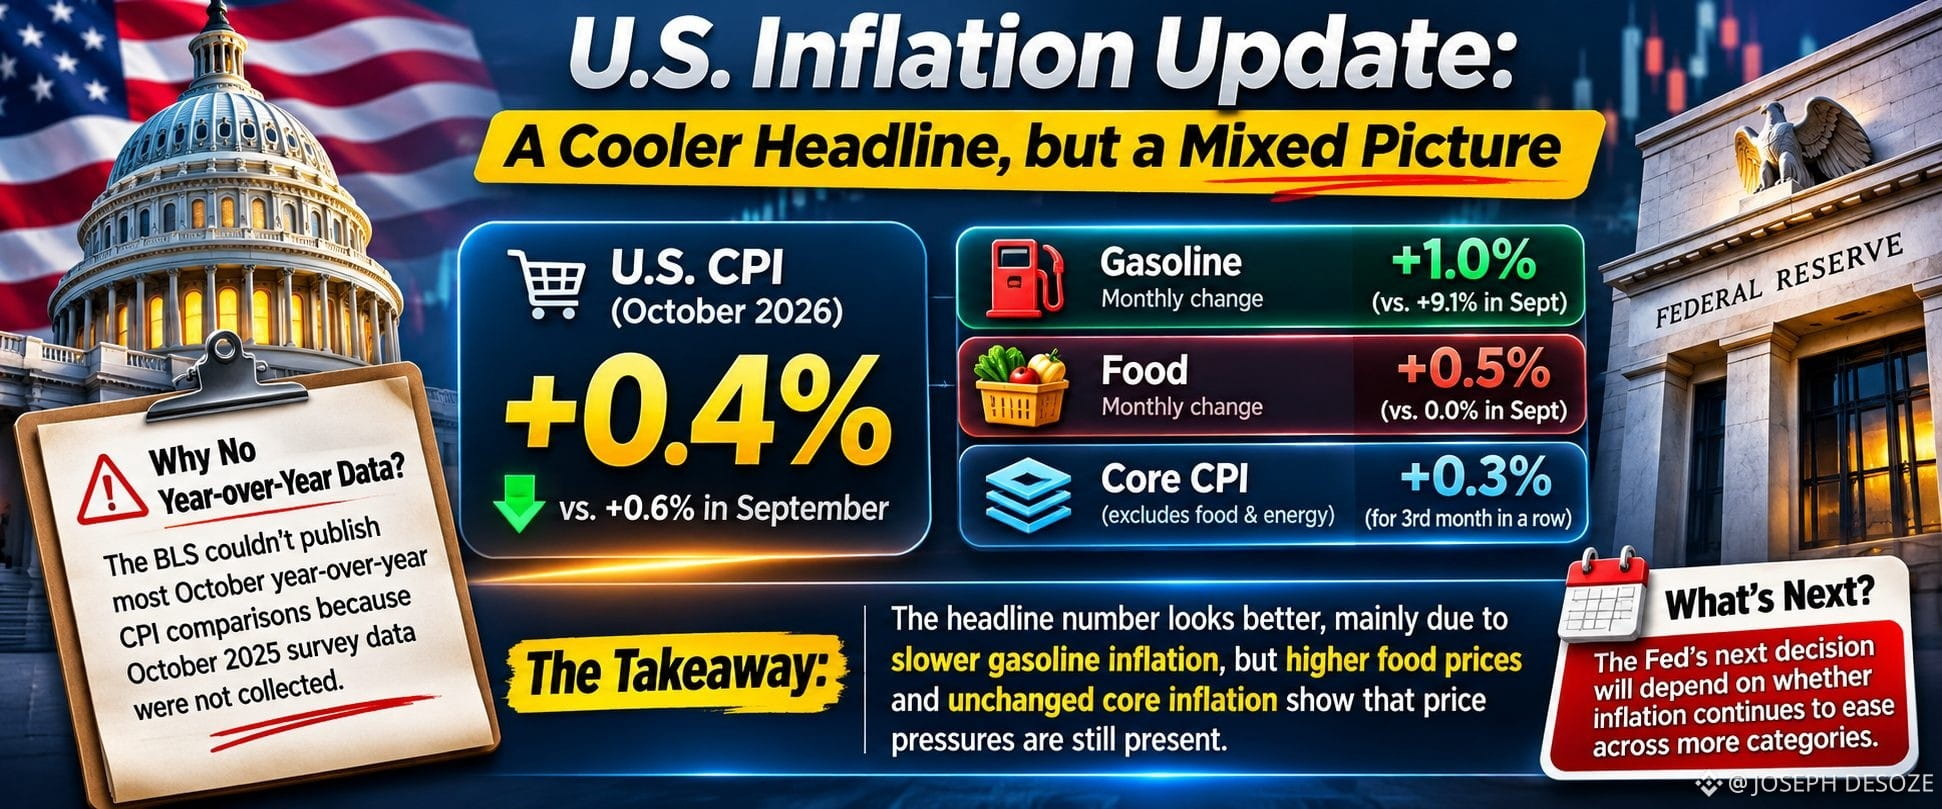
Gasoline prices, which jumped 9.1% in September, increased just 1.0% in October. That's a big slowdown, and it helped bring monthly headline CPI down from 0.6% to 0.4%.
But here's the part I wouldn't overlook.
Food prices moved in the opposite direction, rising 0.5% after showing no change in September. Grocery prices also climbed 0.4%.
Core CPI, which excludes food and energy, remained at 0.3% for the third month in a row.
So, while the headline figure looks a little more comfortable, the underlying picture isn't quite as simple.
I think this is where investors need to look beyond the first number they see. Falling energy momentum is encouraging, but it doesn't necessarily mean everyday price pressures are easing across the board.
There's another detail worth knowing: the BLS couldn't publish most year-over-year comparisons for October because the previous year's October survey data were never collected.
That makes the monthly figures especially important to interpret carefully.
For markets, the real question isn't whether one inflation reading looks better. It's whether that improvement continues across different parts of the economy.
That's what I'll be watching as expectations around the Fed's next decision develop.
#USGovernment #US #Inflation #FederalReserve #crypto
VERIFY BEFORE POSTING:
* All October CPI figures and September comparisons against the official BLS release.
* Missing year-over-year comparisons and the October 2025 data-collection explanation.
* Confirm campaign acceptance of post-release analysis.
Gasoline prices, which jumped 9.1% in September, increased just 1.0% in October. That's a big slowdown, and it helped bring monthly headline CPI down from 0.6% to 0.4%.
But here's the part I wouldn't overlook.
Food prices moved in the opposite direction, rising 0.5% after showing no change in September. Grocery prices also climbed 0.4%.
Core CPI, which excludes food and energy, remained at 0.3% for the third month in a row.
So, while the headline figure looks a little more comfortable, the underlying picture isn't quite as simple.
I think this is where investors need to look beyond the first number they see. Falling energy momentum is encouraging, but it doesn't necessarily mean everyday price pressures are easing across the board.
There's another detail worth knowing: the BLS couldn't publish most year-over-year comparisons for October because the previous year's October survey data were never collected.
That makes the monthly figures especially important to interpret carefully.
For markets, the real question isn't whether one inflation reading looks better. It's whether that improvement continues across different parts of the economy.
That's what I'll be watching as expectations around the Fed's next decision develop.
#USGovernment #US #Inflation #FederalReserve #crypto
VERIFY BEFORE POSTING:
* All October CPI figures and September comparisons against the official BLS release.
* Missing year-over-year comparisons and the October 2025 data-collection explanation.
* Confirm campaign acceptance of post-release analysis.